JCMT HARP CO 3-2 Observations of Molecular Outflows in W5
Abstract
New JCMT HARP CO 3-2 observations of the W5 star forming complex are presented, totaling an area of arcmin2 with sensitivity better than 0.1 K per 0.4 km s-1 channel. We discovered 55 CO outflow candidates, of which 40 are associated with W5 and 15 are more distant than the Perseus arm. Most of the outflows are located on the periphery of the W5 HII region. However, two outflow clusters are pc from the ionization fronts, indicating that their driving protostars formed without directly being triggered by the O-stars in W5. We compare the derived outflow properties to those in Perseus and find that the total W5 outflow mass is surprisingly low given the cloud masses. The outflow mass deficiency in the more massive W5 cloud () can be explained if ionizing radiation dissociates molecules as they break out of their host cloud cores. Although CO J=3-2 is a good outflow tracer, it is likely to be a poor mass tracer because of sub-thermal line excitation and high opacity, which may also contribute to the outflow mass discrepancy. It is unlikely that outflows could provide the observed turbulent energy in the W5 molecular clouds even accounting for undetected outflow material. Many cometary globules have been observed with velocity gradients from head to tail, displaying strong interaction with the W5 HII region and exhibiting signs of triggered or revealed star formation in their heads. Because it is observed face-on, W5 is an excellent region to study feedback effects, both positive and negative, of massive stars on star formation.
keywords:
ISM: jets and outflows — ISM: kinematics and dynamics — ISM: individual: W5 — stars: formation1 Introduction
Galactic-scale shocks such as spiral density waves promote the formation of giant molecular clouds (GMCs) where massive stars, star clusters, and OB associations form. The massive stars in such groups can either disrupt the surrounding medium or promote further star formation. While ionizing and soft UV radiation, stellar winds, and eventually supernova explosions destroy clouds in the immediate vicinity of massive stars, as the resulting bubbles age and decelerate, they can also trigger further star formation. In the “collect and collapse” scenario (e.g. Elmegreen & Lada 1977), gas swept-up by expanding bubbles can collapse into new star-forming clouds. In the “radiation-driven implosion” model (Bertoldi & McKee 1990; Klein et al. 1983), pre-existing clouds may be compressed by photo-ablation pressure or by the increased pressure as they are overrun by an expanding shell. In some circumstances, forming stars are simply exposed as low-density gas is removed by winds and radiation from massive stars. These processes may play significant roles in determining the efficiency of star formation in clustered environments (Elmegreen 1998).
Feedback from low mass stars may also control the shape of the stellar initial mass function in clusters (Adams & Fatuzzo 1996; Peters et al. 2010). Low mass young stars generate high velocity, collimated outflows that contribute to the turbulent support of a gas clump, preventing the clump from forming stars long enough that it is eventually blown away by massive star feedback. It is therefore important to understand the strength of low-mass protostellar feedback relative to other feedback mechanisms.
Outflows are a ubiquitous indicator of the presence of ongoing star formation (Reipurth & Bally 2001). CO outflows are an indicator of ongoing embedded star formation at a younger stage than optical outflows because shielding from the interstellar radiation field is required for CO to survive. Although Herbig- Haro shocks and knots reveal the locations of the highest-velocity segments of these outflows, CO has typically been thought of as a “calorimeter” measuring the majority of the mass and momentum ejected from protostars or swept up by the ejecta (Bachiller 1996).
The W5 star forming complex in the outer galaxy is a prime location to study massive star formation and triggering. The bright-rimmed clouds in W5 have been recognized as good candidates for ongoing triggering by a number of groups (Lefloch et al. 1997; Thompson et al. 2004; Karr & Martin 2003). The clustering properties were analyzed by Koenig et al. (2008) using Spitzer infrared data, and a number of significant clusters were discovered. The whole W5 complex may be a product of triggering, as it is located on one side of the W4 chimney thought to be created by multiple supernovae during the last 10 MYr (Oey et al. 2005, Figure 1).
Following Koenig et al. (2008), we adopt a distance to W5 of 2 kpc based on the water-maser parallax distance to the neighboring W3(OH) region (Hachisuka et al. 2006). As with W3, the W5 cloud is substantially () closer than its kinematic distance would suggest ( kpc). Given this distance, Koenig et al. (2008) derived a total gas mass of 6.5 from a 2 extinction map.
The W5 complex was mapped in the 12CO 1-0 emission line by the Five College Radio Astronomy Observatory (FCRAO) using the SEQUOIA receiver array (Heyer et al. 1998). The same array was used to map W5 in the 1-0 line (C. Brunt, private communication). Some early work searched for outflows in W5 (Bretherton et al. 2002), but the low-resolution CO 1-0 data only revealed a few, and only one was published. The higher resolution and sensitivity observations presented here reveal many additional outflows.

While W5 is thought to be associated with the W3/4/5 complex, there are other infrared sources in the same part of the sky that are not obviously associated with W5. Some of these have been noted to be in the outer arm (several kpc behind W5) by Digel et al. (1996) and Snell et al. (2002).
In section 2, we present the new and archival data used in our study. In section 3, we discuss the outflow detection process and compare outflow detectability in W5 to that in Perseus. In section 4, we discuss the physical properties of the outflows and their implications for star formation in the W5 complex. In section 5, we briefly describe the outer-arm outflows discovered.
2 OBSERVATIONS
2.1 JCMT HARP CO 3-2
CO J=3-2 345.79599 GHz data were acquired at the 15 m James Clerk Maxwell Telescope (JCMT) using the HARP array on a series of observing runs in 2008. On 2-4 January, 2008, 800 square arcminutes were mapped. During the run, , the zenith opacity at 225 GHz measured using the Caltech Submillimeter Observator tipping radiometer, ranged from 0.1 to 0.4 (111http://docs.jach.hawaii.edu/JCMT/SCD/SN/002.2/node5.html). Additional areas were mapped on 4-7 August, 16-20 and 31 October, and 1 and 12-15 Nov 2008 in similar conditions. A total of 3 square degrees (12000 arcmin2) in the W5 complex were mapped (a velocity-integrated mosaic is shown in Figure 2).
HARP is a 16 pixel SIS receiver array acting as a front-end to the ACSIS digital auto-correlation spectrometer. In January 2008, 14 of the 16 detectors were functional. In the 2nd half of 2008, 12 of 16 were functional, necessitating longer scans to achieve similar S/N.
In January 2008, a single spectral window centered at 345.7959899 with bandwidth 1.0 GHz and channel width 488 kHz (0.42 km s-1) was used. In August 2008 and later, we used 250 MHz bandwidth and 61 kHz (0.05 km s-1) channel width. At this frequency, the beam FWHM is 14″ (0.14 pc at a distance of 2 kpc) 222http://docs.jach.hawaii.edu/JCMT/OVERVIEW/tel_overview/.
A raster mapping strategy was used. In 2008, the array was shifted by 1/2 of an array spacing (58.2″) between scans. Data was sampled at a rate of per integration. Two perpendicular scans were used for each field observed. Most fields were 1010′ and took minutes. When only 12 receptors were available, 1/4 array stepping (29.1″) was used with a sample rate of per integration.
Data were reduced using the SMURF package within the STARLINK software distribution 333http://starlink.jach.hawaii.edu/. The SMURF command makecube was used to generate mosaics of contiguous sub-fields. The data were gridded on to cubes with 6″ pixels and smoothed with a -pixel gaussian, resulting in a map FWHM resolution of 18″(0.17 pc). A linear fit was subtracted from each spectrum over emission-free velocities (generally -60 to -50 and -20 to -10 km s-1) to remove the baseline. The final map RMS was in 0.42 km s-1 channels.
The sky reference position (off position) in January 2008 was J2000 2:31:04.069 +62:59:13.81. In later epochs, off positions closer to the target fields were selected from blank sky regions identified in January 2008 in order to increase observing efficiency. A main-beam efficiency was used as per the JCMT website to convert measurements to , though maps and spectra are presented in the original units.
2.2 FCRAO Outer Galaxy Survey
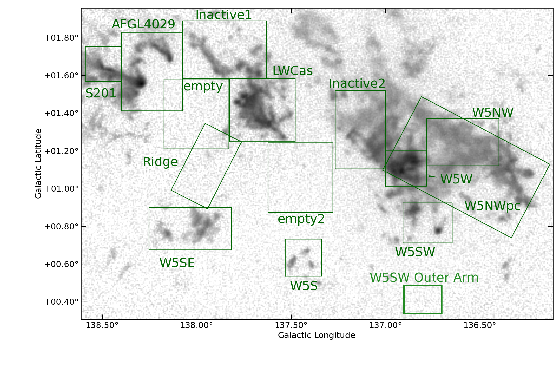
The FCRAO Outer Galaxy Survey (OGS) observed the W5 complex in (Heyer et al. 1998) and 1-0 (C. Brunt, private communication). The data cube achieved a mean sensitivity of 0.35 K per 0.13 km s-1 channel, or 0.6 K km s-1 integrated. The cube was integrated over all velocities and resampled to match the BGPS map using the montage444http://montage.ipac.caltech.edu/ package. The FWHM beam size was 50(0.48 pc). The integrated data cube, with a sensitivity km s-1, is displayed with region name identifications in Figure 3.
2.3 Spitzer
Spitzer IRAC and MIPS 24 images from Koenig et al. (2008) were used for morphological comparison. The reduction and extraction techniques are detailed in their paper.

3 Analysis
3.1 Outflow Detections
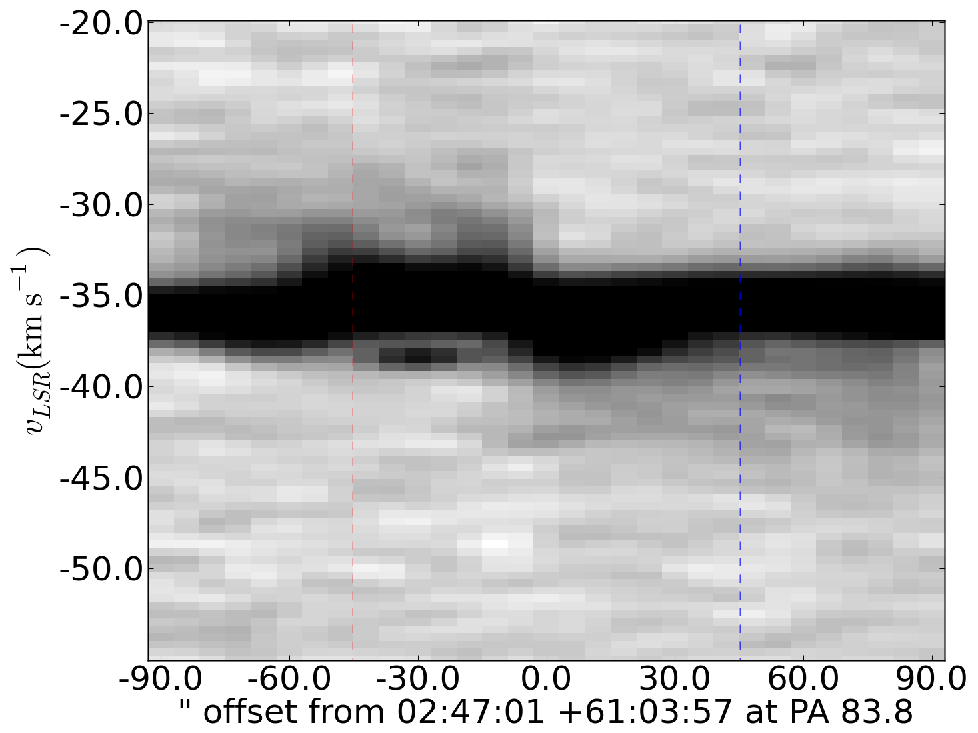
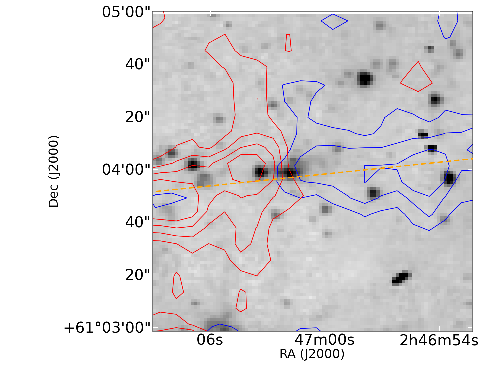
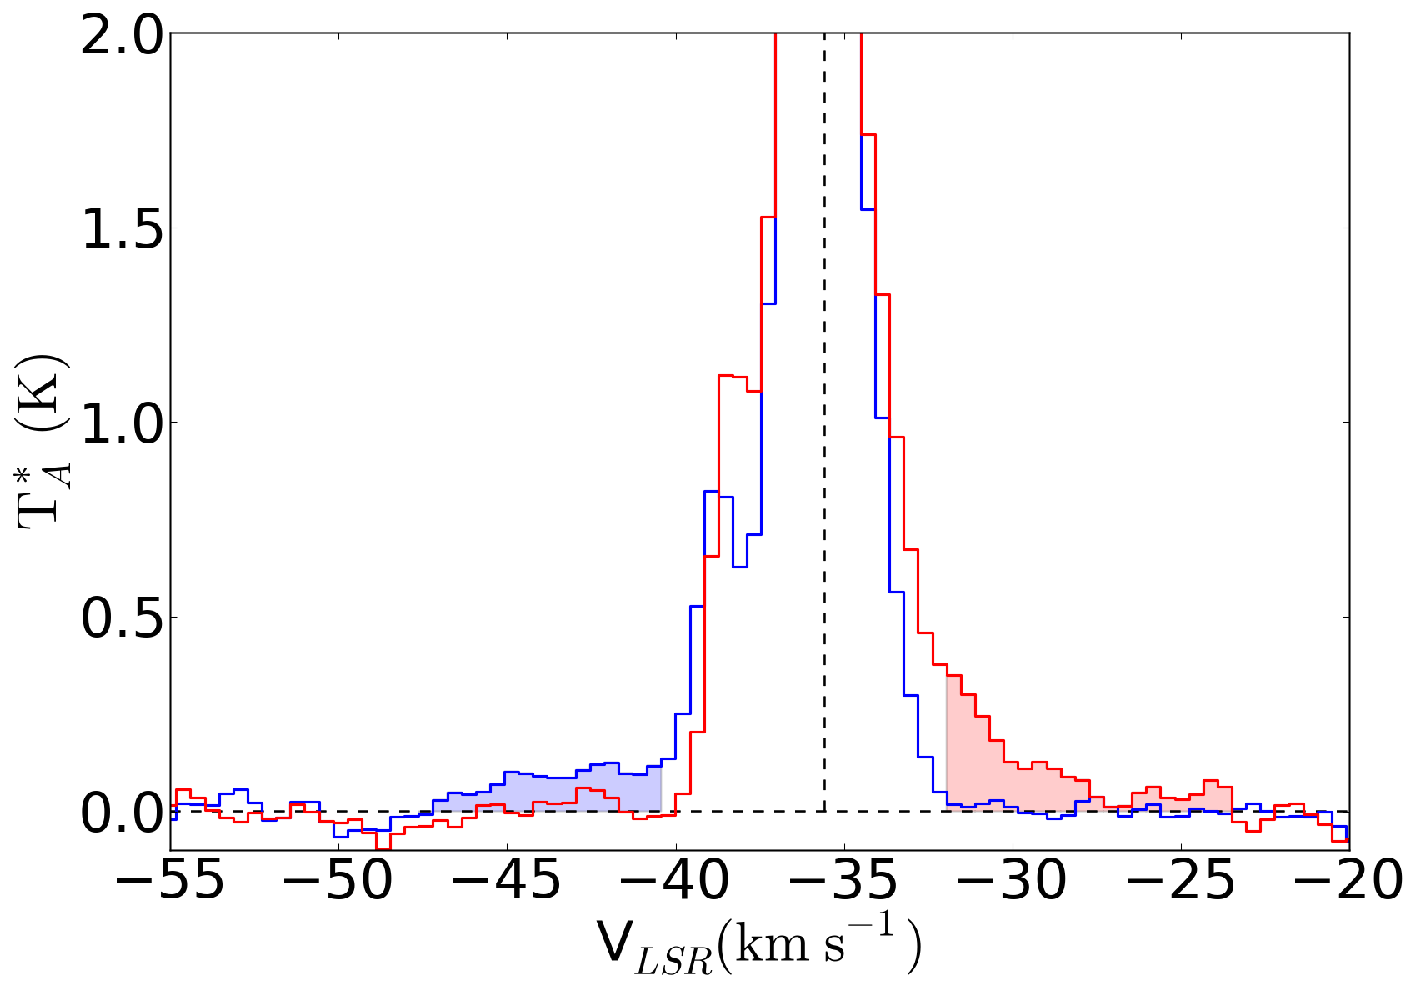
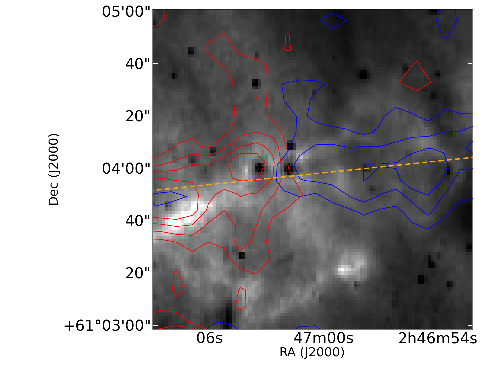
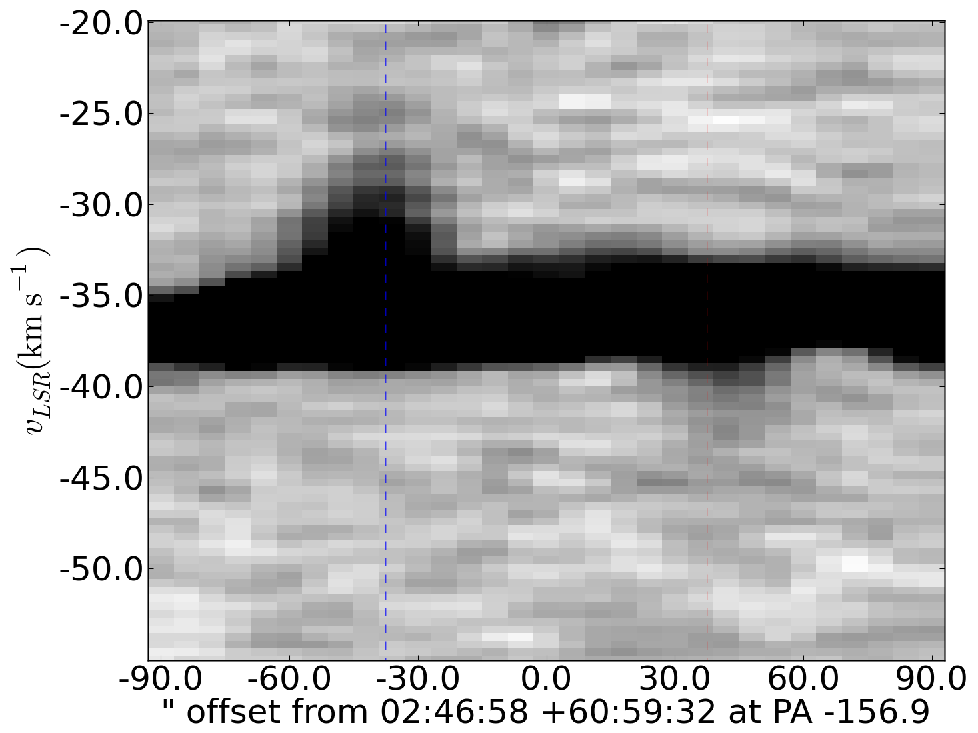
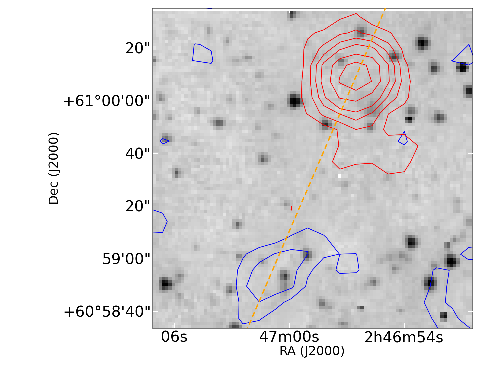
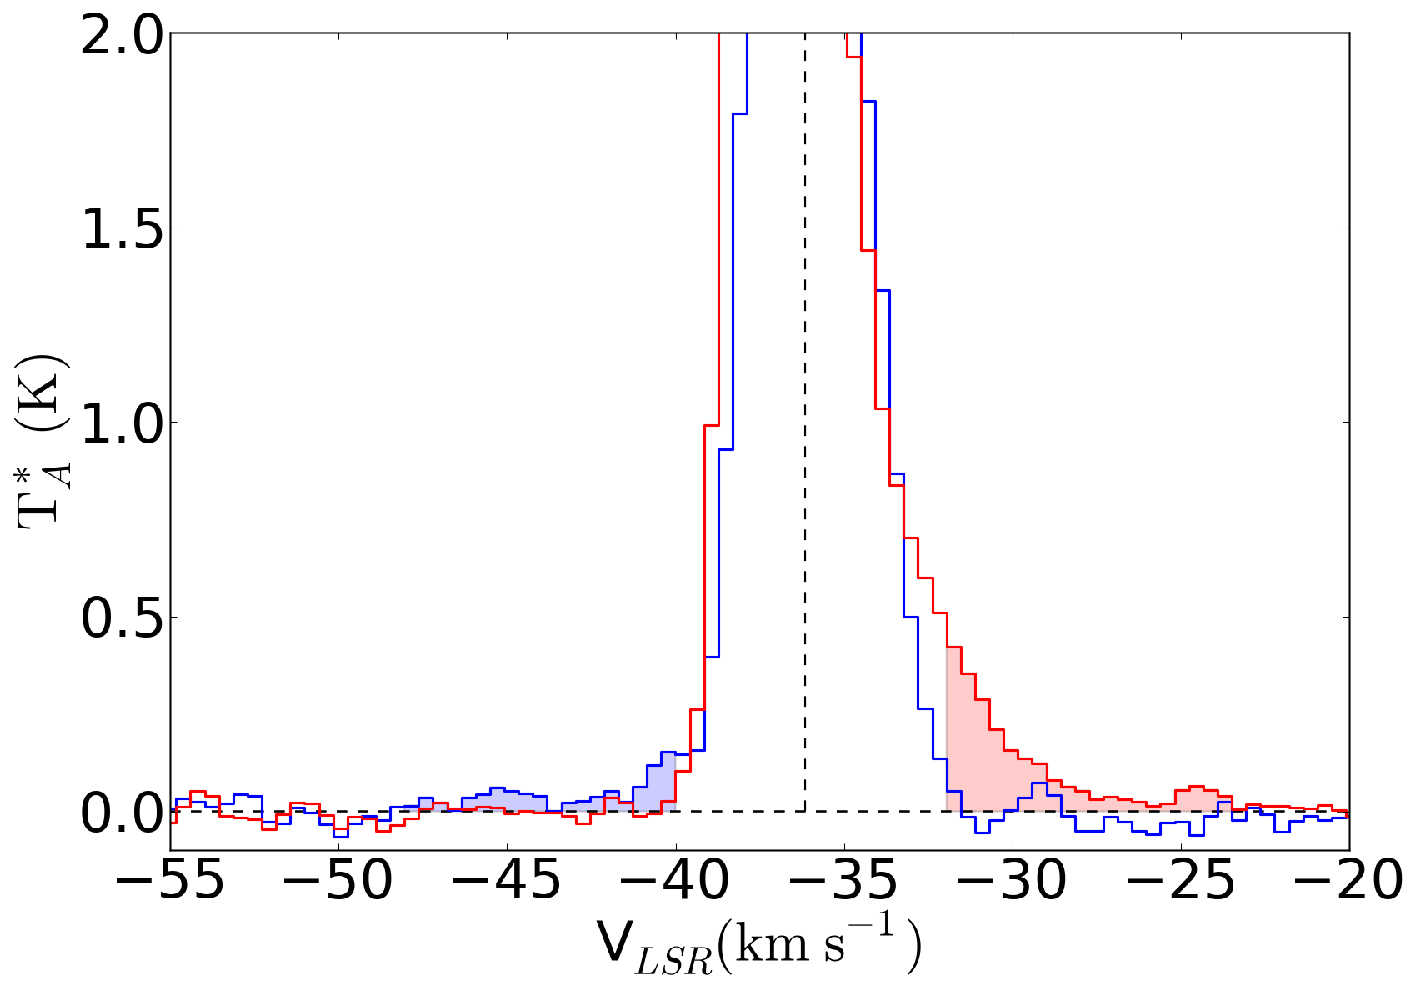
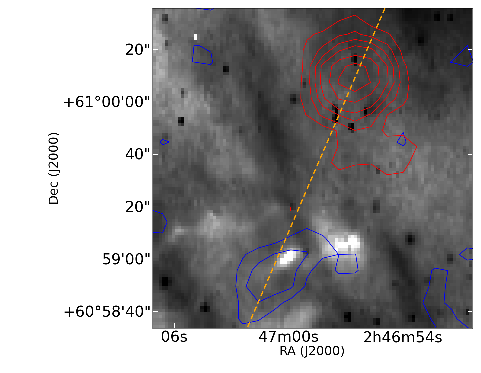
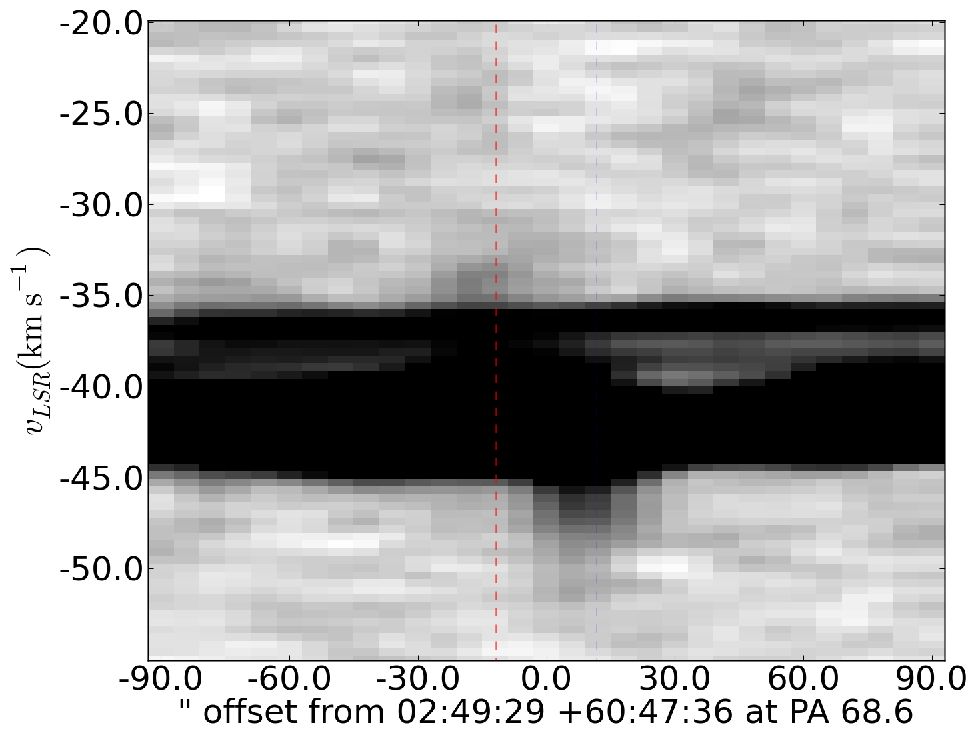
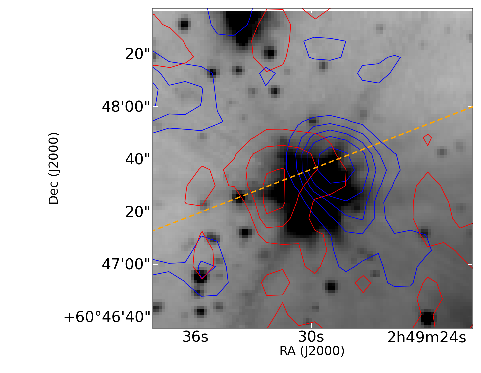
Outflows were identified in the CO data cubes by manually searching through position-velocity space for line wings using STARLINK’s GAIA display software. Outflow candidates were identified by high velocity wings inconsistent with the local cloud velocity distribution, which ranged from a width of 3 km s-1 to 7 km s-1. Once an outflow candidate was identified in the position-velocity diagrams, the velocity range over which the wing showed emission in the position-velocity diagram (down to ) was integrated over to create a map from which the approximate outflow size and position was determined (e.g. Figures 4 and 5).
Unlike Curtis et al. (2010) and Hatchell & Dunham (2009), we did not use an ‘objective’ outflow identification method because of the greater velocity complexity and poorer spatial resolution of our observations. The outflow selection criteria in these papers requires the presence of a sub-mm clump in order to identify a candidate driving source (and therefore a targeted region in which to search for outflows), making a similar objective identification impossible for our survey. As discussed later in Section 4, the regions associated with outflows have wide lines and many are double-peaked. Additionally, many smaller areas associated with outflows have collections of gaussian-profiled clumps that are not connected to the cloud in position-velocity diagrams but are not outflows. In particular, W5 is pockmarked by dozens of small cometary globules that are sometimes spatially coincident with the clouds but slightly offset in velocity.
While Arce et al. (2010) described the benefits of 3D visualization using isosurface contours, we found that the varying signal-to-noise across large-scale ( pixel2) regions with significant extent in RA/Dec and limited velocity dynamic range made this method diffult for W5. There were many low-intensity outflows that were detectable by careful searches through position-velocity space that are not as apparent using isosurface methods. Out of the 55 outflows reported here, only 14 555 Outflows 15, 20, 24, the cluster of outflows 26-32, 47, 48, 52, and 53 could all have readily been detected by pointed single-dish measurements. would be considered obvious, high-intensity, high-velocity flows from their spectra alone; the rest could not be unambiguously detected without a search through position-velocity space.
In the majority of sources, the individual outflow lobes were unresolved, although some showed hints of position-velocity gradients at low significance and in many the red and blue flows are spatially separated. Only Outflow 1’s lobes were clearly resolved (Figure 4). Some of most suggestive gradients occurred where the outflow merged with its host molecular cloud in position-velocity space, making the gradient difficult to distinguish (e.g., Outflow 12, Figure 6). Bipolar pairs were selected when there were red and blue flows close to one another. The classification of a bipolar flow was either ‘yc’ (yes - confident), ‘yu’ (yes - unconfident), or ‘n’ (no) in Table LABEL:tab:outflows. This identification is discussed in the captions for each outflow figure in the online supplement. The AFGL 4029 region has many red and blue lobes but confusion prevented pairing.
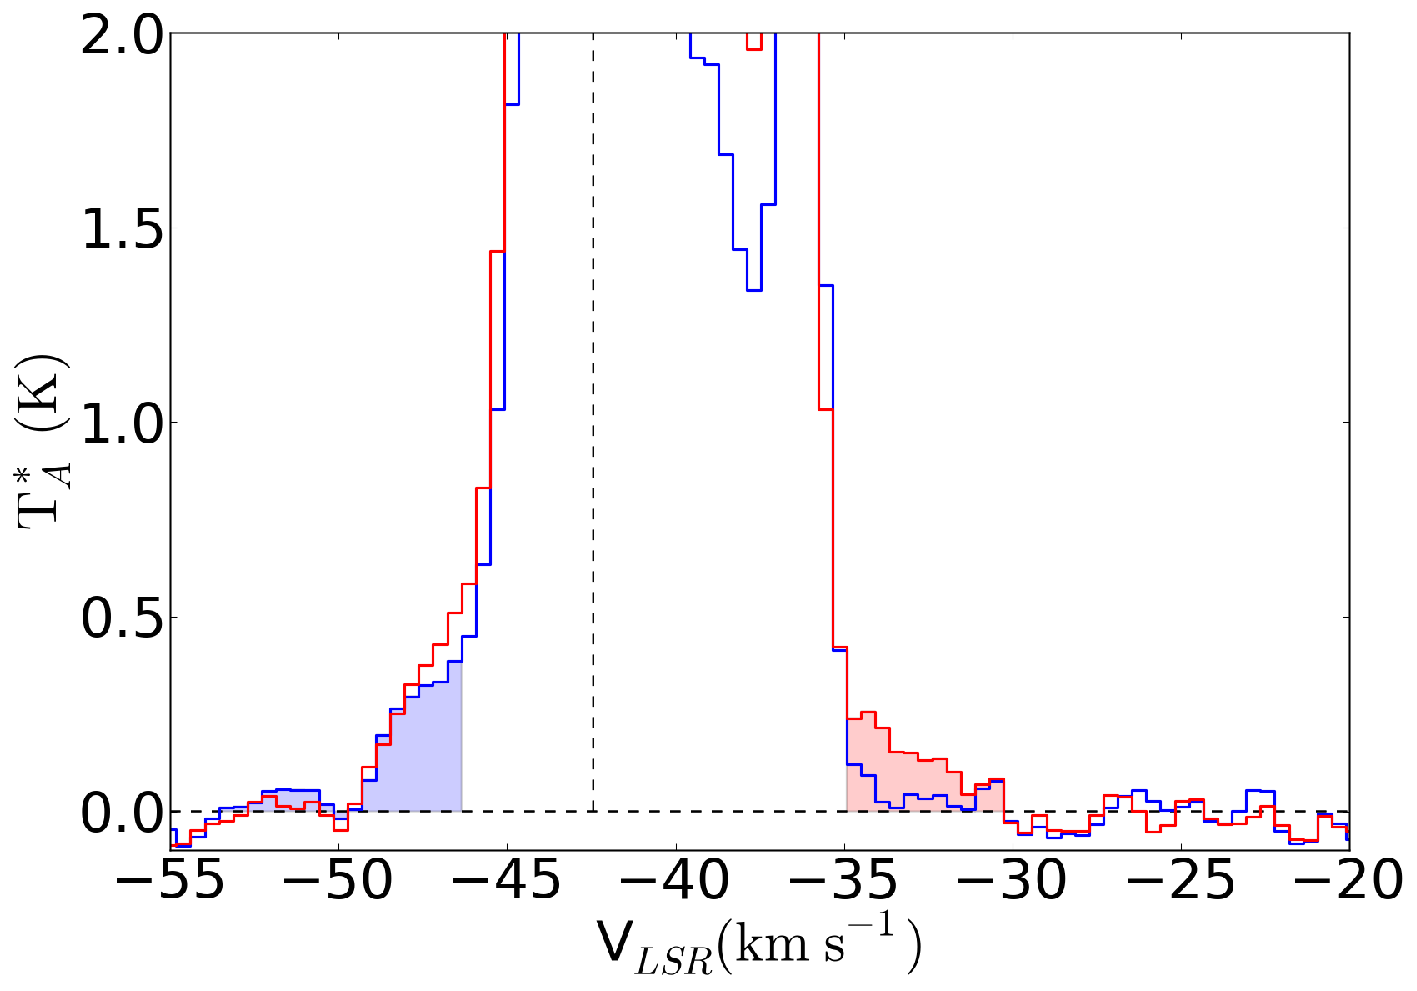
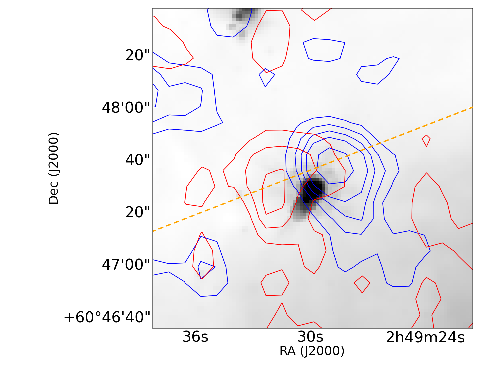
In cases where only the red- or blue-shifted lobe was visible, the surrounding pixels were searched for lower-significance and lower-velocity counterparts. For cases in which emission was detected, a candidate counterflow was identified and incorporated into the catalog. However, in 12 cases, the counterflow still evaded detection, either because of confusion or because the counterflow is not present in CO.
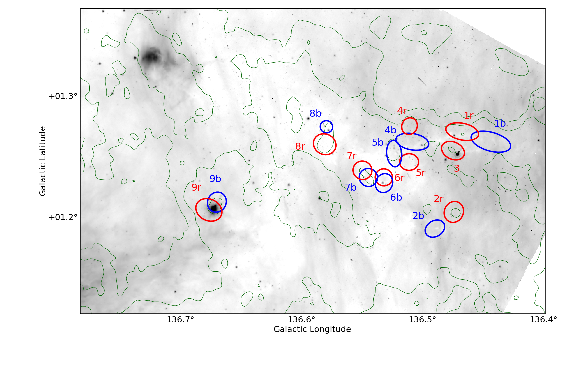
The outflow positions are overlaid on the CO 3-2 image in Figure 2 to provide an overview of where star formation is most active. The figures in Section 5.2 show outflow locations overlaid on small-scale images.
Because our detection method involved searching for high-velocity outflows by eye, there should be no false detections. However, it is possible that some of these outflows are generated by mechanisms other than protostellar jets and winds since we have not identified their driving sources.
One possible alternative driving mechanism is a photoevaporation flow, which could be accelerated up to the sound speed of the ionized medium, km s-1. Gas accelerating away from the cloud would not be detected as an outflow because it would be rapidly ionized. However, gas driven inward would be accelerated and remain molecular. It could exhibit red and / or blue flows depending on the line of sight orientation. While there are viable candidates for this form of outflow impersonator, such flows can only have peak velocities km s-1 in the strong adiabatic shock limit, so that any gas seen with higher velocity tails are unlikely to be radiation-driven.
Another plausible outflow impostor is the high-velocity tail in a turbulent distribution. However, for a typical molecular cloud, the low temperatures would require very high mach-number shocks ( assuming K and km s-1) that in idealized turbulence should be rare and short-lived. It is not known how frequent such high-velocity excursions will be in non-ideal turbulence with gravity (A. Goodman, P. Padoan, private communication). Finally, it is less likely for turbulent intermittency to have nearly coincident red and blue lobes, so intermittency can be morphologically excluded in most cases.
3.1.1 Comparison to Perseus CO 3-2 observations
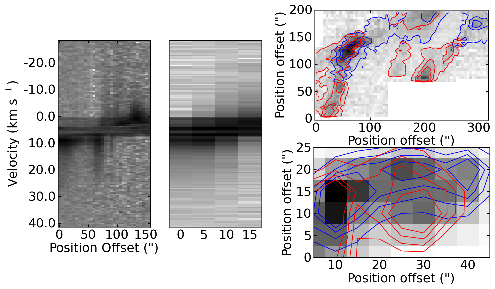
We used the HARP CO 3-2 cubes from Hatchell et al. (2007) to evaluate our ability to identify outflows. We selected an outflow that was well-resolved and unconfused, L1448, and evaluated it at both the native sensitivity of the Hatchell et al. (2007) observations and degraded in resolution and sensitivity to match our own. We focus on L1448 IRS2, labeled Outflow 30 in Hatchell et al. (2007). Figure 7 shows a comparison between the original quality and degraded data.
Integrating over the outflow velocity range, we measure each lobe to be about (pc). Assuming a distance to Perseus of 250 pc (e.g. Enoch et al. 2006), we smooth by a factor of 8 by convolving the cube with a FWHM = 111″ gaussian, then downsample by the same factor of 8 to achieve 6″ square pixels at 2 kpc. The resulting noise was reduced because of the spatial and spectral smoothing and was measured to be K in 0.54 km s-1 channels, which is comparable to the sensitivity in our survey. It is still possible to distinguish the outflows from the cloud in position-velocity space. Each lobe is individually unresolved (long axis compared to our beam FWHM of 18″), but the two are separated by and therefore an overall spatial separation can still be measured. Because they are just barely unresolved at this distance, the lobes’ surface brightnesses are approximately the same at 2 kpc as at 250 pc; if this outflow were seen at a greater distance it would appear fainter.
Hatchell et al. (2007) detected 4 outflows within this map, plus an additional confused candidate. We note an additional grouping of outflowing material in the north-middle of the map(centered on coordinate 150150 in Figure 7). In the smoothed version, only three outflows are detected in the blue and two in the red, making flow-counterflow association difficult. The north-central blueshifted component appears to be the counterpart of the red flow when smoothed, although it is clearly the counterpart of the northwest blue flow in the full-resolution image.
We are therefore able to detect any outflows comparable to L1448 (assuming a favorable geometry), but are likely to see clustered outflows as single or possibly extended lobes and will count fewer lobes than would be detected at higher resolution. Additionally, it is clear from this example that two adjacent outflows with opposite polarity are not necessarily associated, and therefore the outflows’ source(s) may not be between the two lobes.
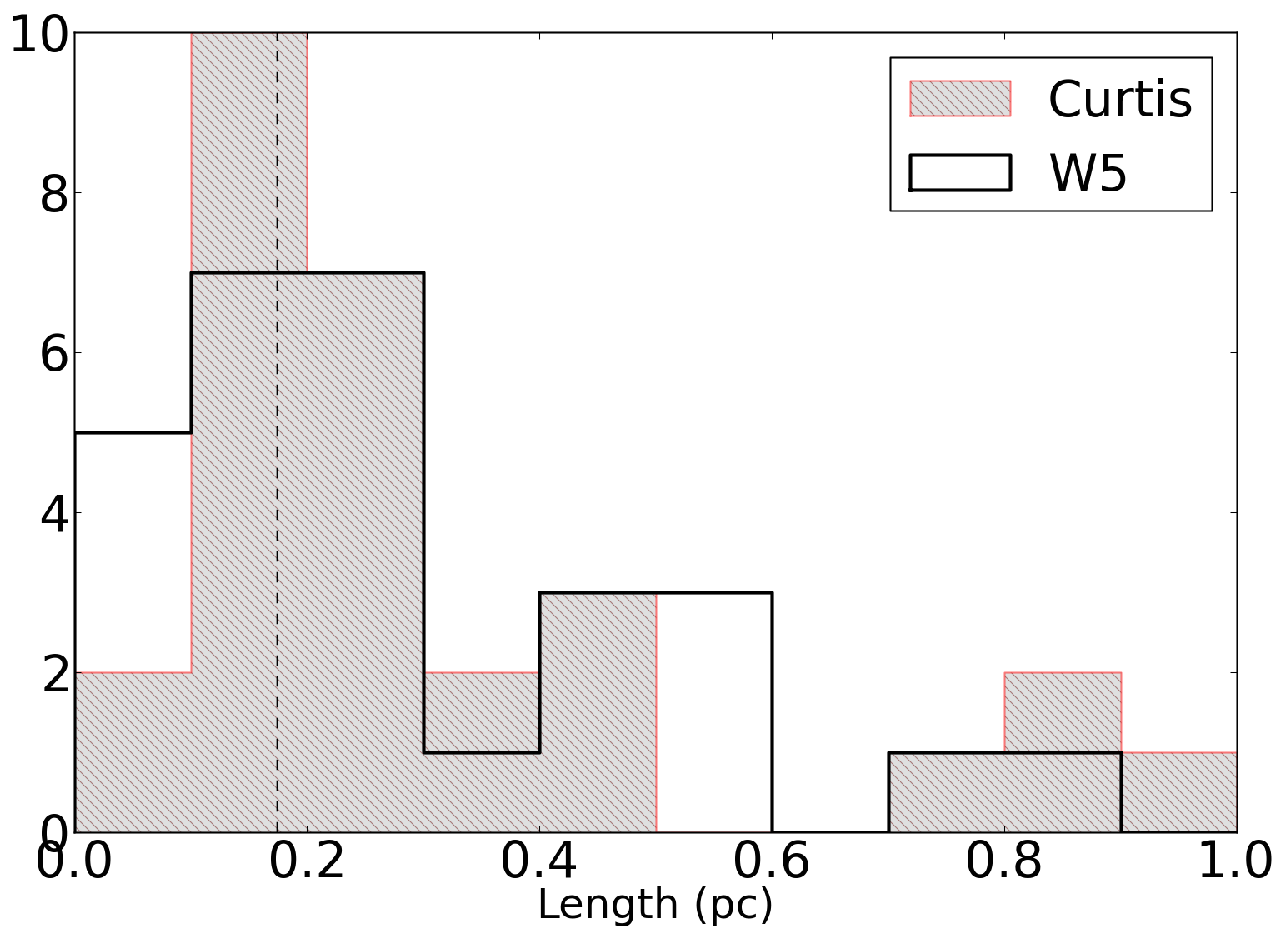
In order to determine overall detectability of outflows compared to Perseus, we compare to Curtis et al. (2010) in Figure 8. Out of 29 outflows in their survey with measured ‘lobe lengths’, 22 (71%) were smaller than 128″ which would be below our 18″ resolution if observed at 2 kpc. Even the largest lobes (HRF26R, HRF28R, HRF44B) would only extend at 2 kpc. Each lobe in the largest outflow in our survey, Outflow 1, is (660″ at 250pc), but no other individual outflow lobes in W5 are clearly resolved. However, as seen in Figure 8, many bipolar lobes are separated by more than the telescope resolution, and the overall lobe separation distribution (as opposed to the lobe length, which is mostly unmeasured in our sample) in W5 is quite similar to the separation distribution in Perseus. The 2-sample KS test gives a 25% probability that they are drawn from the same distribution (the null hypothesis that they are drawn from the same distribution cannot be rejected).
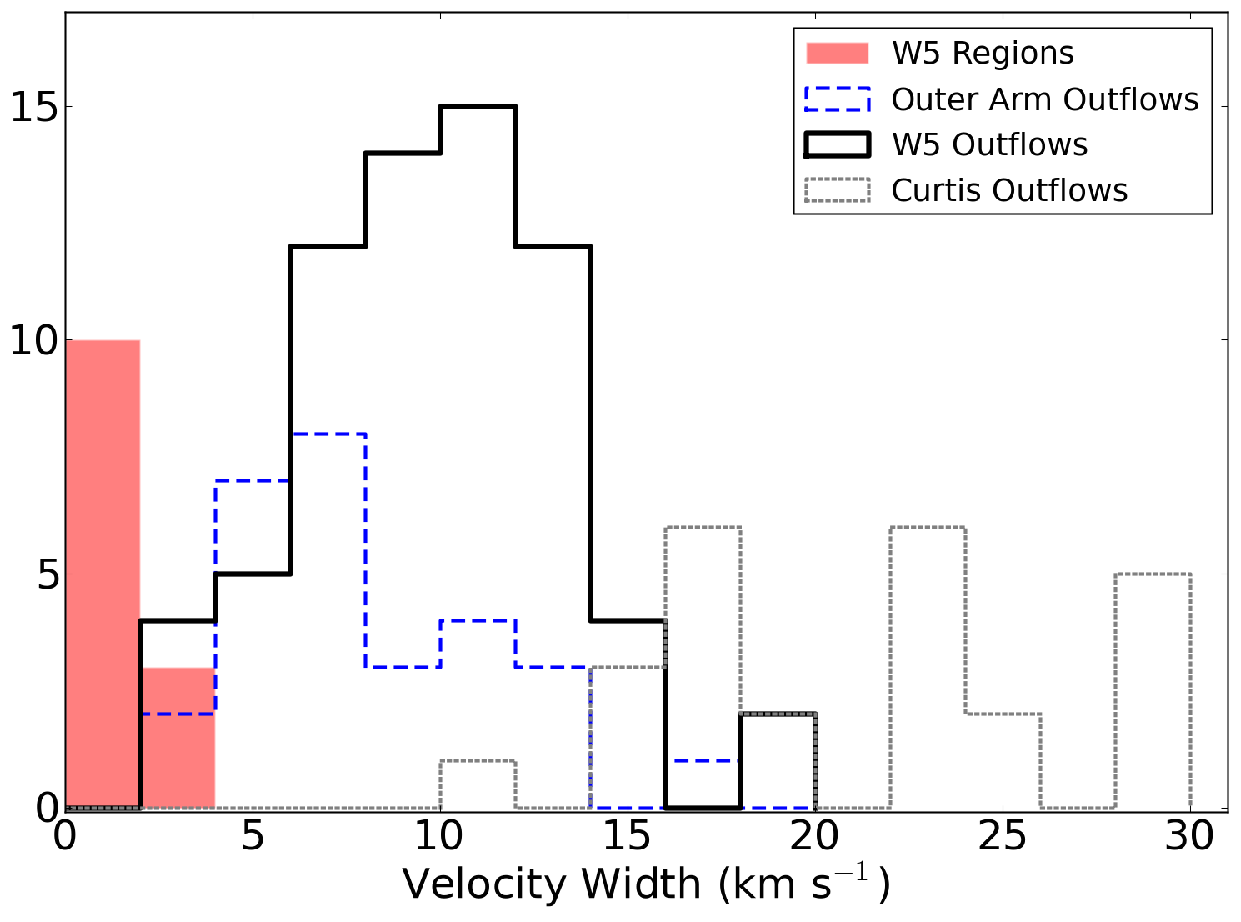
On average, the Curtis et al. (2010) outflow velocities are similar to ours (Figure 9). We detect lower velocity outflows because we do not set a strict lower velocity limit criterion. We do not detect the highest velocity outflows most likely because of our poorer sensitivity to the faint high-velocity tips of outflows, although it is also possible that no high-velocity ( km s-1) flows exist in the W5 region. Note that the histogram compares quantities that are not directly equivalent: the outflows in Curtis et al. (2010) and our own data are measured out to the point at which the outflow signal is lost, while the ‘region’ velocities are full-width half-max (FWHM) velocities.
Finally, we use the detectability of outflows in Perseus to inform our expectations in W5. Since it appears that we can detect outflows from low-mass protostars with sub-stellar to luminosities at the distance of W5 and these objects should be the most numerous in a standard initial mass function, the distribution of physical properties in W5 outflows should be similar to those in Perseus. However, because W5 is a somewhat more massive cloud ( 666 is estimated from . We also estimate the total molecular mass in W5 using the X-factor and acquire , in agreement with Karr & Martin (2003), who estimated a molecular mass of 4.4 from using the same X-factor. Koenig et al. (2008) estimated a total gas mass of 6.5 from a 2MASS extinction map. The total molecular mass in Perseus is (Bally et al. 2008)), we might expect the high-end of the distribution to extend to higher values of outflow mass, momentum, and energy. Since we will likely see clustered outflows confused into a smaller number of distinct lobes, we expect a bias towards higher values of the derived quantities but a lower detection rate.
3.1.2 Velocity, Column Density, and Mass Measurements
Throughout this section, we assume that the CO lines are optically thin and thermally excited. The measured properties are presented in Table LABEL:tab:outflows. These assumptions are likely to be invalid, so we also discuss the consequences of applying ‘typical’ optical depth corrections to the derived quantities. Because we do not measure optical depths and the optical depth correction for CO 3-2 is less well quantified than for CO 1-0 (Curtis et al. 2010; Cabrit & Bertout 1990)777In Curtis et al. (2010), this correction factor ranged from 1.8 to 14.3; Arce et al. (2010) did not enumerate the optical depth correction they used but it is typically around 7 (Cabrit & Bertout 1990). , we only present the uncorrected measurements in Table LABEL:tab:outflowsderived.
The outflow velocity ranges were measured by examining both RA-velocity and Dec-velocity diagrams interactively using the STARLINK GAIA data cube viewing tool. The velocity limits are set to include all outflow emission that is distinguishable from the cloud (i.e. the velocity at which outflow lobes dominate over the gaussian wing of the cloud emission) down to zero emission. An outflow size (or lobe size, following Curtis et al. 2010) was determined by integrating over the blue and red velocity ranges and creating an elliptical aperture to include both peaks; the position and size therefore have approximately beam-sized () accuracy. The integrated outflow maps are shown as red and blue contours in Figure 5. The velocity center was computed by fitting a gaussian to the FCRAO spectrum averaged over the elliptical aperture.
The column density is estimated from J=3-2 assuming local thermal equilibrium (LTE) and optically thin emission using the equation for K. The derivation is given in the Appendix. The column density in the lobes is likely to be dominated by low-velocity gas and therefore our dominant uncertainty may be missing low-velocity emission rather than poor assumptions about the optical depth.
The scalar momentum and energy were computed from
| (1) |
| (2) |
where is the 1-0 centroid velocity. The same assumptions used in determining column density are applied here.
We estimate an outflow lifetime by taking half the distance between the red and blue outflow centroids divided by the maximum measured velocity difference (), , where refers to the length of the flow. This method assumes that the outflow inclination is 45∘; if it is more parallel to the plane of the sky, we overestimate the age, and vice-versa. The momentum flux is then . Similarly, we compute a mass loss rate by dividing the total outflow mass by the dynamical age, which yields what is likely a lower limit on the mass loss rate (if the lifetime is underestimated, the mass loss rate is overestimated, but the outflow mass is always a lower limit because of optical depth and confusion effects).
The dynamical ages are highly suspect since the red and blue lobes are often unresolved or barely resolved, and diffuse emission averaged with the lobe emission can shift the centroid position. Additionally, it is not clear what portion of the outflow corresponds to the centroid: the bow shock or the jet could both potentially dominate the outflow emission. Curtis et al. (2010) discuss the many ways in which the dynamical age can be in error. Our mass loss rates are similar to those in Perseus without correcting our measurements for optical depth, while our outflow masses are an order of magnitude lower. It therefore appears that our dynamical age estimates must be too low, since we have no reason to expect protostars in W5 to be undergoing mass loss at a greater rate than those in Perseus. However, given more reliable dynamical age estimates from higher resolution observations of shock tracers, the mass loss rates could be corrected and compared to other star-forming regions.
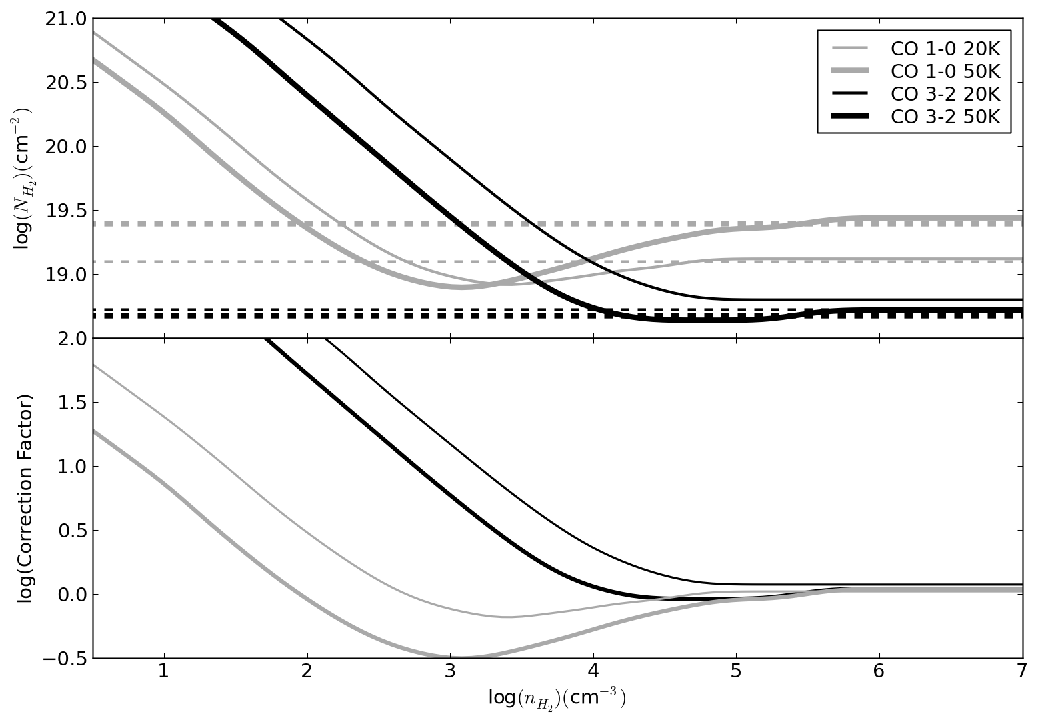
Because the emission was assumed to be optically thin, the mass, column, energy, and momentum measurements we present are strictly lower limits. While some authors have computed correction factors to 1-0 optical depths (e.g. Cabrit & Bertout 1990), the corrections are different for the 3-2 transition (1.8 to 14.3, Curtis et al. 2010). Additionally, CO 3-2 may require a correction for sub-thermal excitation because of its higher critical density (the CO 3-2 critical density is 27 times higher than CO 1-0; see Appendix A for modeling of this effect).
Additionally, most of the outflow mass is at the lowest distinguishable velocities in typical outflows (e.g. Arce et al. 2010). It is therefore plausible that in the more turbulent W5 region, a greater fraction of the outflow mass is blended (velocity confused) with the cloud and therefore not included in mass, momentum, and energy measurements. This omission could be greater than the underestimate due to poor opacity assumptions.
The total mass of the W5 outflows is , substantially lower, even with an optical depth correction of , than the 163 reported in Perseus (Arce et al. 2010). Arce et al. (2010) also include a correction factor of 2.5 to account for higher temperatures in outflows and a factor of 2 to account for emission blended with the cloud. The temperature correction is inappropriate for CO 3-2 (see Appendix A, Figure 27), but the resulting total outflow mass in W5 with an optical depth correction and a factor of 2 confusion correction is about 30 . In order to make our measurements consistent with a mass of 160 , a density upper limit in the outflowing gas of is required, since a lower gas density results in greater mass for a given intensity (see Appendix A, Figure 28). However, we expect the total outflow mass in W5 to be greater than in Perseus because of the greater cloud mass, implying that the density in the flows must be even lower, or additional corrections are needed.
The total outflow momentum is km s-1, versus a quoted 517 km s-1 in Perseus (Arce et al. 2010). Arce et al. (2010) included inclination and dissociative shock corrections for the momentum measurements on top of the correction factors already applied to the mass. If these corrections are removed from the Perseus momentum total (except for optical depth, which is variable in their data and therefore cannot be removed), the uncorrected outflow momentum in Perseus would be about 74 km s-1. The W5 outflow momentum, if corrected with a ‘typical’ optical depth in the range 7-14, would match or exceed this value. If an additional CO 3-2 excitation correction (in the range 1-20) is applied, the W5 outflow momentum would significantly exceed that in Perseus.
Assuming a turbulent line width km s-1 (approximately the smallest FWHM line-width observed), the total turbulent momentum in the ambient cloud is km s-1, which is times the measured outflow momentum - the outflows detected in our survey cannot be the sole source of the observed turbulent line widths, even if corrected for optical depth and missing mass.
Table 1 presents the turbulent momentum for each sub-region computed by multiplying the measured velocity width by the integrated mass. Even if the outflow measurements are orders of magnitude low because of optical depth, cloud blending, sub-thermal excitation, and other missing-mass considerations, outflows contribute negligibly to the total momentum of high velocity gas in W5. This result is unsurprising, as there are many other likely sources of energy in the region such as stellar wind bubbles and shock fronts between the ionized and molecular gas. Additionally, in regions unaffected by feedback from the HII region (e.g. W5NW), cloud-cloud collisions are a possible source of energy.
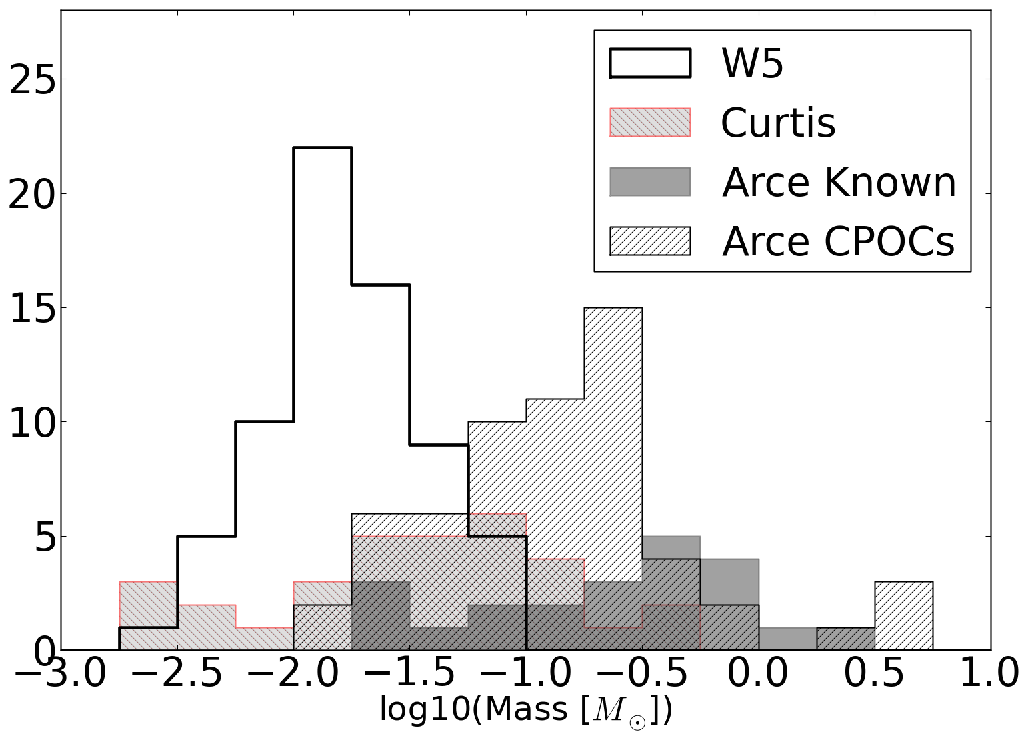
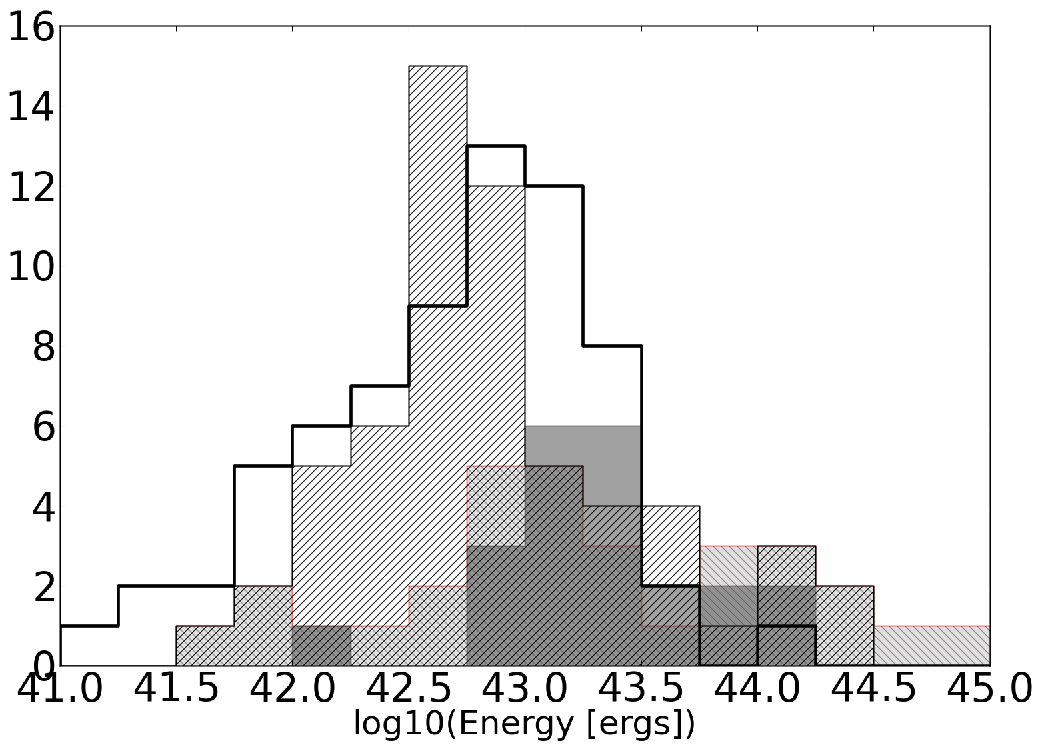
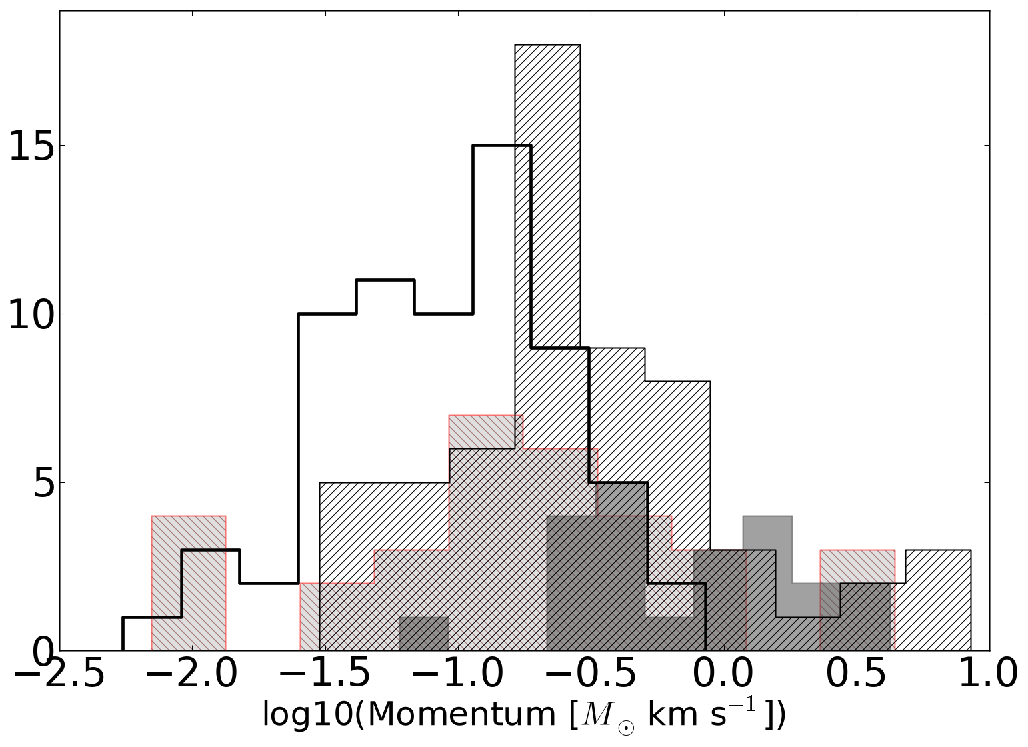
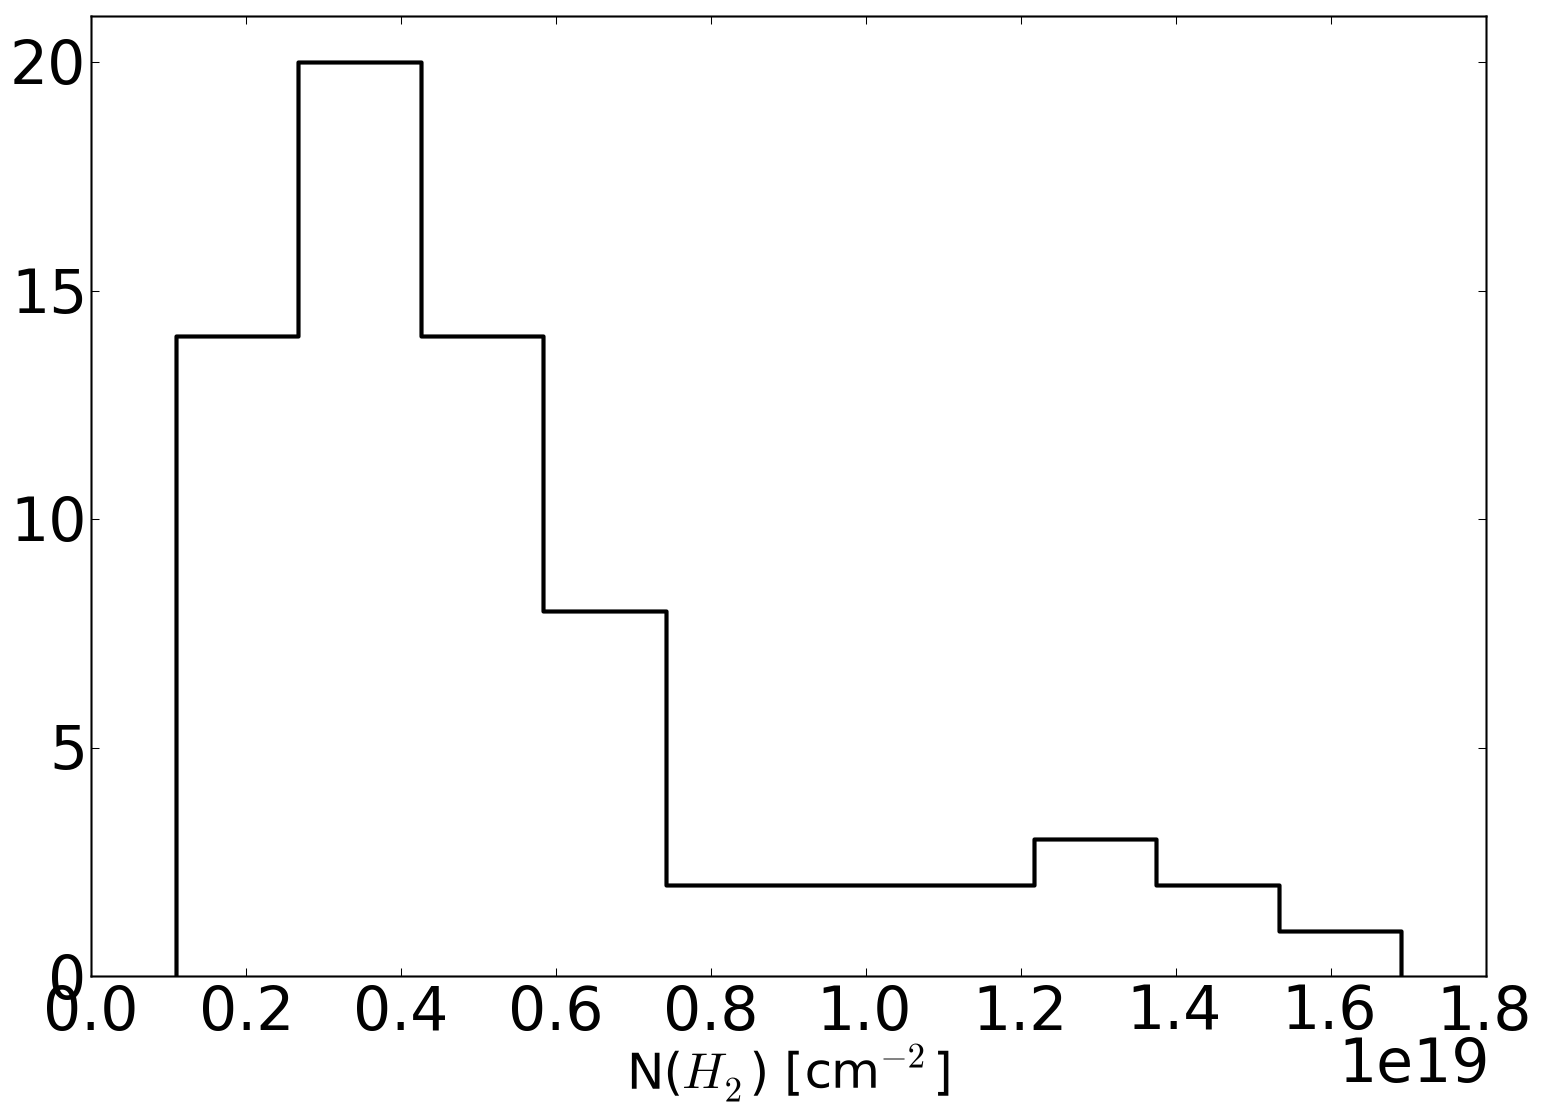
Figure 10 displays the distribution of measured properties and compares them to those derived in the COMPLETE (Arce et al. 2010) and Curtis et al. (2010) HARP CO 3-2 surveys of Perseus. Our derived masses are substantially lower than those in Arce et al. (2010) even if corrected for optical depth, but our momenta are similar to the CPOC (COMPLETE Perseus Outflow Candidate) sample and our energies are higher, indicating a bias towards detecting mass at high velocities. The bias is more heavily towards high velocities than the CO 1-0 used in Arce et al. (2010). The discrepancy between our values and those of Arce et al. (2010) and Curtis et al. (2010) can be partly accounted for by the optical depth correction applied in those works: was used to correct for opacity at low velocities, where most of the outflow mass is expected. Those works may also have been less affected by blending because of the smaller cloud line widths in Perseus.
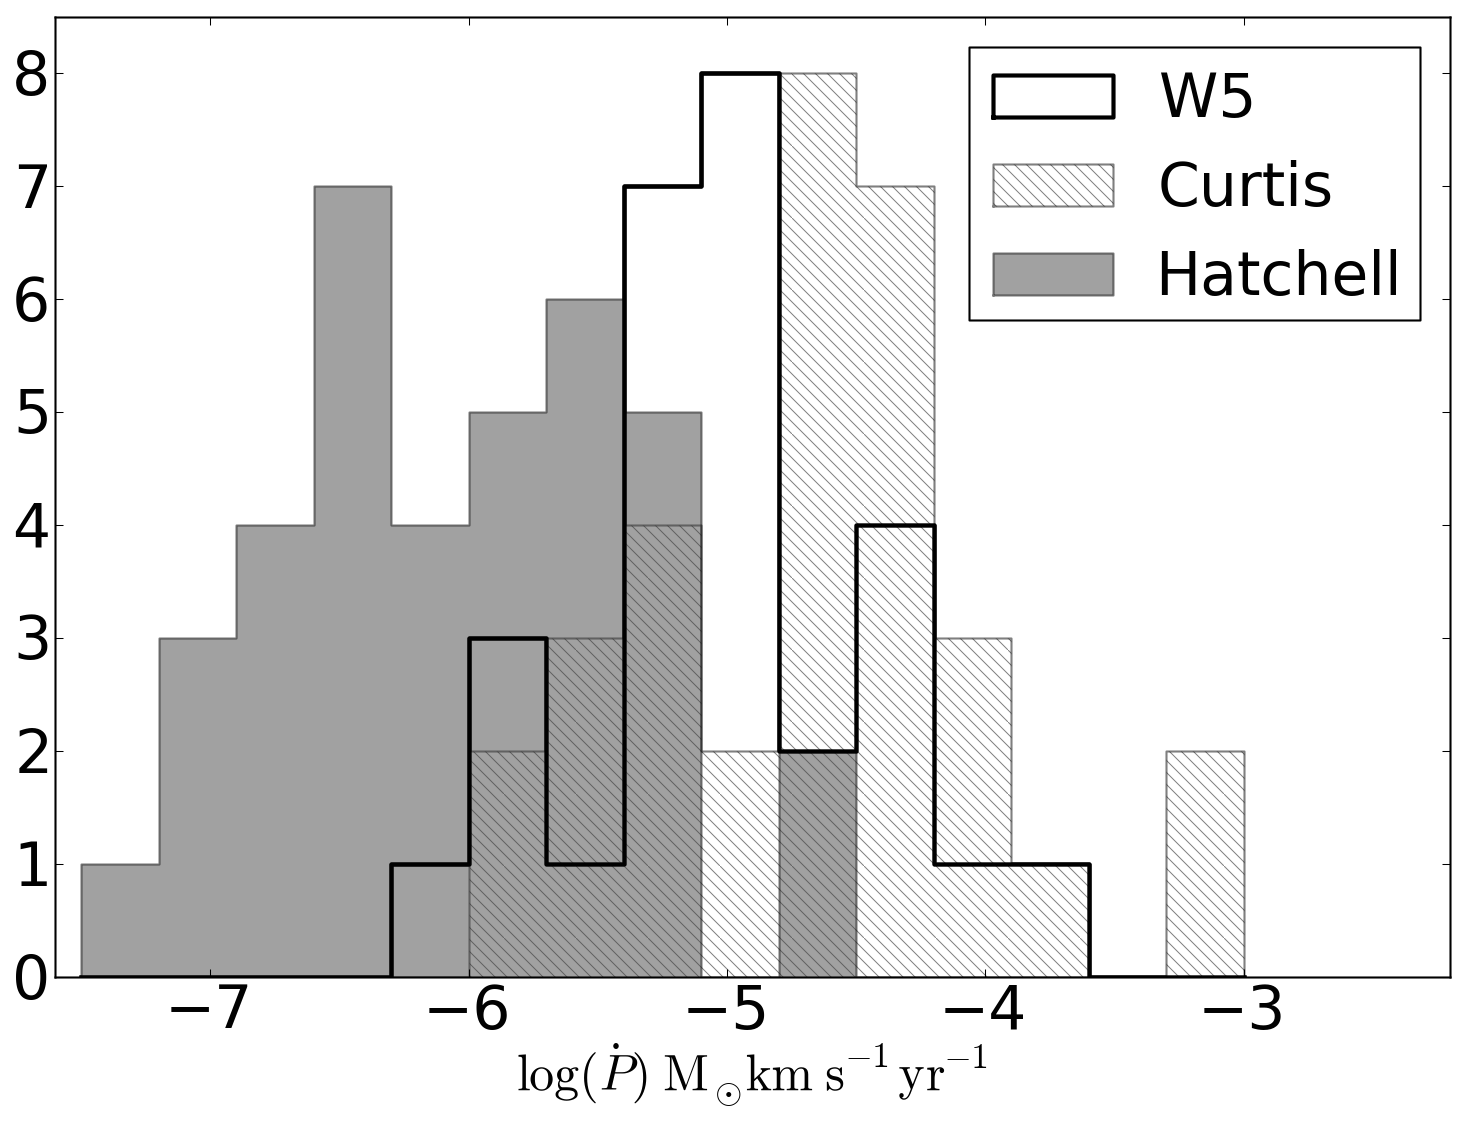
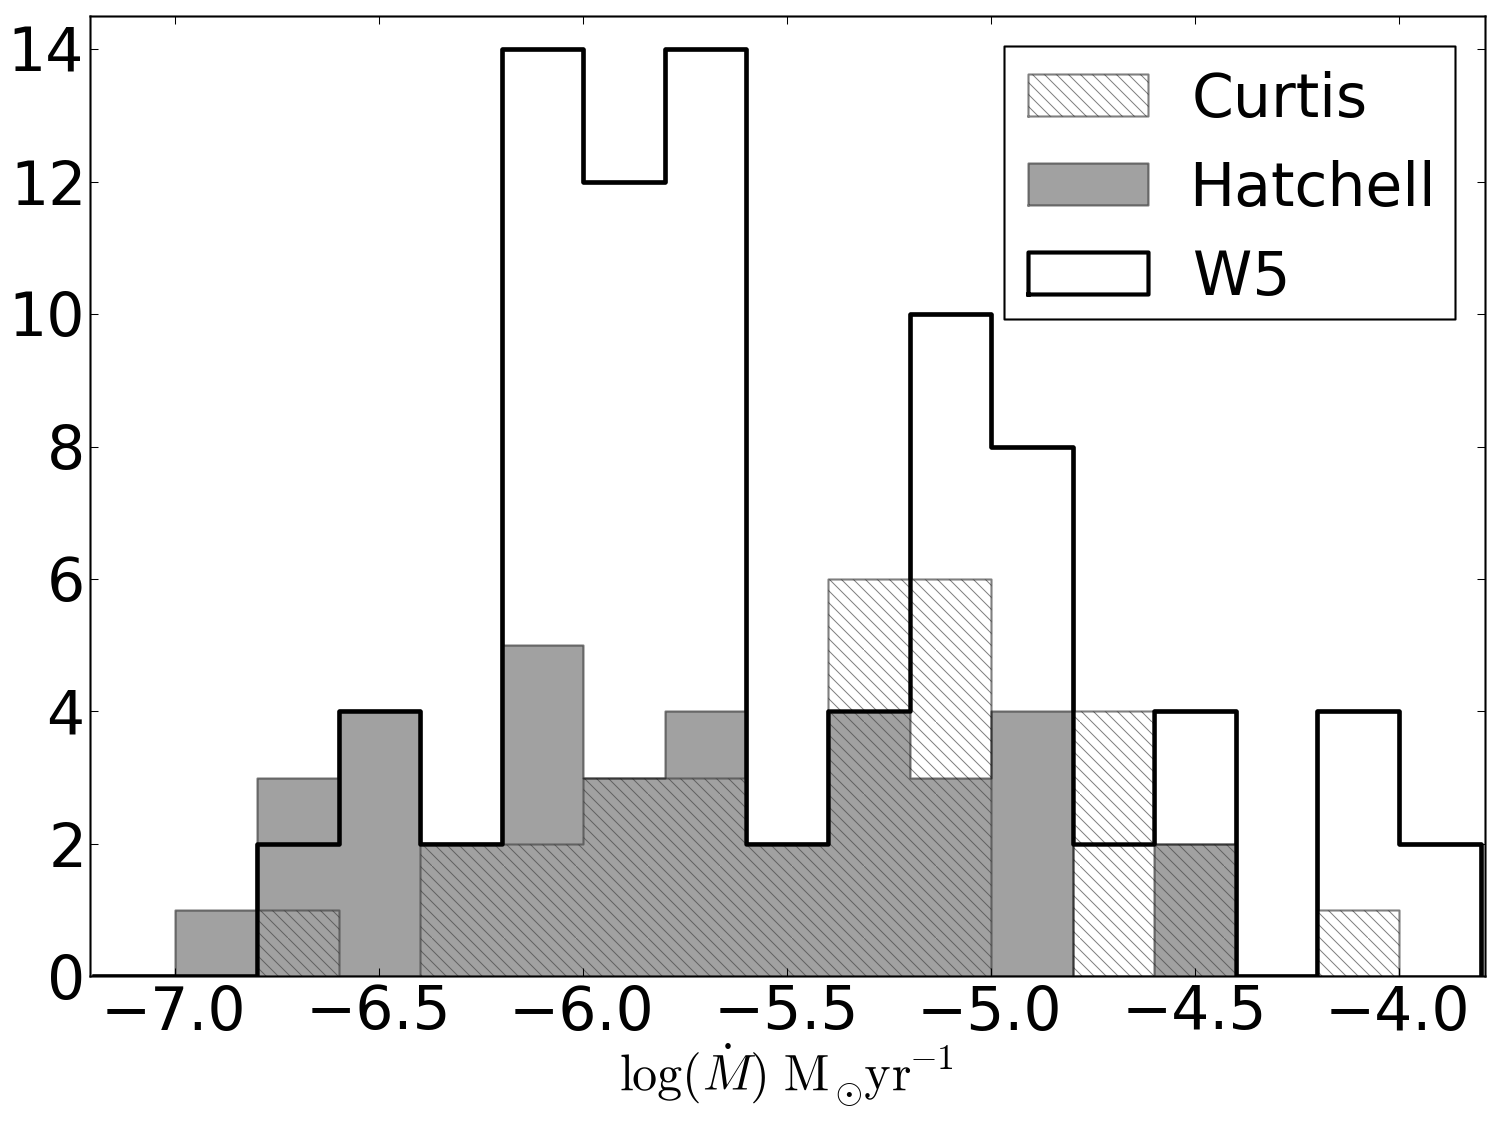
The momentum flux and mass loss rate are compared to the values derived in Perseus by Hatchell et al. (2007) and Curtis et al. (2010) in Figures 11 and 12. Both of our values are computed using the dynamical timescale measured from outflow lobe separation, while the Hatchell et al. (2007) values are derived using a more direct momentum-flux measurement in which the momentum flux contribution of each pixel in the resolved outflow map is considered. The derived momentum fluxes (Figure 11) are approximately consistent with the Curtis et al. (2010) Perseus momentum fluxes; Curtis et al. (2010) measure momentum fluxes in a range km s-1, higher than our measured km s-1 by approximately the opacity correction they applied. As seen in Figure 11, the Hatchell et al. (2007) momentum flux measurements in Perseus cover a much lower range km s-1 and are not consistent with our measurements. This disagreement is most likely because of the difference in method. The W5 outflows exhibit substantially higher mass-loss rates and momentum fluxes if we assume a factor of 10 opacity correction, as expected from our bias toward higher-velocity, higher-mass flows.
3.2 Structure of the W5 molecular clouds: A thin sheet?
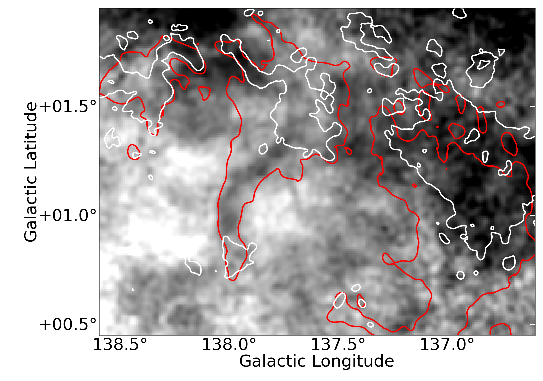
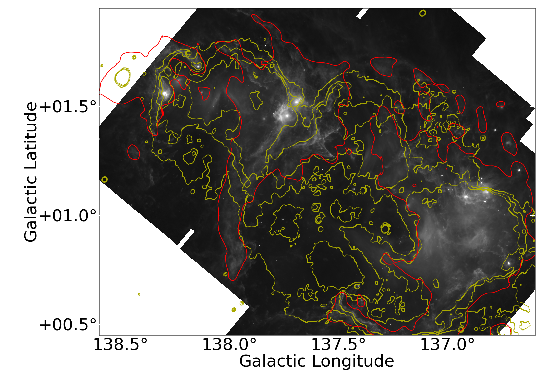
The W5 complex extends within 20∘ of parallel with the galactic plane. At the assumed distance of 2 kpc, it has a projected length of pc (Figure 2). In the 8 band (Figure 1), the region appears to consist of two blown-out bubbles with pc radii centered on and . While the bubbles are filled in with low-level far-infrared emission, there is no CO detected down to a limit of 3.0 K km s-1 ( 1-0), 2.4 K km s-1 ( 3-2, excepting a few isolated clumps), and 1.5 K km s-1 ( 1-0). Using the X-factor (the CO-to- conversion factor) for , we derive an upper limit , or . Individual ‘wisps’ and ‘clumps’ of CO can sometimes be seen, particularly towards the cloud edges, but in general the bubbles are absent of CO gas.
Given such low column limits, the W5 cloud must be much smaller along the line of sight than its pc size projected on the sky. Alternately, along the line-of-sight, the columns of molecular gas are too low for CO to self-shield, and it is therefore destroyed by the UV radiation of W5’s O-stars. In either case, there is a significant excess of molecular gas in the plane of the sky compared to the line of sight, which makes W5 an excellent location to perform unobscured observations of the star formation process. The implied thin geometry of the W5 molecular cloud may therefore be similar to the bubbles observed by Beaumont & Williams (2010), but on a larger scale.
There is also morphological evidence supporting the face-on hypothesis. In the AFGL 4029 region (Section 4.2) and all along the south of W5, there are ridges with many individual cometary ‘heads’ pointing towards the O-stars that are unconfused along the line of sight. This sort of separation would not be expected if we were looking through the clouds towards the O-stars. W5W, however, presents a counterexample in which there are two clouds along the line of sight that may well be masking a more complex geometry.
4 Sub-regions
Individual regions were selected from the mosaic for comparison. All regions with multiple outflows and indicators of star formation activity were named and included as regions for analysis. Additionally, three “inactive” regions were selected based on the presence of emission but the lack of outflows in the 3-2 data. Finally, two regions devoid of CO emission were selected as a baseline comparison and to place upper limits on the molecular gas content of the east and west ‘bubbles’. The regions are identified on the integrated image in Figure 3.
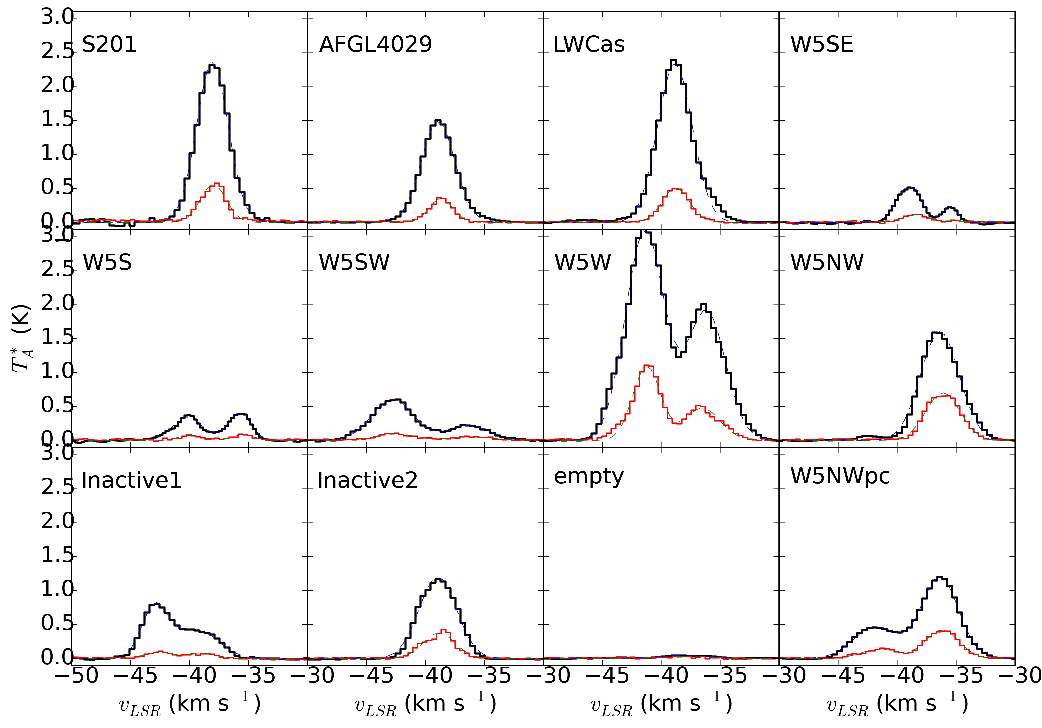
Average spectra were taken of each “region” within the indicated box. Gaussians were fit to the spectrum to determine line-widths and centers (Figure 13, Table 1). Gaussian fits were necessary because in many locations there are at least two velocity components, so the second moment (the “intensity-weighted dispersion”) is a poor estimator of line width. Widths ranged from to 6.2 km s-1 (Figure 9).
| Region | Velocity 1 | Width 1 | Amplitude 1 | Velocity 2 | Width 2 | Amplitude 2 | |||
| (km s-1) | (FWHM, km s-1) | (K) | (km s-1) | (FWHM, km s-1) | (K) | ||||
| S201 | -38.04 | 3.149 | 2.35 | - | - | - | |||
| AFGL4029 | -38.91 | 3.3605 | 1.48 | - | - | - | |||
| LWCas | -38.83 | 3.478 | 2.33 | - | - | - | |||
| W5W | -41.37 | 3.8775 | 3.07 | -36.16 | 3.8305 | 1.90 | |||
| W5NW | -36.37 | 3.854 | 1.6 | - | - | - | |||
| W5NWpc | -36.37 | 3.713 | 1.19 | -41.81 | 4.3475 | 0.47 | |||
| W5SW | -42.78 | 4.136 | 0.6 | -36.34 | 4.183 | 0.22 | |||
| W5S | -40.15 | 2.914 | 0.34 | -35.76 | 2.2795 | 0.40 | |||
| Inactive1 | -42.91 | 2.6555 | 0.75 | -39.38 | 4.2065 | 0.42 | |||
| Inactive2 | -38.94 | 3.7365 | 1.2 | - | - | - | |||
| empty | -37.81 | 5.217 | 0.04 | - | - | - | |||
| fits | |||||||||
| mass | momentum | energy | |||||||
| () | (km s-1) | (ergs) | |||||||
| S201 | -37.97 | 2.5615 | 0.56 | - | - | - | 1300 | 3500 | 8.9 |
| AFGL4029 | -38.66 | 2.35 | 0.35 | - | - | - | 2600 | 6100 | 1.4 |
| LWCas | -38.75 | 2.679 | 0.51 | - | - | - | 3700 | 10000 | 2.7 |
| W5W | -41.23 | 2.773 | 1.09 | -36.51 | 3.5485 | 0.47 | 4500 | 13000 | 3.5 |
| W5NW | -36.1 | 3.431 | 0.7 | - | - | - | 5300 | 18000 | 6.3 |
| W5NWpc | -36.18 | 3.3135 | 0.42 | -41.44 | 3.619 | 0.14 | 15000 | 50000 | 1.6 |
| W5SW | -42.6 | 3.807 | 0.1 | -36.15 | 4.2535 | 0.05 | 790 | 3000 | 1.1 |
| W5S | -39.9 | 2.444 | 0.07 | -35.48 | 2.209 | 0.08 | 320 | 790 | 1.9 |
| Inactive1 | -42.58 | 2.5145 | 0.1 | -38.97 | 2.82 | 0.07 | 1400 | 3500 | 8.7 |
| Inactive2 | -38.82 | 3.196 | 0.37 | - | - | - | 3100 | 9900 | 3.2 |
| empty | -38.44 | 4.7705 | 0.02 | - | - | - | 340 | 1600 | 7.8 |
4.1 Sh 2-201
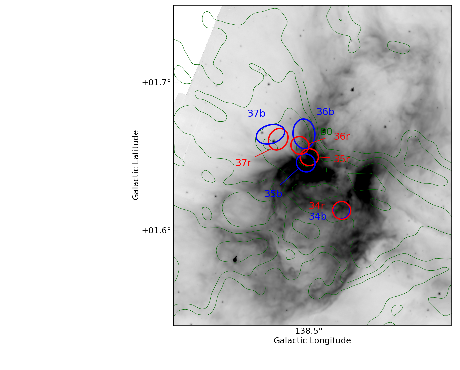
Sh 2-201 is an HII region and is part of the same molecular cloud as the bright-rimmed clouds in W5E, but it does not share a cometary shape with these clouds (Figure 14). Instead, it is internally heated and has its own ionizing source (Felli et al. 1987). The AFGL 4029 cloud edge is at a projected distance of pc from the nearest exposed O-star, and the closest illuminated point in the Spitzer 8 and 24 maps is at a projected distance of pc. The star forming process must therefore have begun before radiation driven shocks from the W5 O-stars could have impacted the cloud.
4.2 AFGL 4029
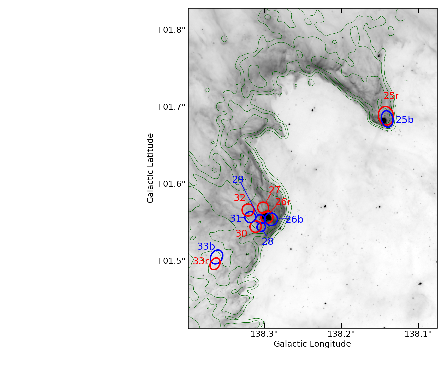
AFGL 4029 is a young cluster embedded in a cometary cloud (Figure 15). There is one clear bipolar outflow and 6 single-lobed flows that cannot be unambiguously associated with an opposite direction counterpart. The cluster is mostly unresolved in the data presented here and is clearly the most active CO clump in W5. It contains a cluster of at least 30 B-stars (Deharveng et al. 1997). The outflows from this region have a full width km s-1, which is entirely inconsistent with a radiation-driven inflow or outflow since it is greater than the sound speed in the ionized medium.
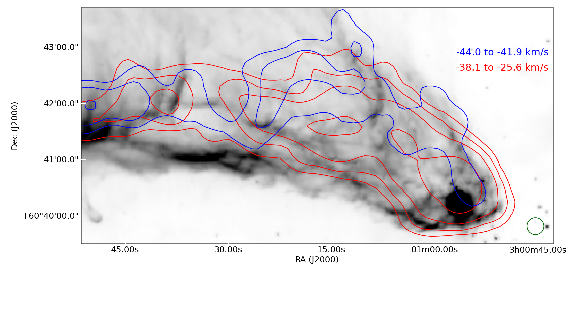
The northeast cometary cloud is strongly affected by the W5 HII region. It has an outflow in the head of the cloud (Figure 16), and the cloud shows a velocity gradient with distance from the HII region. The polarity of the gradient suggests that the cometary cloud must be on the far side of the ionizing O-star along the line of sight assuming that the HII region pressure is responsible for accelerating the cloud edge.
4.3 W5 Ridge
The W5 complex consists of two HII region bubbles separated by a ridge of molecular gas (Figure 17). This ridge contains the LW Cas optical nebula, a reflection nebula around the variable star LW Cas, on its east side and an X-shaped nebula on the west. The east portion of LW Cas Nebula is bright in both the continuum and CO J=3-2 but lacks outflows (see Figure 17). The east portion also has the highest average peak antenna temperature, suggesting that the gas temperature in this region is substantially higher than in the majority of the W5 complex (higher spatial densities could also increase the observed , but the presence of nearby heating sources make a higher temperature more plausible). It is possible that high gas temperatures are suppressing star formation in the cloud. Alternately, the radiation that is heating the gas may destroy any outflowing CO, which is more likely assuming the two Class I objects identified in this region by Koenig et al. (2008) are genuine protostars.
The ridge is surprisingly faint in HI 21 cm emission compared to the two HII regions (Figure 18) considering its 24 surface brightness. The integrated HI intensity from -45 to -35 km s-1 is K km s-1, whereas in the HII region bubble it is around 1000 K km s-1. The CO-bright regions show lower levels of emission similar to the ridge at 700-800 K km s-1. However, the ridge contains no CO gas and very few young stars (Figure 7 in Koenig et al. 2008). It is possible that the ridge contains cool HI but has very low column-densities along the direction pointing towards the O-stars, in which case the self-shielding is too little to prevent CO dissociation. This ridge may therefore be an excellent location to explore the transition from molecular to atomic gas under the influence of ionizing radiation in conditions different from high-density photodissociation (photon-dominated) regions.
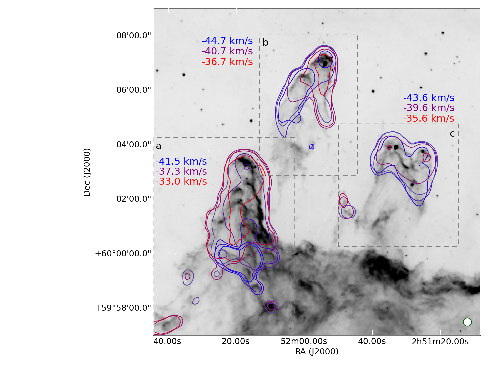
We examine Outflow 20 as a possible case for pressure-driven implosion (radiation, RDI, or gas pressure, PDI) by examining the relative timescales of the outflow driving source and the HII-region-driven compression front. A typical molecular outflow source (Class 0 or I) has a lifetime of years (Evans et al. 2009). Given that there is an active outflow at the head of this cloud, we use 0.5 MYr as an upper limit. The approximate distance from this source to the cloud front behind it is pc. If we assume the cloud front has been pushed at a constant speed , we derive a lower limit on its age of 0.3 MYr. While these limits allow for the protostar to be older than the compression front by up to 0.2 MYr, it is likely that the compression front moved more slowly (e.g., 3 km s-1 if it was pushed by a D-type shock front) and that the protostar is not yet at the end of its lifetime - it is very plausible that this soure was born in a radiation-driven implosion.
4.4 Southern Pillars
There are 3 cometary clouds that resemble the “elephant trunk” nebula in IC 1396 (Figure 19). Each of these pillars contains evidence of at least one outflow in the head of the cloud (see the supplementary materials, outflows 16-19 and 38) These pillars are low-mass and isolated; there is no other outflow activity in southern W5. However, because of the bright illumination on their northern edges and robust star formation tracers, these objects present a reasonable case for triggered star formation by the RDI mechanism.
The kinematics of these cometary clouds suggest that they have been pushed in different directions by the HII region (Figure 19). The central cometary cloud (Figure 19b) has two tails. The southwest tail emission peaks around -39.5 km s-1 and the southeast tail peaks at -41.5 km s-1, while the head is peaked at an intermediate -40.5 km s-1. These velocity shifts suggest that the gas is being accelerated perpendicular to the head-tail axis and that the southeast tail is on the back side of the cometary head, while the southwest tail is on the front side. The expanding HII region is crushing this head-tail system.
The southeast cometary cloud (Figure 19a) peaks at -35.0 km s-1. There are no clearly-separated CO tails as in the central cloud, but there is a velocity shift across the tail, in which the west (right) side is blueshifted compared to the east (left) side, which is the opposite sense from the central cometary cloud.
The southwest cometary cloud (Figure 19c) peaks at -40.3 km s-1 and has weakly defined tails similar to the central cloud. Both of its tails are at approximately the same velocity (-42.5 km s-1).
The kinematics of these tails provide some hints of their 3D structure and location in the cloud. Future study to compare the many cometary flows in W5 to physical models and simulations is warranted. Since these flows are likely at different locations along the line of sight (as required for their different velocities), analysis of their ionized edges may allow for more precise determination of the full 3D structure of the clouds relative to their ionizing sources.
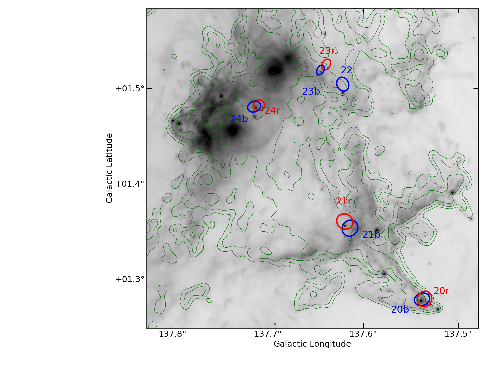
4.5 W5 Southeast
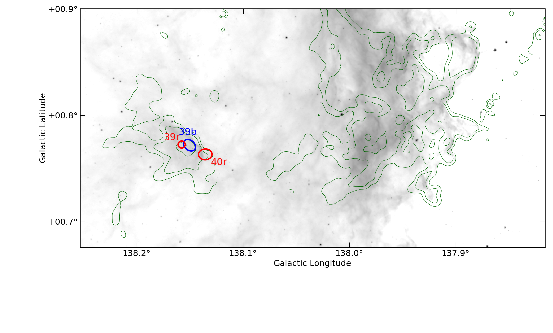
The region identified as W5SE has very little star formation activity despite having significant molecular gas (M). While there are two outflows and two Class I objects (Koenig et al. 2008) in the southeast of the two clumps (, Figure 20), the main clump () has no detected outflows. The CO emission is particularly clumpy in this region, with many independent, unresolved clumps both in position and velocity. In the 8 and 24 micron Spitzer images, it is clear that these clouds are illuminated from the northwest. This region represents a case in which the expanding HII region has impacted molecular gas but has not triggered additional star formation. The high clump-to-clump velocity dispersion observed in this region may be analogous to the W5S cometary clouds (Section 4.4) but without condensed clumps around which to form cometary clouds.
4.6 W5 Southwest
There is an isolated clump associated with outflows in the southwest part of W5 (Figure 21) at . While this clump is likely to be associated with the W5 region, it shows little evidence of interaction with the HII region. If it is eventually impacted by the expanding ionization front (i.e. if it is within the W5 complex), this clump will be an example of “revealed”, not triggered, star formation.
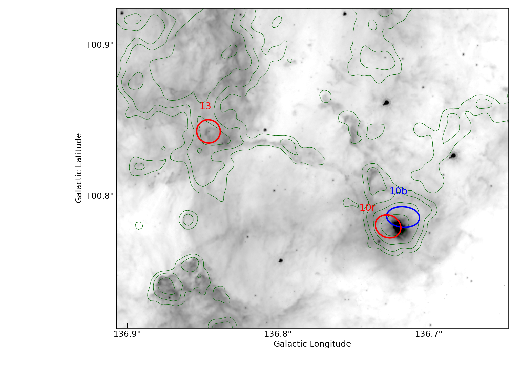
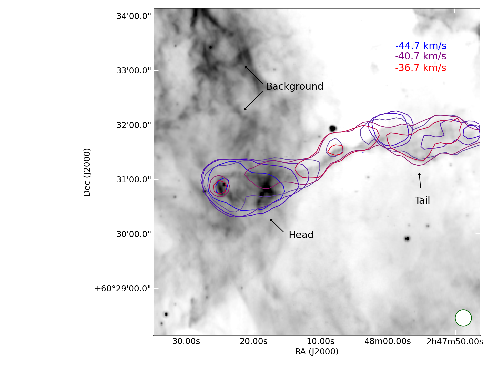
The other source in W5SW is a cometary cloud with a blueshifted head and redshifted tail (Figure 22; Outflow 13). The head contains a redshifted outflow; no blueshifted counterpart was detected (the velocity gradient displayed in Figure 22 is smaller than the outflow velocity and is also redshifted away from the head). The lack of a blueshifted counterpart may be because the flow is blowing into ionized gas where the CO is dissociated.
Because of its evident interaction with the HII region, this source is an interesting candidate for a non-protostellar outflow impersonator. However, because the head is blueshifted relative to the tail, we can infer that the head has been accelerated towards us by pressure from the HII region, implying that it is in the foreground of the cloud. Given this geometry, a radiation-driven flow would appear blueshifted, not redshifted, as the detected flow is. Additionally, the outflow is seen as fast as 7.5 km s-1 redshifted from the cloud, which is a factor of 2 too fast to be driven by radiation in a standard D-type shock. Finally, the outflow velocity is much greater than seen in a simulation of a cometary cloud by Gritschneder et al. (2010), while the head-to-tail velocity gradient is comparable.
4.7 W5 West / IC 1848
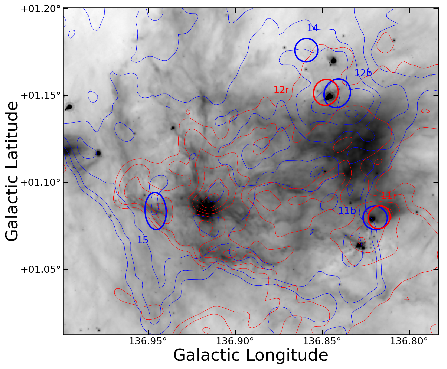
There is a bright infrared source seen in the center of W5W (IRAS 02459+6029; Figure 23), but the nearest CO outflow lobe is pc away. The nondetection may be due to confusion in this area: there are two layers of CO gas separated by 5 km s-1, so low-velocity outflow detection is more difficult. Unlike the rest of the W5 complex, this region appears to have multiple independent confusing components along the line of sight (Figure 13), and therefore the CO data provide much less useful physical information (multiple components are also observed in the data, ruling out self-absorption as the cause of the multiple components).
4.8 W5 NW
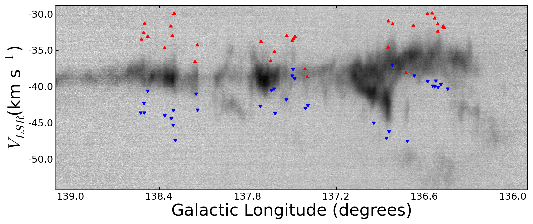
The northwest cluster containing outflows 1-8 is at a slightly different velocity () than the majority of the W5 cloud complex (; Figure 24), but it shares contiguous emission with the neighboring W5W region. It contains many outflows and therefore is actively forming stars (Figure 25). However, this cluster exhibits much lower CO brightness temperatures and weaker Spitzer 8 emission than the “bright-rimmed clouds” seen near the W5 O-stars. We therefore conclude that the region has not been directly impacted by any photoionizing radiation from the W5 O-stars.
The lack of interaction with the W5 O-stars implies that the star formation in this region, though quite vigorous, has not been directly triggered. Therefore not all of the current generation of star formation in W5 has been triggered on small or intermediate scales (e.g., radiation-driven implosion). Even the “collect and collapse” scenario seems unlikely here, as the region with the most outflows also displays some of the smoothest morphology (Figures 2 and 25); in “collect and collapse” the expansion of an HII region leads to clumping and fragmentation, and the spaces between the clumps should be relatively cleared out.
5 Discussion
5.1 Comparison to other outflows
The outflow properties we derive are similar to those in the B0-star forming clump IRAS 05358+3543 ( Ginsburg et al. 2009), in which CO 3-2 and 2-1 were used to derive outflow masses in the range 0.01-0.09 . However, some significantly larger outflows, up to 1.6 pc in one direction were detected, while the largest resolved outflow in our survey was only 0.8 pc (one direction).
As noted in Section 3.1.1, the total molecular mass in W5 is larger than Perseus, while (Bally et al. 2008). The length distribution of outflows (Figure 8) is strikingly similar, while other physical properties have substantially different mean values with or without correction factors included.
The W5NW region is more directly comparable to Perseus, with a total mass of (Table 1) and a similar size. In Figure 3, we show both the W5NW region, which contains all of the identified outflows, and the W5NWpc region, which is a larger area intended to be directly comparable in both mass and spatial scale to the Perseus molecular cloud. The W5NWpc region contains more than an order of magnitude more turbulent energy than the Perseus complex ( ergs, Arce et al. 2010) despite its similar mass. Even the smaller W5NW region has more turbulent energy than the Perseus complex, largely because of the greater average line width ( km s-1). As with the whole of W5, there is far too much turbulent energy in W5NW to be provided by outflows alone, implying the presence of another driver of turbulence.
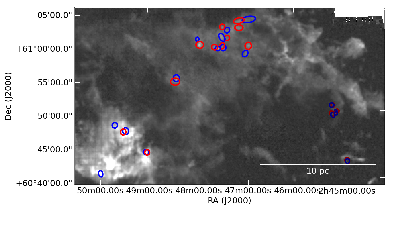
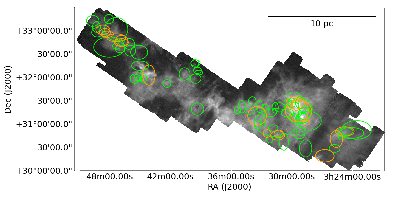
Figure 26 shows the W5NWpc region and Perseus molecular cloud on the same scale, though in two different emission lines. The Perseus cloud contains many more outflows and candidates (70 in Perseus vs. 13 in W5NWpc) despite a much larger physical area surveyed in W5. While it is likely that many of the W5W outflows will break apart into multiple flows at higher resolution, it does not seem likely that each would break apart into 5 flows, as would be required to bring the numbers into agreement. Since the highest density of outflows in Perseus is in the NGC 1333 cloud, it may be that there is no equivalently evolved region in W5NWpc. The W5W region may be comparably massive, but it is also confused and strongly interacting with the W5 HII region - either star formation is suppressed in this region, or outflows are rendered undetectable. In the latter case, the most likely mechanisms for hiding outflows are molecular dissociation by ionizing radiation and velocity confusion.
Another possibility highlighted in Figure 26 is that the W5NW region is interacting with the W4 bubble. The cloud in the top right of Figure 26 is somewhat cometary, has higher peak brightness temperature, and is at a slightly different velocity (-45 km s-1) than W5NW. The velocity difference of km s-1could simply be two clouds physically unassociated along the line of sight, or could indicate the presence of another expanding bubble pushing two sheets of gas away from each other. Either way, the northwest portion of the W5NW region is clumpier than the area in which the outflows were detected, and it includes no outflow detections.
5.2 Star Formation Activity
CO outflows are an excellent tracer of ongoing embedded star formation (e.g. Shu et al. 1987). We use the locations of newly discovered outflows to qualitatively describe the star formation activity within the W5 complex and evaluate the hypothesis that star formation has been triggered on small or intermediate scales.
Class 0/I objects are nearly always associated with outflows in nearby star-forming regions (e.g. Perseus Curtis et al. 2010; Hatchell et al. 2007). However, Koenig et al. (2008) detected 171 Class I sources in W5 using Spitzer photometry. Since our detection threshold for outflow appears to be similar to that in Perseus (Section 3.1.1), the lower number of outflow detections is surprising, especially considering that some of the detected outflows are outside the Spitzer-MIPS field (MIPS detections are required for Class I objects, and flows 1-4 are outside that range) or are in the outer arm (flows 39-54). Additionally, we should detect outflows from Class 0 objects that would not be identified by Spitzer colors.
There are a number of explanations for our detection deficiency. The Class I objects detected within the HII region “bubble” most likely have outflows in which the CO is dissociated similar to jet systems in Orion (e.g. HH46/47, a pc-scale flow in which CO is only visible very near the protostar; Chernin & Masson 1991; Stanke et al. 1999). This hypothesis can be tested by searching for optical and infrared jets associated with these objects, which presumably have lower mass envelopes and therefore less extinction than typical Class I objects. Additionally, there are many outflow systems that are are likely to be associated with clusters of outflows rather than individual outflows as demonstrated in Section 3.1.1, where we were able to identify fewer outflows when ‘observing’ the Perseus objects at a greater distance. There are 24 sources in the Koenig et al. (2008) Class I catalog within 15″ (one JCMT beam at 345 GHz) of another, and in many cases there are multiple Koenig et al. (2008) Class I sources within the contours of a single outflow system.
5.3 Evaluating Triggering
In the previous section, we discussed in detail the relationship between each sub-region and the HII region. Some regions are observed to be star-forming but not interacting with the HII region (W5NW, Sh 2-201), while others are interacting with the HII region but show no evidence or reduced evidence of star formation (W5SE, W5W, LW Cas). At the very least, there is significant complexity in the triggering mechanisms, and no one mechanism or size scale is dominant. If we were to trust outflows as unbiased tracers of star formation, we might conclude that the majority of star formation in W5 is untriggered (spontaneous), but such a conclusion is unreliable because both radiatively triggered star formation and “revealed” star formation may not exhibit molecular outflows (although ionized atomic outflows should still be visible around young stars formed through these scenarios).
In Section 4.3, we analyzed a particular case in which the RDI mechanism could plausibly have crushed a cloud to create the observed protostar. It is not possible to determine whether interaction with the HII region was a necessary precondition for the star’s formation, but it at least accelerated the process. The other cometary clouds share this property, but in total there are only 5 cometary clouds with detected outflows at their tips, indicating that this mechanism is not the dominant driver of star formation in W5.
The ‘collect and collapse’ scenario might naively be expected to produce an excess of young stars at the interaction front between the HII region and the molecular cloud. However, because such interactions naturally tend to form instabilities, this scenario produces cloud morphologies indistinguishable from those of RDI. There is not an obvious excess of sources associated with cloud edges over those deep within the clouds (e.g., Figure 2). We therefore cannot provide any direct evidence for this triggering scenario.
The overall picture of W5 is of two concurrent episodes of massive-star formation that have lead to adjacent blown-out bubbles. Despite the added external pressure along the central ridge, it is relatively deficient in both star formation activity and dense gas, perhaps because of heating by the strong ionizing radiation field. The lack of star formation along that central ridge implies that much of the gas was squeezed and heated, but it was not crushed into gravitationally unstable fragments. While some star formation may have been triggered in W5, there is strong evidence for pre-existing star formation being at least a comparable, if not the dominant, mechanism of star formation in the complex.
6 Outflow systems beyond W5
Fifteen outflows were detected at velocities inconsistent with the local W5 cloud velocities. Of these, 8 are consistent with Perseus arm velocities ( km s-1) and could be associated with different clouds within the same spiral arm. The other 7 have central velocities km s-1 and are associated with the outer arm identified in previous surveys (e.g. Digel et al. 1996). The properties of these outflows are given in Tables 4 and 5; the distances listed are kinematic distances assuming kpc and km s-1 (Reid et al. 2009).
Of these outflows, all but one are within 2′ of an IRAS point source. Outflow 54 is the most distant in our survey at a kinematic distance kpc ( km s-1) and galactocentric distance kpc. It has no known associations in the literature.
Outflows 41 - 44 are associated with a cloud at km s-1 known in the literature as LDN 1375 and associated with IRAS 02413+6037. Outflows 53 and 55 are at a similar velocity and associated with IRAS 02598+6008 and IRAS 02425+6000 respectively. All of these sources lie roughly on the periphery of the W5 complex.
Outflows 45 - 52 are associated with a string of IRAS sources and HII regions to the north of W5 and have velocities in the range . They therefore could be in the Perseus arm but are clearly unassociated with the W5 complex. Outflows 45 and 46 are associated with IRAS 02435+6144 and they may also be associated with the Sharpless HII region Sh 2-194. Outflows 47 and 48 are associated with IRAS 02461+6147, also known as AFGL 5085. Outflows 49 and 50 are nearby but not necessarily associated with IRAS 02475+6156, and may be associated with Sh 2-196. Outflows 51 and 52 are associated with IRAS 02541+6208.
7 Conclusions
We have identified 40 molecular outflow candidates in the W5 star forming region and an additional 15 outflows spatially coincident but located in the outer arm of the Galaxy.
-
•
The majority of the CO clouds in the W5 complex are forming stars. Star formation is not limited to cloud edges around the HII region. Because star formation activity is observed outside of the region of influence of the W5 O-stars, it is apparent that direct triggering by massive star feedback is not responsible for all of the star formation in W5.
-
•
The W5 complex is seen nearly face-on as evidenced by a strict upper limit on the CO column through the center of the HII-region bubbles. It is therefore an excellent region to study massive star feedback and revealed and triggered star formation.
-
•
Outflows contribute negligibly to the turbulent energy of molecular clouds in the W5 complex. This result is unsurprising near an HII region, but supports the idea that massive star forming regions are qualitatively different from low-mass star-forming regions in which the observed turbulence could be driven by outflow feedback. Even in regions far separated from the O-stars, there is more turbulence and less energy injection from outflows than in, e.g., Perseus.
-
•
Despite detecting a significant number of powerful outflows, the total outflowing mass detected in this survey ( without optical depth correction, perhaps when optical depth is considered) was somewhat smaller than in Perseus, a low to intermediate mass star forming region with the molecular mass of W5.
-
•
The low mass measured may be partly because the CO 3-2 line is sub-thermally excited in outflows. Therefore, while CO 3-2 is an excellent tracer of outflows for detection, it does not serve as a ‘calorimeter’ in the same capacity as CO 1-0.
-
•
Even considering excitation and optical depth corrections, it is likely that the mass of outflows in W5 is less than would be expected from a simple extrapolation from Perseus based on cloud mass. CO is likely to be photodissociated in the outflows when they reach the HII region, accounting for the deficiency around the HII region edges. However, in areas unaffected by the W5 O-stars such as W5NW, the deficiency may be because the greater turbulence in the W5 clouds suppresses star formation or hides outflows.
-
•
Velocity gradients across the tails of many cometary clouds have been observed, hinting at their geometry and confirming that the outflows seen from their heads must be generated by protostars within.
-
•
Outflows have been detected in the Outer Arm at galactocentric distances kpc. These represent some of the highest galactocentric distance star forming regions discovered to date.
8 Acknowledgements
We thank the two anonymous referees for their assistance in refining this document. We thank Devin Silvia for a careful proofread of the text. This work has made use of the APLpy plotting package (http://aplpy.sourceforge.net), the pyregion package (http://leejjoon.github.com/pyregion/), the agpy code package (http://code.google.com/p/agpy/) , IPAC’s Montage (http://montage.ipac.caltech.edu/), the DS9 visualization tool (http://hea-www.harvard.edu/RD/ds9/), the pyspeckit spectrosopic analysis toolkit (http://pyspeckit.bitbucket.org), and the STARLINK package (http://starlink.jach.hawaii.edu/). IRAS data was acquired through IRSA at IPAC (http://irsa.ipac.caltech.edu/). DRAO 21 cm data was acquired from the Canadian Astronomical Data Center (http://cadcwww.hia.nrc.ca/cgps/). The authors are supported by the National Science Foundation through NSF grant AST-0708403. This research has made use of the SIMBAD database, operated at CDS, Strasbourg, France
Facilities: JCMT, VLA
References
- Adams & Fatuzzo (1996) Adams, F. C. & Fatuzzo, M. 1996, ApJ, 464, 256
- Arce et al. (2010) Arce, H. G., Borkin, M. A., Goodman, A. A., Pineda, J. E., & Halle, M. W. 2010, The Astrophysical Journal, 715, 1170
- Bachiller (1996) Bachiller, R. 1996, ARA&A, 34, 111
- Bally et al. (2008) Bally, J., Walawender, J., Johnstone, D., Kirk, H., & Goodman, A. 2008, The Perseus Cloud, ed. Reipurth, B., 308–+
- Beaumont & Williams (2010) Beaumont, C. N. & Williams, J. P. 2010, ApJ, 709, 791
- Bertoldi & McKee (1990) Bertoldi, F. & McKee, C. F. 1990, ApJ, 354, 529
- Bourke et al. (1997) Bourke, T. L. et al. 1997, ApJ, 476, 781
- Bretherton et al. (2002) Bretherton, D. E., Moore, T. J. T., & Ridge, N. A. 2002, in Hot Star Workshop III: The Earliest Phases of Massive Star Birth, Vol. 267, 347
- Cabrit & Bertout (1990) Cabrit, S. & Bertout, C. 1990, ApJ, 348, 530
- Chernin & Masson (1991) Chernin, L. M. & Masson, C. R. 1991, ApJ, 382, L93
- Curtis et al. (2010) Curtis, E. I., Richer, J. S., Swift, J. J., & Williams, J. P. 2010, MNRAS, 1304
- Cyganowski et al. (2009) Cyganowski, C. J., Brogan, C. L., Hunter, T. R., & Churchwell, E. 2009, ApJ, 702, 1615
- Deharveng et al. (1997) Deharveng, L., Zavagno, A., Cruz-Gonzalez, I., Salas, L., Caplan, J., & Carrasco, L. 1997, A&A, 317, 459
- Digel et al. (1996) Digel, S. W., Lyder, D. A., Philbrick, A. J., Puche, D., & Thaddeus, P. 1996, ApJ, 458, 561
- Elmegreen (1998) Elmegreen, B. G. 1998, in Astronomical Society of the Pacific Conference Series, Vol. 148, Origins, ed. C. E. Woodward, J. M. Shull, & H. A. Thronson Jr., 150–+
- Elmegreen & Lada (1977) Elmegreen, B. G. & Lada, C. J. 1977, ApJ, 214, 725
- Enoch et al. (2006) Enoch, M. L. et al. 2006, ApJ, 638, 293
- Evans et al. (2009) Evans, N. J. et al. 2009, ApJS, 181, 321
- Felli et al. (1987) Felli, M., Hjellming, R. M., & Cesaroni, R. 1987, A&A, 182, 313
- Garden et al. (1991) Garden, R. P., Hayashi, M., Hasegawa, T., Gatley, I., & Kaifu, N. 1991, ApJ, 374, 540
- Ginsburg et al. (2009) Ginsburg, A. G., Bally, J., Yan, C., & Williams, J. P. 2009, ApJ, 707, 310
- Goldsmith (1972) Goldsmith, P. F. 1972, ApJ, 176, 597
- Gritschneder et al. (2010) Gritschneder, M., Burkert, A., Naab, T., & Walch, S. 2010, ApJ, 723, 971
- Hachisuka et al. (2006) Hachisuka, K. et al. 2006, ApJ, 645, 337
- Hatchell & Dunham (2009) Hatchell, J. & Dunham, M. M. 2009, 0904.1163
- Hatchell et al. (2007) Hatchell, J., Fuller, G. A., & Richer, J. S. 2007, Astronomy and Astrophysics, 472, 187
- Heyer et al. (1998) Heyer, M. H., Brunt, C., Snell, R. L., Howe, J. E., Schloerb, F. P., & Carpenter, J. M. 1998, ApJS, 115, 241
- Karr & Martin (2003) Karr, J. L. & Martin, P. G. 2003, Astrophysical Journal, 595, 900
- Klein et al. (1983) Klein, R. I., Sandford, II, M. T., & Whitaker, R. W. 1983, ApJ, 271, L69
- Koenig et al. (2008) Koenig, X. P., Allen, L. E., Gutermuth, R. A., Hora, J. L., Brunt, C. M., & Muzerolle, J. 2008, Astrophysical Journal, 688, 1142
- Lada & Fich (1996) Lada, C. J. & Fich, M. 1996, ApJ, 459, 638
- Lefloch et al. (1997) Lefloch, B., Lazareff, B., & Castets, A. 1997, Astronomy and Astrophysics, 324, 249
- Muenter (1975) Muenter, J. 1975, Journal of Molecular Spectroscopy, 55, 490, is always cited for debye.
- Oey et al. (2005) Oey, M. S., Watson, A. M., Kern, K., & Walth, G. L. 2005, Astronomical Journal, 129, 393
- Peters et al. (2010) Peters, T., Banerjee, R., Klessen, R. S., Low, M. M., Galván-Madrid, R., & Keto, E. R. 2010, The Astrophysical Journal, 711, 1017
- Reid et al. (2009) Reid, M. J. et al. 2009, ArXiv e-prints
- Reipurth & Bally (2001) Reipurth, B. & Bally, J. 2001, Annual Review of Astronomy and Astrophysics, 39, 403
- Shu et al. (1987) Shu, F. H., Adams, F. C., & Lizano, S. 1987, ARA&A, 25, 23
- Snell et al. (2002) Snell, R. L., Carpenter, J. M., & Heyer, M. H. 2002, ApJ, 578, 229
- Stanke et al. (1999) Stanke, T., McCaughrean, M. J., & Zinnecker, H. 1999, A&A, 350, L43
- Taylor et al. (2003) Taylor, A. R. et al. 2003, AJ, 125, 3145
- Thompson et al. (2004) Thompson, M. A., White, G. J., Morgan, L. K., Miao, J., Fridlund, C. V. M., & Huldtgren-White, M. 2004, Astronomy and Astrophysics, 414, 1017
- van der Tak et al. (2007) van der Tak, F. F. S., Black, J. H., Schöier, F. L., Jansen, D. J., & van Dishoeck, E. F. 2007, A&A, 468, 627
- Wilson et al. (2009) Wilson, T. L., Rohlfs, K., & Hüttemeister, S. 2009, Tools of radio astronomy (Springer)
| Outflow | Latitude | Longitude | Ellipse | Ellipse | Ellipse | Velocity | Velocity | Bipolar? aaGalactocentric Radius | ||
|---|---|---|---|---|---|---|---|---|---|---|
| Number | Major | Minor | PA | center | min | max | ||||
| ″ | ″ | ∘ | (km s-1) | (km s-1) | (km s-1) | (K km s-1) | ||||
| 1b | 136.4437 | 1.2622 | 60 | 27 | 342 | -36.1 | -47.6 | -40.3 | 1.0 | yc |
| 1r | 136.4674 | 1.2705 | 49 | 24 | 346 | -36.1 | -31.9 | -23.4 | 1.5 | yc |
| 2b | 136.4899 | 1.1904 | 30 | 23 | 299 | -35.7 | -48.0 | -39.7 | 0.7 | yc |
| 2r | 136.4743 | 1.2042 | 31 | 28 | 332 | -35.7 | -31.7 | -23.0 | 1.3 | yc |
| 3 | 136.475 | 1.2548 | 35 | 25 | 332 | -31.8 | -31.8 | -26.8 | 1.3 | n |
| 4b | 136.5038 | 1.2623 | 26 | 22 | 35 | -36.2 | -44.1 | -40.1 | 0.8 | yu |
| 4r | 136.5109 | 1.2751 | 25 | 22 | 332 | -36.2 | -32.4 | -28.6 | 0.9 | yu |
| 5r | 136.5126 | 1.2453 | 24 | 22 | 10 | -35.3 | -31.4 | -28.8 | 0.8 | yu |
| 5b | 136.5236 | 1.2524 | 39 | 22 | 3 | -35.3 | -45.0 | -39.2 | 1.4 | yu |
| 6b | 136.532 | 1.228 | 28 | 25 | 332 | -35.3 | -44.8 | -40.0 | 0.4 | yc |
| 6r | 136.5327 | 1.2333 | 28 | 20 | 318 | -35.3 | -30.6 | -24.0 | 1.0 | yc |
| 7b | 136.5453 | 1.2318 | 24 | 19 | 332 | -34.9 | -47.5 | -39.9 | 1.7 | yc |
| 7r | 136.5506 | 1.2383 | 27 | 23 | 314 | -34.9 | -29.9 | -22.7 | 1.3 | yc |
| 8b | 136.5799 | 1.2755 | 18 | 14 | 332 | -34.5 | -41.5 | -39.3 | 0.6 | yc |
| 8r | 136.581 | 1.2601 | 34 | 30 | 332 | -34.5 | -29.6 | -23.9 | 1.4 | yc |
| 9b | 136.67 | 1.2123 | 30 | 27 | 332 | -35.0 | -44.5 | -38.5 | 1.4 | yc |
| 9r | 136.6766 | 1.2059 | 40 | 31 | 332 | -35.0 | -31.6 | -26.7 | 0.3 | yc |
| 10b | 136.7172 | 0.7859 | 39 | 24 | 353 | -42.8 | -52.6 | -47.5 | 3.3 | yc |
| 10r | 136.7271 | 0.7797 | 31 | 26 | 332 | -42.8 | -38.1 | -33.1 | 4.1 | yc |
| 11b | 136.8195 | 1.082 | 25 | 24 | 331 | -34.2 | -40.7 | -37.0 | 3.1 | yc |
| 11r | 136.8173 | 1.0799 | 24 | 22 | 331 | -34.2 | -31.4 | -20.4 | 1.5 | yc |
| 12b | 136.8414 | 1.1512 | 30 | 26 | 332 | -40.4 | -53.3 | -46.2 | 1.5 | yc |
| 12r | 136.8479 | 1.1517 | 27 | 25 | 332 | -40.4 | -34.6 | -30.1 | 0.9 | yc |
| 13 | 136.8461 | 0.8426 | 28 | 27 | 332 | -31.0 | -31.0 | -23.5 | 1.0 | n |
| 14 | 136.8591 | 1.176 | 24 | 23 | 332 | -47.1 | -54.5 | -47.1 | 0.8 | n |
| 15 | 136.9443 | 1.0841 | 28 | 18 | 348 | -45.0 | -55.0 | -45.0 | 3.1 | n |
| 16b | 137.3929 | 0.5977 | 23 | 18 | 333 | -40.7 | -47.0 | -42.6 | 0.7 | yu |
| 16r | 137.3981 | 0.6121 | 22 | 19 | 357 | -40.7 | -38.7 | -35.2 | 1.9 | yu |
| 17b | 137.4084 | 0.6762 | 20 | 18 | 293 | -40.3 | -57.9 | -43.0 | 2.3 | yc |
| 17r | 137.412 | 0.6775 | 20 | 18 | 308 | -40.3 | -37.6 | -30.4 | 1.1 | yc |
| 18b | 137.4925 | 0.6289 | 16 | 15 | 333 | -35.5 | -39.2 | -37.6 | 1.1 | yc |
| 18r | 137.4908 | 0.6292 | 18 | 17 | 307 | -35.5 | -33.4 | -31.0 | 2.0 | yc |
| 19b | 137.4815 | 0.6409 | 20 | 17 | 1 | -36.0 | -41.9 | -38.9 | 1.3 | yc |
| 19r | 137.4798 | 0.6404 | 20 | 16 | 301 | -36.0 | -33.1 | -25.9 | 0.7 | yc |
| 20r | 137.5368 | 1.2792 | 24 | 21 | 332 | -37.4 | -33.0 | -22.5 | 5.2 | yc |
| 20b | 137.539 | 1.279 | 27 | 23 | 17 | -37.4 | -52.0 | -41.8 | 3.4 | yc |
| 21b | 137.6152 | 1.3543 | 31 | 28 | 322 | -39.5 | -52.0 | -43.7 | 4.5 | yc |
| 21r | 137.6169 | 1.3585 | 31 | 18 | 4 | -39.5 | -35.2 | -30.0 | 1.2 | yc |
| 22 | 137.6213 | 1.506 | 27 | 21 | 293 | -40.3 | -46.0 | -40.3 | 2.1 | n |
| 23b | 137.6389 | 1.5251 | 21 | 14 | 331 | -38.5 | -42.5 | -40.5 | 1.6 | yc |
| 23r | 137.6449 | 1.5194 | 19 | 12 | 331 | -38.5 | -36.5 | -32.0 | 1.9 | yc |
| 24r | 137.7094 | 1.4824 | 20 | 20 | 331 | -38.2 | -33.8 | -25.4 | 4.2 | yc |
| 24b | 137.7146 | 1.4809 | 25 | 19 | 292 | -38.2 | -50.0 | -42.7 | 4.4 | yc |
| 25b | 138.1398 | 1.6858 | 39 | 26 | 282 | -38.8 | -49.5 | -43.2 | 0.6 | yc |
| 25r | 138.142 | 1.6884 | 43 | 35 | 11 | -38.8 | -34.3 | -27.5 | 1.7 | yc |
| 26b | 138.2913 | 1.5538 | 29 | 29 | 355 | -38.7 | -52.0 | -47.4 | 1.2 | yc |
| 26r | 138.2966 | 1.5564 | 28 | 28 | 330 | -38.7 | -30.0 | -20.0 | 4.2 | yc |
| 27 | 138.3017 | 1.5689 | 26 | 25 | 330 | -30.0 | -30.0 | -22.0 | 1.8 | n |
| 28 | 138.3042 | 1.5437 | 20 | 19 | 330 | -43.3 | -46.1 | -43.3 | 1.4 | n |
| 29 | 138.3053 | 1.5537 | 22 | 20 | 330 | -45.3 | -51.6 | -45.3 | 2.5 | n |
| 30 | 138.3115 | 1.5443 | 26 | 26 | 330 | -33.0 | -33.0 | -29.2 | 1.2 | n |
| 31 | 138.3184 | 1.5566 | 26 | 25 | 330 | -44.4 | -49.1 | -44.4 | 1.1 | n |
| 32 | 138.3213 | 1.5658 | 27 | 27 | 330 | -31.7 | -31.7 | -27.0 | 1.4 | n |
| 33b | 138.3618 | 1.5073 | 28 | 26 | 330 | -39.4 | -49.5 | -44.0 | 1.3 | yc |
| 33r | 138.3642 | 1.4959 | 29 | 21 | 330 | -39.4 | -34.7 | -25.8 | 2.0 | yc |
| 34r | 138.4779 | 1.6137 | 22 | 21 | 330 | -36.9 | -33.1 | -29.1 | 0.5 | yc |
| 34b | 138.4768 | 1.6142 | 21 | 20 | 330 | -36.9 | -43.6 | -40.6 | 0.8 | yc |
| 35r | 138.4998 | 1.6496 | 22 | 20 | 4 | -37.5 | -31.3 | -24.1 | 1.4 | yc |
| 35b | 138.5021 | 1.6458 | 23 | 21 | 330 | -37.5 | -49.5 | -43.6 | 1.3 | yc |
| 36b | 138.5034 | 1.6654 | 35 | 26 | 5 | -37.5 | -50.4 | -42.3 | 1.2 | yc |
| 36r | 138.5061 | 1.6576 | 22 | 21 | 330 | -37.5 | -32.6 | -26.7 | 1.4 | yc |
| 37r | 138.5208 | 1.6618 | 27 | 22 | 330 | -38.5 | -33.5 | -31.4 | 0.6 | yc |
| 37b | 138.5241 | 1.6667 | 23 | 23 | 18 | -38.5 | -47.0 | -43.6 | 0.6 | yc |
| 38b | 137.4983 | 0.6062 | 16 | 15 | 333 | -36.1 | -39.2 | -38.5 | 0.8 | yc |
| 38r | 137.4977 | 0.6055 | 15 | 14 | 307 | -36.1 | -33.7 | -32.5 | 0.5 | yc |
| 39b | 138.1506 | 0.7724 | 23 | 16 | 321 | -38.8 | -45.3 | -41.0 | 2.0 | yc |
| 39r | 138.1591 | 0.7713 | 17 | 13 | 304 | -38.8 | -36.6 | -34.7 | 0.7 | yc |
| 40 | 138.1356 | 0.7634 | 22 | 18 | 4 | -36.0 | -36.0 | -27.6 | 2.2 | n |
| Measured properties of the outflows. | ||||||||||
| a Is the outflow part of a bipolar pair? yc = yes, confident; yu = yes, uncertain; n = no | ||||||||||
| Outflow | Mass | Momentum | Energy | Dynamical | Momentum |
|---|---|---|---|---|---|
| Number | Age | Flux | |||
| () | (km s-1) | (1042 ergs) | (104 years) | ||
| km s-1yr-1 | |||||
| 1b | 0.034 | 0.26 | 21.1 | 7.0 | 7.2 |
| 1r | 0.04 | 0.24 | 17.3 | 7.0 | 7.2 |
| 2b | 0.011 | 0.07 | 4.9 | 5.4 | 4.4 |
| 2r | 0.025 | 0.17 | 13.0 | 5.4 | 4.4 |
| 3 | 0.025 | 0.12 | 5.8 | - | - |
| 4b | 0.01 | 0.06 | 4.0 | 7.2 | 1.5 |
| 4r | 0.011 | 0.04 | 1.8 | 7.2 | 1.5 |
| 5r | 0.01 | 0.04 | 2.0 | 4.5 | 4.0 |
| 5b | 0.025 | 0.14 | 8.0 | 4.5 | 4.0 |
| 6b | 0.007 | 0.04 | 3.0 | 1.7 | 8.1 |
| 6r | 0.013 | 0.09 | 6.8 | 1.7 | 8.1 |
| 7b | 0.017 | 0.13 | 10.5 | 2.4 | 10.9 |
| 7r | 0.018 | 0.13 | 9.7 | 2.4 | 10.9 |
| 8b | 0.003 | 0.02 | 0.9 | 4.9 | 4.5 |
| 8r | 0.032 | 0.2 | 13.2 | 4.9 | 4.5 |
| 9b | 0.025 | 0.13 | 7.2 | 3.9 | 4.2 |
| 9r | 0.009 | 0.04 | 1.8 | 3.9 | 4.2 |
| 10b | 0.068 | 0.41 | 25.7 | 3.9 | 22.0 |
| 10r | 0.074 | 0.45 | 28.0 | 3.9 | 22.0 |
| 11b | 0.042 | 0.17 | 7.2 | 0.7 | 35.3 |
| 11r | 0.017 | 0.09 | 5.9 | 0.7 | 35.3 |
| 12b | 0.026 | 0.14 | 8.7 | 1.8 | 15.2 |
| 12r | 0.014 | 0.13 | 12.7 | 1.8 | 15.2 |
| 13 | 0.016 | 0.1 | 5.8 | - | - |
| 14 | 0.01 | 0.06 | 4.1 | - | - |
| 15 | 0.036 | 0.24 | 17.3 | - | - |
| 16b | 0.006 | 0.03 | 1.2 | 11.1 | 0.7 |
| 16r | 0.018 | 0.05 | 1.3 | 11.1 | 0.7 |
| 17b | 0.019 | 0.12 | 9.4 | 1.4 | 10.6 |
| 17r | 0.009 | 0.03 | 0.7 | 1.4 | 10.6 |
| 18b | 0.006 | 0.02 | 0.5 | 1.4 | 4.0 |
| 18r | 0.013 | 0.04 | 1.0 | 1.4 | 4.0 |
| 19b | 0.011 | 0.05 | 2.4 | 0.7 | 9.6 |
| 19r | 0.005 | 0.01 | 0.2 | 0.7 | 9.6 |
| 20r | 0.059 | 0.5 | 46.3 | 0.5 | 156.0 |
| 20b | 0.047 | 0.33 | 26.6 | 0.5 | 156.0 |
| 21b | 0.086 | 0.58 | 41.4 | 1.7 | 39.1 |
| 21r | 0.014 | 0.08 | 4.3 | 1.7 | 39.1 |
| 22 | 0.027 | 0.1 | 4.3 | - | - |
| 23b | 0.011 | 0.03 | 0.9 | 4.5 | 1.3 |
| 23r | 0.01 | 0.03 | 1.0 | 4.5 | 1.3 |
| 24r | 0.037 | 0.3 | 26.1 | 1.7 | 34.1 |
| 24b | 0.047 | 0.28 | 18.3 | 1.7 | 34.1 |
| 25b | 0.014 | 0.09 | 6.8 | 1.0 | 42.8 |
| 25r | 0.056 | 0.35 | 23.0 | 1.0 | 42.8 |
| 26b | 0.023 | 0.24 | 26.1 | 1.1 | 98.3 |
| 26r | 0.072 | 0.85 | 106.0 | 1.1 | 98.3 |
| 27 | 0.026 | 0.09 | 4.5 | - | - |
| 28 | 0.012 | 0.07 | 4.6 | - | - |
| 29 | 0.024 | 0.06 | 2.1 | - | - |
| 30 | 0.018 | 0.12 | 8.0 | - | - |
| 31 | 0.016 | 0.03 | 0.7 | - | - |
| 32 | 0.023 | 0.18 | 14.5 | - | - |
| 33b | 0.022 | 0.14 | 10.1 | 3.0 | 11.4 |
| 33r | 0.026 | 0.2 | 16.1 | 3.0 | 11.4 |
| 34r | 0.005 | 0.03 | 1.7 | 0.7 | 8.4 |
| 34b | 0.007 | 0.03 | 1.2 | 0.7 | 8.4 |
| 35r | 0.013 | 0.12 | 11.6 | 1.3 | 18.7 |
| 35b | 0.014 | 0.12 | 11.0 | 1.3 | 18.7 |
| 36b | 0.025 | 0.19 | 15.8 | 2.7 | 10.7 |
| 36r | 0.014 | 0.1 | 6.8 | 2.7 | 10.7 |
| 37r | 0.008 | 0.04 | 1.6 | 2.1 | 4.3 |
| 37b | 0.007 | 0.06 | 4.2 | 2.1 | 4.3 |
| 38b | 0.005 | 0.01 | 0.4 | 0.9 | 2.3 |
| 38r | 0.002 | 0.01 | 0.1 | 0.9 | 2.3 |
| 39b | 0.017 | 0.07 | 2.8 | 7.5 | 1.0 |
| 39r | 0.004 | 0.01 | 0.3 | 7.5 | 1.0 |
| 40 | 0.019 | 0.08 | 3.5 | - | - |
| Derived properties of the outflows in the optically thin limit. | |||||
| Typical optical depth corrections for 3-2 are in the range 7-14 (Curtis et al. 2010). | |||||
| The correction for velocity confusion is but poorly constrained (Arce et al. 2010). | |||||
| Finally, an excitation correction in the range 1-20 is likely required as described in the Appendix. | |||||
| The mass and momentum values can be multiplied by these factors to acquire the corrected values. | |||||
| The energy is weighted more heavily towards high-velocity, low-optical-depth gas, so the correction factor is likely to be lower. | |||||
| Outflow | Latitude | Longitude | Ellipse | Ellipse | Ellipse | Kinematic | aaGalactocentric Radius | Velocity | Velocity | ||
|---|---|---|---|---|---|---|---|---|---|---|---|
| Number | Major | Minor | PA | Distance | center | min | max | ||||
| ″ | ″ | ∘ | (pc) | (pc) | (km s-1) | (K km s-1) | |||||
| 41r | 136.364 | 0.9606 | 25 | 18 | 2 | 5510 | 13000 | -61.8 | -59.2 | -56.5 | 0.5 |
| 41b | 136.3634 | 0.9568 | 23 | 17 | 353 | 5510 | 13000 | -61.8 | -71.6 | -64.3 | 3.0 |
| 42r | 136.3522 | 0.9786 | 20 | 14 | 2 | 5500 | 12900 | -62.1 | -59.8 | -57.6 | 0.6 |
| 42b | 136.3548 | 0.9798 | 20 | 19 | 332 | 5500 | 12900 | -62.1 | -67.8 | -64.4 | 0.5 |
| 43r | 136.3495 | 0.9612 | 17 | 15 | 63 | 5510 | 13000 | -61.8 | -59.0 | -56.1 | 0.8 |
| 43b | 136.353 | 0.9621 | 12 | 12 | 333 | 5510 | 13000 | -61.8 | -66.3 | -64.6 | 1.0 |
| 44r | 136.3554 | 0.9576 | 13 | 13 | 23 | 5500 | 12900 | -61.8 | -59.0 | -55.4 | 2.1 |
| 44b | 136.3545 | 0.9567 | 14 | 14 | 333 | 5500 | 12900 | -61.8 | -68.0 | -64.5 | 2.0 |
| 45r | 136.1219 | 2.0816 | 34 | 25 | 297 | 3750 | 11400 | -46.5 | -43.1 | -40.5 | 0.6 |
| 45b | 136.1233 | 2.0803 | 35 | 25 | 306 | 3750 | 11400 | -46.5 | -57.3 | -50.0 | 1.9 |
| 46 | 136.1166 | 2.0983 | 26 | 25 | 332 | 3790 | 11400 | -50.2 | -52.6 | -50.2 | 0.5 |
| 47b | 136.3857 | 2.2687 | 34 | 27 | 332 | 3220 | 11000 | -42.0 | -55.0 | -46.7 | 3.5 |
| 47r | 136.3861 | 2.267 | 35 | 23 | 304 | 3220 | 11000 | -42.0 | -37.3 | -25.1 | 5.0 |
| 48b | 136.374 | 2.2628 | 29 | 21 | 332 | 3250 | 11000 | -43.2 | -51.4 | -47.0 | 1.5 |
| 48r | 136.3736 | 2.2615 | 29 | 22 | 332 | 3250 | 11000 | -43.2 | -39.5 | -22.2 | 8.9 |
| 49r | 136.4663 | 2.4678 | 29 | 23 | 290 | 3610 | 11300 | -45.7 | -42.2 | -33.0 | 2.2 |
| 49b | 136.4661 | 2.4693 | 31 | 23 | 292 | 3610 | 11300 | -45.7 | -52.2 | -49.1 | 0.9 |
| 50b | 136.5087 | 2.5108 | 31 | 25 | 332 | 3380 | 11100 | -43.5 | -48.5 | -46.5 | 0.8 |
| 50r | 136.5118 | 2.5083 | 28 | 23 | 10 | 3380 | 11100 | -43.5 | -40.6 | -37.5 | 1.0 |
| 51b | 137.058 | 2.9858 | 28 | 23 | 293 | 4350 | 11900 | -51.8 | -55.5 | -53.0 | 0.8 |
| 51r | 137.0567 | 2.9864 | 34 | 25 | 8 | 4350 | 11900 | -51.8 | -50.6 | -40.9 | 3.5 |
| 52r | 137.0662 | 2.9999 | 37 | 26 | 43 | 4390 | 12000 | -52.2 | -49.1 | -41.0 | 7.8 |
| 52b | 137.0683 | 3.0013 | 38 | 29 | 15 | 4390 | 12000 | -52.2 | -65.8 | -55.2 | 4.1 |
| 53b | 138.6143 | 1.5611 | 26 | 26 | 330 | 5450 | 13000 | -59.7 | -71.1 | -61.7 | 5.5 |
| 53r | 138.6158 | 1.563 | 25 | 23 | 330 | 5450 | 13000 | -59.7 | -57.6 | -54.5 | 1.3 |
| 54r | 136.382 | 0.8392 | 29 | 20 | 343 | 7480 | 14700 | -75.6 | -73.2 | -68.9 | 2.6 |
| 54b | 136.3824 | 0.838 | 20 | 17 | 332 | 7480 | 14700 | -75.6 | -83.1 | -77.9 | 2.0 |
| 55b | 136.7623 | 0.4548 | 27 | 16 | 343 | 5230 | 12700 | -60.9 | -65.2 | -62.7 | 5.4 |
| 55r | 136.7579 | 0.4522 | 24 | 18 | 343 | 5230 | 12700 | -60.9 | -59.0 | -53.2 | 6.0 |
| Outflow | Mass | Momentum | Energy | Dynamical | Momentum |
|---|---|---|---|---|---|
| Number | Age | Flux | |||
| () | (km s-1) | (1042 ergs) | (104 years) | km s-1yr-1 | |
| 41r | 0.037 | 0.11 | 3.5 | 3.6 | 30.2 |
| 41b | 0.196 | 0.96 | 54.6 | 3.6 | 30.2 |
| 42r | 0.029 | 0.06 | 1.3 | 4.3 | 3.9 |
| 42b | 0.03 | 0.11 | 3.9 | 4.3 | 3.9 |
| 43r | 0.033 | 0.13 | 5.1 | 7.3 | 2.9 |
| 43b | 0.024 | 0.08 | 2.8 | 7.3 | 2.9 |
| 44r | 0.062 | 0.21 | 7.9 | 1.8 | 27.7 |
| 44b | 0.067 | 0.28 | 12.6 | 1.8 | 27.7 |
| 45r | 0.037 | 0.18 | 8.6 | 1.2 | 62.3 |
| 45b | 0.126 | 0.55 | 28.3 | 1.2 | 62.3 |
| 46 | 0.028 | 0.1 | 3.7 | - | - |
| 47b | 0.187 | 1.32 | 101.0 | 0.6 | 553.0 |
| 47r | 0.232 | 1.84 | 164.0 | 0.6 | 553.0 |
| 48b | 0.054 | 0.33 | 20.8 | 0.4 | 754.0 |
| 48r | 0.341 | 2.4 | 229.0 | 0.4 | 754.0 |
| 49r | 0.106 | 0.77 | 62.7 | 1.4 | 71.1 |
| 49b | 0.047 | 0.22 | 10.8 | 1.4 | 71.1 |
| 50b | 0.037 | 0.14 | 5.5 | 3.8 | 7.4 |
| 50r | 0.038 | 0.14 | 5.5 | 3.8 | 7.4 |
| 51b | 0.058 | 0.13 | 3.0 | 1.0 | 152.0 |
| 51r | 0.303 | 1.33 | 72.7 | 1.0 | 152.0 |
| 52r | 0.829 | 4.3 | 250.0 | 1.4 | 479.0 |
| 52b | 0.472 | 2.5 | 150.0 | 1.4 | 479.0 |
| 53b | 0.626 | 3.16 | 194.0 | 4.7 | 73.2 |
| 53r | 0.124 | 0.31 | 8.5 | 4.7 | 73.2 |
| 54r | 0.461 | 1.24 | 37.5 | 1.8 | 135.0 |
| 54b | 0.212 | 1.14 | 64.0 | 1.8 | 135.0 |
| 55b | 0.411 | 1.66 | 68.0 | 7.5 | 28.3 |
| 55r | 0.404 | 0.47 | 6.6 | 7.5 | 28.3 |
Appendix A Optically Thin, LTE dipole molecule
While many authors have solved the problem of converting CO 1-0 beam temperatures to column densities (Garden et al. 1991; Bourke et al. 1997; Cabrit & Bertout 1990; Lada & Fich 1996), there are no examples in the literature of a full derivation of the LTE, optically thin CO-to- conversion process for higher rotational states. We present the full derivation here, and quantify the systematic errors generated by various assumptions.
We begin with the assumption of an optically thin cloud such that the radiative transfer equation (Wilson et al. 2009, eqn 1.9) simplifies to
| (3) |
The absorption and stimulated emission terms yield
| (4) |
where is the line shape function (), is the density in the given state, is the frequency of the transition, is the Einstein B coefficient, and is Planck’s constant.
By assuming LTE (the Boltzmann distribution) and using Kirchoff’s Law and the definition of the Einstein A and B values, we can derive a more useful version of this equation
| (5) |
where is Boltzmann’s constant.
The observable can be related to the optical depth, which is given by
| (6) |
Rearranging and converting from density to column () gives an equation for the column density of the molecule in the upper energy state of the transition:
| (7) |
In order to relate the brightness temperature to the optical depth, at CO transition frequencies the full blackbody formula must be used and the CMB must also be taken into account. Wilson et al. (2009) equation 15.29
| (8) |
is rearranged to solve for :
| (9) |
We convert from frequency to velocity units with , and plug (9) into (7) to get
| (10) |
which is the full LTE upper-level column density with no approximations applied.
The first term of the Taylor expansion is appropriate for ()
| (11) |
which simplifies to
| (12) |
This can be converted to use (0.1222 for ; Muenter 1975), the electric dipole moment of the molecule, instead of , using Wilson et al. (2009) equation 15.20 ):
| (13) |
The total column can be derived from the column in the upper state using the partition function and the Boltzmann distribution
| (14) |
This equation is frequently approximated using an integral (e.g. Cabrit & Bertout 1990), but a more accurate numerical solution using up to thousands of rotational states is easily computed
| (15) |
The effects of using the approximation and the full numerical solution are shown in figure 27.
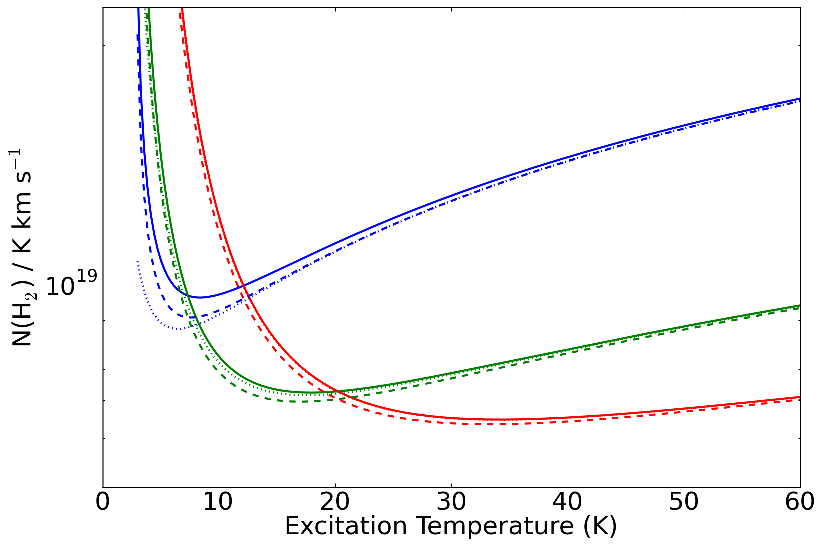
The CO 3-2 transition is also less likely to be in LTE than the 1-0 transition. The critical density () of 3-2 is 27 times higher than that for 1-0. We have run RADEX (van der Tak et al. 2007) LVG models of CO to examine the impact of sub-thermal excitation on column derivation. The results of the RADEX models are shown in Figure 28. They illustrate that, while it is quite safe to assume the CO 1-0 transition is in LTE in most circumstances, a similar assumption is probably invalid for the CO 3-2 transition in typical molecular cloud environments.
