11email: cantiello@oa-teramo.inaf.it 22institutetext: Dipartimento di Fisica – Universitá di Roma Tor Vergata, via della Ricerca Scientifica 1, 00133 Rome, Italy
VLT Optical observations of two bright Supernova Ia hosts in the Virgo cluster
Abstract
Aims. We study the characteristics of field stars in the two bright ellipticals NGC 4621 and NGC 4374 in the Virgo cluster to derive distances and stellar population properties. Moreover, since the target galaxies have hosted three type Ia Supernova events, we investigate the correlations between the SNe Ia properties and their host stellar systems.
Methods. Using deep imaging data, obtained with the FORS2 camera mounted at the VLT, we analyse the Surface Brightness Fluctuations (SBF) properties of the targets. We adopt our measurements and existing empirical or theoretical calibrations to estimate the distance of the NGC 4621 and NGC 4374. For stellar population analysis, we measured SBF amplitudes in different galaxy regions, allowing to study the changes in field star properties. The three band coverage of present data, coupled with existing SBF measures available from literature, provides us with the largest wavelength coverage of SBF magnitudes for single objects. We present a detailed comparison between SBF data and models to constrain the physical characteristics of the dominant stellar components at various galactic radii, and in the regions where SNe Ia events were recorded.
Results. Our and SBF measures provide distances in agreement with literature estimates. The median of our and literature SBF-based distances agrees with the one from non-SBF methods, indicating the absence of any systematic effect in the SBF technique. Comparing either the SBF versus integrated colour diagrams, or the SBF versus SBF colour diagrams, with models, we find that stellar populations properties do not change significantly along galactic radius, with a dominant population having old age and solar chemical composition. The galaxies appear similar in all properties analysed, except for -band SBF. Since the SBF magnitudes in this band are sensitive to the properties of the hot stellar component, we speculate that such behaviour is a consequence of different diffuse hot stellar components in the galaxies. Using specific models we find that the presence of a percentage of hot-HB stars in old and metal rich stellar populations could be at the origin of the observed differences. We find a good uniformity in the and SBF and integrated colours in the regions where the three SNe Ia, presenting different absolute luminosities, exploded. On the other hand, the -band SBF signal shows intriguing differences.
Key Words.:
Galaxies: distances and redshifts – Galaxies: elliptical and lenticular, cD – Galaxies: stellar content – Galaxies: photometry – Galaxies: individual: NGC 4621, NGC 43741 Introduction
Our understanding of galaxies in the distant Universe relies on how well we understand the properties of their local templates. Thus, the study of nearby unresolved stellar populations plays a key role to obtain a refined characterisation of stellar populations at larger redshifts. Although different astronomical methods exist to carry out such detailed analysis, none of them can provide by itself robust constraints. The presence of internal uncertainties in each method, or calibration uncertainties, as well as the effect of the age-metallicity degeneracy that affects most of the spectro-photometric indicators (Worthey, 1994), prevents us from relying on one single stellar population tracer for these studies, and pushes the community of astronomers towards the definition of new analysis methods.
| NGC 4621 | NGC 4374 | |
| Galaxy parameters | ||
| RA(J2000)1 | 12h42m02.3s | 12h25m03.7s |
| Dec(J2000)1 | +11d38m49s | +12d53m13s |
| Galaxy Type2 | E5 | E |
| Morphological Type2 | -4.8 | -4.3 |
| Absolute -band magnitude2 | -20.5 | -21.0 |
| SNe Ia events | SN1939B | SN1957B, SN1991bg |
| (km/s, Heliocentric) | 4106 | 1060 6 |
| 0.033 mag | 0.040 mag | |
| 1.172 0.018 | 1.1910.008 | |
| Observations | ||
| Filter | Exposure time (s) | Exposure time (s) |
| 3375 | 2250 | |
| 3375 | 2250 | |
| 2376 | 1584 | |
In the last two decades, the SBF method, introduced by Tonry & Schneider (1988) to obtain distances of early-type galaxies, has proved being not only an accurate and precise distance indicator, but also a powerful tracer of stellar population properties (e.g. Jensen et al., 2003; Raimondo et al., 2005; Cantiello et al., 2007b). By definition, the SBF magnitude corresponds to the ratio of the second to the first moment of the stellar luminosity function in the galaxy: , where , and is the number of stars per bin of flux (Tonry & Schneider, 1988). Such definition implies that: SBF magnitudes are linked to the properties of the stars in the galaxy; the SBF signal is dominated by the brightest stellar component in the galaxy, because of the dependence on the second moment of the luminosity function; since the brightest phase in a stellar population is wavelength-dependent, SBF magnitudes in different pass-bands are sensitive to the properties of stars in different, and well defined, evolutionary stages (Worthey, 1993a; Brocato et al., 1998; Cantiello et al., 2003).
Taking advantage of archival , , and observations taken with the FORS2 camera of the Very Large Telescope for two bright early-type galaxies in the Virgo cluster, NGC 4621 and NGC 4374, we obtain multi-band SBF measurements of these galaxies. These measurements, coupled with existing ground-based and band measures, and space-based from ACS data ( hereafter; for integrated colours we will also use ACS data, indicated as in the paper), provide the largest wavelength coverage of SBF measures for single galaxies. With such sample of measures we investigate the properties of the two galaxies using the SBF technique under its twofold aspects: as a distance indicator and as a stellar population properties tracer. Furthermore, since the target galaxies have hosted three SNe Ia events – SN 1939B in NGC 4621 (Zwicky, 1942), and SN 1957B (Bertola, 1964, and references therein) plus SN 1991bg (Kosai et al., 1991) in NGC 4374 – we can explore the capabilities of the SBF method to improve our knowledge on the relation between the SNe Ia progenitors and the stellar population they belong to.
The paper is organised as follows: a description of the observational data set, the data reduction and calibration procedures, and the procedure for SBF measurements is given in §2. The analysis of distances is presented in §3, while the study of stellar population properties based on SBF is presented in §4. A summary and the conclusions finish the paper in §5.
2 The Data
For this work we used , and data of two Virgo cluster galaxies, NGC 4621 and NGC 4374, observed with the FORS2 camera of the VLT. Some relevant properties of the targets are reported in Table 1.
The science images of the galaxies and the calibration files (bias, flat, field of standard stars) were retrieved from the ESO archive111http://archive.eso.org/.
In one case, NGC 4374, we could not use the total integration time available because of a slight rotation () between different frames which badly affects the SBF signal (see below). In Table 1 we list the total exposure times for each filter and for both galaxies.
2.1 Data reduction and calibration
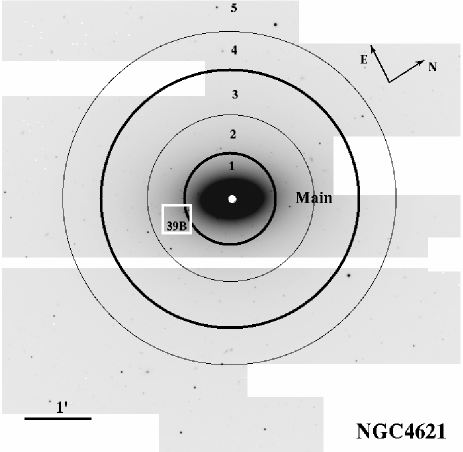
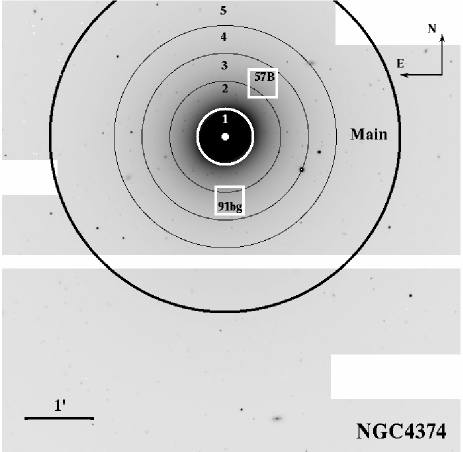
All data were retrieved from the archive and processed with standard data reduction procedures using IRAF222IRAF is distributed by the National Optical Astronomy Observatories, which are operated by the Association of Universities for Research in Astronomy, Inc., under cooperative agreement with the National Science Foundation. tasks. The procedure is briefly described here. We obtained master bias and flat frames (one per filter) for each observing night. Individual frames are bias-subtracted, flattened, shifted into registration, and combined, rejecting pixels affected by cosmic ray hits. To combine the frames we imposed no sub-pixel registration, in order to avoid the contamination to SBF due to the sub-pixel interpolation (Jensen et al., 1998). Finally, the seeing between targets and filters ranged between and . The combined frames are shown in Figure 1.
The standard calibration plan of FORS2 provides nightly multi-band observations of Landolt (1992) standards, which are used to calibrate the photometry of the two galaxies.
2.2 Data analysis and SBF measurements
To derive the photometry of sources in the frames and measure the fluctuation amplitudes we used the same procedure described in our previous works (Cantiello et al., 2005, 2007a, 2007b, 2009; Biscardi et al., 2008). The main steps of SBF measurement involve: sky background determination, model and large scale residual subtraction; photometry and masking of point-like and extended sources, including dust; power spectrum analysis of the residual frame.
Here we briefly describe some relevant parts of the analysis. We determined the sky background in the galaxy images by fitting the surface brightness profile of the galaxy with a Sersic’s law (Sersic, 1968) plus a constant term. A first model of the galaxy was obtained and subtracted from the sky-subtracted frame. The wealth of bright sources appearing after model subtraction were masked out; the procedure of model fitting and masking was then iteratively repeated until the residual frame (original frame minus galaxy model) was considered satisfactory. After the subtraction of the best galaxy model, the large scale residuals still present in the frame were removed using the background map obtained with SExtractor (Bertin & Arnouts, 1996) adopting a mesh size times the FWHM (Cantiello et al., 2005). In the following we refer to the sky, galaxy-model and large scale residuals subtracted image as residual frame.
The photometry of fore/background sources and of Globular Clusters (GCs hereafter) was derived with SExtractor on the final residual frame. As described in our previous works, we modified the input weighting image of SExtractor by adding the galaxy model (times a factor between 0.5 and 10, depending on the galaxy; for details see Jordán, 2004; Cantiello et al., 2005) so that the SBFs were not detected as real objects. To correct for Galactic reddening we used the values from Schlegel et al. (1998) reported in Table 1. The aperture correction (a.c.) was obtained from a number of isolated point-source candidates in the frames and by making a curve growth analysis out to .


Once the corrected catalogue of sources was derived, the next step was to fit the luminosity functions of external sources, that will be used to estimate the extra-fluctuation term due to unmasked faint sources (Tonry et al., 1990). We derived the fit to GCs and background galaxies luminosity functions from the photometric catalogue of sources, after removing the brightest/saturated point-like sources and the brightest and most extended objects. The best fit of the sum of the two luminosity functions, shown in Figure 2, and the extra-fluctuation correction term, , were derived as in Cantiello et al. (2005).
To measure SBF magnitudes we proceeded by estimating the azimuthal average of the residual frame power spectrum, , then matching it with the power spectrum of a template PSF convolved with the mask image, . The total fluctuation amplitude was obtained via a robust minimisation method (Press et al., 1992) as the multiplicative factor required to obtain the matching , where is the white noise constant term. As template PSF we used 6 different isolated bright point-like sources in each residual frame, which, after normalisation, were singularly adopted to estimate the SBF signal of the galaxy.
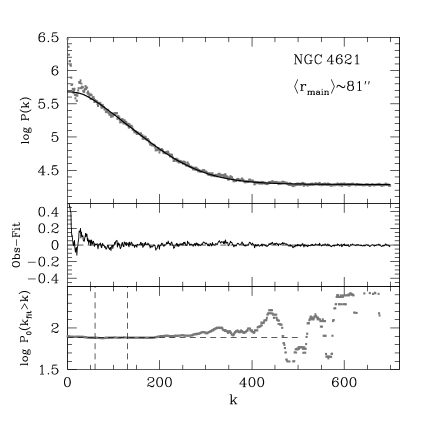
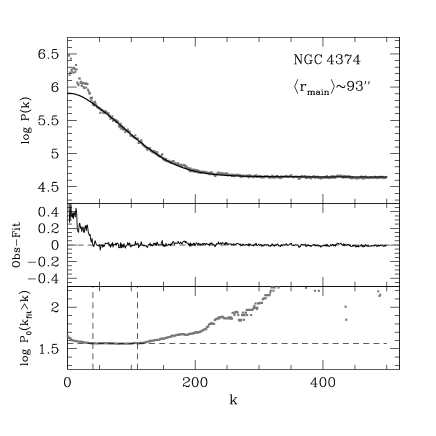
For both objects the fluctuation amplitude, , was estimated within a circular annulus, adopting the same average inner and outer radii used by Tonry et al. (2001) in order to allow a homogeneous combination of our and Tonry et al. data. Figure 3 shows the power spectrum analysis of both galaxies.
Furthermore, in order to study the radial variation of SBFs, and the SBF properties in the sites where Type Ia Supernova events are recorded, we ran the same SBF measurement procedure described above in five annuli per galaxy, and in three more box-shaped regions centred on each SN. All regions used are shown in Figure 1. We must emphasise that the effect of the extra-fluctuation correction term, , and its relative amplitude with respect to the total fluctuation signal, , changes from region to region, and the ratio increases for outer regions and bluer bands. Thus, a systematic under/over-estimate of may lead to over/under-estimated SBF magnitudes. Table 2 shows the ratios for all regions and bands considered here; the numbers in the table demonstrate that and -band SBF magnitudes have corrections much lower than the total fluctuation signal, even for the outermost annulus considered. On the contrary, for -band measures the ratio in some of the regions considered reaches values as high as , implying that the extra correction term is comparable with , thus the SBF magnitudes will be considered with caution in such regions.
| Annulus | NGC 4621 | NGC 4374 | ||||
|---|---|---|---|---|---|---|
| Main | 17 | 7 | 5 | 29 | 11 | 9 |
| 1 | 6 | 4 | 4 | 11 | 7 | 8 |
| 2 | 13 | 6 | 4 | 17 | 9 | 8 |
| 3 | 24 | 9 | 6 | 26 | 11 | 9 |
| 4 | 34 | 13 | 8 | 38 | 13 | 9 |
| 5 | 37 | 15 | 10 | 44 | 16 | 11 |
| SN 1939B | 12 | 5 | 4 | |||
| SN 1991bg | 37 | 10 | 9 | |||
| SN 1957B | 25 | 9 | 7 | |||
Table 3 summarises our measurements; for each galaxy, we tabulate (1) region identification; (2) average equivalent radius of the region ; (3-5) SBF magnitudes measured in ; (6-7) integrated colours.
| Annulus | ||||||
|---|---|---|---|---|---|---|
| (arcsec) | (mag) | (mag) | (mag) | (mag) | (mag) | |
| NGC 4621 | ||||||
| Main | 81 | 32.83 0.10 | 31.84 0.06 | 30.94 0.08 | 0.893 0.002 | 1.449 0.002 |
| 1 | 29 | 32.43 0.09 | 31.75 0.07 | 30.96 0.06 | 0.912 0.001 | 1.474 0.001 |
| 2 | 58 | 32.83 0.10 | 31.83 0.06 | 30.94 0.08 | 0.900 0.001 | 1.455 0.001 |
| 3 | 95 | 32.83 0.10 | 31.81 0.06 | 30.93 0.07 | 0.884 0.002 | 1.439 0.003 |
| 4 | 132 | 32.87 0.11 | 31.74 0.07 | 30.90 0.08 | 0.871 0.005 | 1.431 0.006 |
| 5 | 193 | 32.63 0.12 | 31.59 0.06 | 30.81 0.06 | 0.839 0.008 | 1.391 0.011 |
| SN 1939B | 55 | 33.01 0.10 | 31.84 0.07 | 30.97 0.08 | 0.915 0.001 | 1.469 0.001 |
| NGC 4374 | ||||||
| Main | 93 | 33.31 0.08 | 32.11 0.04 | 31.40 0.08 | 0.925 0.002 | 1.494 0.003 |
| 1 | 20 | 32.43 0.06 | 31.51 0.04 | 31.01 0.08 | 0.945 0.001 | 1.521 0.001 |
| 2 | 39 | 33.08 0.07 | 32.03 0.04 | 31.33 0.08 | 0.931 0.001 | 1.501 0.002 |
| 3 | 63 | 33.36 0.09 | 32.23 0.03 | 31.45 0.08 | 0.922 0.002 | 1.489 0.004 |
| 4 | 88 | 33.58 0.08 | 32.23 0.02 | 31.41 0.08 | 0.919 0.003 | 1.486 0.006 |
| 5 | 122 | 33.47 0.10 | 32.22 0.03 | 31.44 0.08 | 0.919 0.006 | 1.486 0.011 |
| SN 1991bg | 58 | 33.87 0.07 | 32.13 0.04 | 31.43 0.08 | 0.927 0.002 | 1.495 0.00 |
| SN 1957B | 59 | 33.50 0.09 | 32.13 0.03 | 31.35 0.08 | 0.917 0.002 | 1.484 0.00 |
3 Analysis of distances
To estimate distances based on the SBF method, as for most distance indicators, a calibration of the absolute SBF magnitude is required. The most widely adopted bands for SBF measures are the optical and bands, and the near– and ones (Pahre & Mould, 1994; Tonry et al., 2001; Mei et al., 2007; Jensen et al., 2003; Blakeslee et al., 2010). All and measures available come from HST observations taken with the ACS/WFC and NICMOS/NIC2 detectors, respectively (e.g. Jensen et al., 2003; Mei et al., 2007; Blakeslee et al., 2009). The total number of SBF data available in these pass-bands is around measures. As a consequence, the calibrations in such bands, especially the optical ones, are well established as testified, for example, by the accurate characterisation of the versus relation derived by Blakeslee et al. (2009) using ACS data of Virgo and Fornax cluster galaxies.
SBF measurements in other bands are not popular, with a total of 70 measures available for , and bands (e.g. Tonry et al., 1990; Jerjen et al., 2000; Blakeslee et al., 2001; Sodemann & Thomsen, 1996; Cantiello et al., 2007b). This is due to the fact that SBF magnitudes at these wavelengths tend to be more sensitive to stellar population properties and, consequently, the calibration has a larger scatter and is less reliable, while for distance studies the most favourable condition is that the magnitude of the standard candle is relatively constant or has a tight predictive relation as a function of some other distanceindependent property, such as colour. Taking advantage of the well constrained distances of the target galaxies, we will derive new distances based on our measurements and empirical/theoretical calibrations, and compare the various results to test calibrations adopted. In the upper part of Table 4 we report the SBF measures for NGC 4621 and NGC 4374 in different bands as derived in literature, the distance moduli , and the calibration used. The second part of the table gives the distances derived by us as discussed below.
3.1 Empirical calibrations
Cantiello et al. (2007a) compared the existing and band
calibration equations derived from different observational data, in
order to identify the best empirical calibration for the colour
interval mag in both pass-bands. For -band
SBF magnitudes the best calibration equations resulted to be:
for mag (1);
and
mag for the mag (2).
To use the above calibration we adopt the colours from Tonry et al. (2001), and the SBF measures listed in Table 3 for the main annulus. The distances obtained are shown in Table 4 and will be discussed with all other estimates at the end of the section.
For -band SBF, the most recent empirical calibration for
normal elliptical galaxies was provided by Tonry et al. (1990) who,
however, considered it unreliable. Distance estimates for a large
number of dwarf ellipticals have been provided by Jerjen and
collaborators (e.g. Jerjen et al., 1998, 2000, 2004) based on
-band SBF measures and semi-empirical relations. Using the
colour, the authors recognised two different branches for the SBF
versus colour relation, a linear branch:
for mag (3);
and an
parabolic branch, partly overlapping to the previous one:
for mag (4) (Jerjen et al., 2004). To derive distances,
reported in Table 4, we used the red/linear branch
calibration.
The small amplitude of the fluctuations in the -band and the higher sensitivity to stellar population properties with respect to other optical bands (see, e.g., Worthey, 1993a; Cantiello et al., 2003, 2007b) make this band unreliable for distances studies. Besides, only a handful of measures exist, including the present ones, and no distance has been estimated using -band SBF measurements.
3.2 Theoretical calibrations
Empirical calibrations are generally preferred for SBF studies, also thanks to the aforementioned small uncertainties for certain filters. However, the derivation of such relations requires substantial observational effort for each pass-band. On the other hand, models have the advantage of being homogeneous through the different bands, but need many different counter-checks to be considered reliable. In this work we take as reference the SBF versus colour equations derived using the simple stellar population (SSP) models from the Teramo-Stellar Population Tools (SPoT group333Visit the web-site: www.oa-teramo.inaf.it/spot. For a detailed review of the SPoT models we remind the reader to Raimondo et al. (2005) and references therein. These models have already been proved being very effective not only to match the empirical SBF calibrations in different bands, but also to reproduce the resolved (colour magnitude diagrams) and unresolved (colours, magnitudes) properties of stellar populations (Brocato et al., 2000; Cantiello et al., 2003; Raimondo et al., 2005; Cantiello et al., 2007a; Biscardi et al., 2008; Cantiello et al., 2009; Raimondo, 2009).
For example, in a previous paper, Biscardi et al. (2008) showed that the SPoT models for an age interval between 1.5 and 14 Gyr, and metallicity between -0.4 and 0.3 dex are able to reproduce both the -band and -band calibrations from Tonry et al. (2001) and Mei et al. (2007), respectively.
In the present work we adopt the same models used by
Biscardi et al. and derive absolute and -band SBF
magnitudes versus the integrated colour. Using the on-line
SPoT models we obtain the following relations:
(5),
(6),
we also derive, for sake of completeness,
the -band calibration:
(7).
However, we recall that it is hazardous to derive distances from
eq. (7) because strongly depends on the properties of the
stellar population originating the SBF signal (see section
§ 4.1).
As a further check based on an independent set of stellar population models, we also used the and equations provided by Blakeslee et al. (2001), which, differently from the SPoT models, are derived using composite stellar populations (see the quoted paper for more details).
3.3 Results
By inspecting the new and old distance estimates in Table 4 we find a satisfactory agreement within the quoted uncertainties, no matter what calibration (empirical or theoretical) or pass-band/colour relation is used, with the sole exception of -band data which we report here only for sake of completeness.
The distance moduli derived from SBF are affected by the uncertainties present in the empirical/theoretical calibrations, besides the uncertainty of the SBF measure itself. In this work, for the distance moduli taken from literature where no calibration error is given we consider safe to assume an error of the order of 0.20 mag, which includes zero-point uncertainty and the scatter of empirical calibrations (Tonry et al., 2001; Jensen et al., 2003). Similarly we assume 0.20 mag error for the theoretical calibrations, which is originated by the spread between models with different age and metallicity.
Keeping in mind such uncertainty, and the error in the SBF measures, the results in Table 4 can be summarised as follows:
-
•
although the colour provided by Tonry et al. was measured in galaxy regions slightly different from ours444As explained before, we adopted the same “average” inner and outer radii of Tonry et al., but the detailed shape of the annulus, plus the masking of sources is clearly different between the two datasets. the distances derived from using eq. (1) agree with other data from literature. A similar result is true for if the linear branch relations by Jerjen et al. (2004) are adopted;
-
•
the distance estimates obtained using empirical calibrations show a slight tendency to have a smaller scatter with respect to those from theoretical calibrations;
-
•
whether SSP models from the SPoT group or the Blakeslee et al. (2001) composite models are used the distances derived are substantially similar to each other, and agree with expected values. Such result implies that for the bandpasses and the colour interval considered here composite stellar population models, which try to better reflect the real population mixing of galaxies, are not strictly necessary for the purposes of deriving appropriate SBF versus colour relations;
-
•
as discussed above, coupling measures with eq. (7) provides unreliable distance moduli, this confirms that this band must discarded for distances. Interestingly, the difference between the -band distance moduli and the literature average moduli is significantly larger for NGC 4621 ( mag) than for NGC 4374 ( mag). We will analyse further this evidence in the next section on stellar population analysis.
Finally, the last lines of Table 4 provide the median distance moduli of the two targets obtained by averaging our estimates (empirical and theoretical calibrations, except -band), all SBF , including ours, the distance moduli without SBF555All non-SBF distances are taken from the NED Redshift Independent Distance database. The distance indicators used include Globular Cluster and Planetary Nebulae Luminosity Functions, Type Ia Supernovae and Globular Cluster half light radii. For a complete list of methods, and associated references, visit the URL http://ned.ipac.caltech.edu/forms/d.html. In case of multiple estimates obtained with the same indicator only the most recent one is considered., and the results from ours plus all literature data. By inspecting such data we find an excellent agreement between our and literature distance moduli and, more in general, between non-SBF and SBF-based distances, a results that should be regarded as a direct evidence of the absence of any significant bias or systematics between the quoted distances. In addition, such agreement also proves the reliability of -and -band SBF calibrations presented in this section.
| NGC 4621 | NGC 4374 | |||||
| Filter | Colour | Ref. Color/Data | ||||
| SBF from literature | ||||||
| [1] | 29.67 0.18 | 31.160.20 | 29.77 0.09 | 31.160.11 | ||
| [2] | 29.12 0.01 | 30.860.07 | 29.53 0.01 | 31.340.07 | ||
| … | [3] | 25.46 0.16 | … | 25.43 0.22 | … | |
| Our measurements | ||||||
| Empirical Calibrationsb | ||||||
| [4] | 31.84 0.06 | 30.910.21 | 32.11 0.04 | 31.080.20 | ||
| [5] | 30.94 0.08 | 31.050.21 | 31.40 0.08 | 31.250.22 | ||
| Theoretical Calibrations–SSPb | ||||||
| [6] | 32.83 0.10 | 30.2 | 33.31 0.08 | 30.5 | ||
| [6] | 31.84 0.06 | 30.760.21 | 32.11 0.04 | 30.910.20 | ||
| [6] | 30.94 0.08 | 30.930.21 | 31.40 0.08 | 31.270.22 | ||
| Theoretical Calibrations–CSPb | ||||||
| [7] | 31.84 0.06 | 30.990.21 | 32.11 0.04 | 31.170.20 | ||
| [7] | 30.94 0.08 | 31.040.21 | 31.40 0.08 | 31.410.22 | ||
| Median | ||||||
| NGC 4621 | NGC 4374 | |||||
| This work | 30.96 0.11 | 31.21 0.17 | ||||
| all SBFs | 31.08 0.19 | 31.21 0.14 | ||||
| No SBFs | 30.97 0.21 | 31.17 0.18 | ||||
| All avaliable | 30.98 0.17 | 31.22 0.16 | ||||
References
- [1
Notes
-
Blakeslee et al. (2009) data are given in the AB-mag system.
-
We adopted 0.2 mag as safe calibration error for distance moduli given in literature with no calibration uncertainty, and distances based on theoretical calibrations (see text).
-
Distances derived from -band SBF are reported to show that the sensitivity of to stellar population poperties makes unreliable any distance estimate.
3.4 Comparison with SNe Ia distances
The comparison of SBF and SNe Ia distances plays a fundamental role in the problem of the cosmological distance scale. SBF magnitudes are capable of providing distances with accuracy within 100 Mpc (Jensen et al., 2001; Biscardi et al., 2008; Blakeslee et al., 2010), a result that will be likely improved with new and next generation observing facilities, allowing to estimate accurate distances of bright ellipticals out to 200 Mpc. On the other hand, SNe Ia can provide distances to objects at much larger distances. Thus, deriving self-consistent distances using these two indicators is a crucial step to bridge local to cosmological distances, in order to reduce the number of rungs in the cosmological distance scale, i.e. to reduce systematic uncertainties.
The sample of objects with known SBF measures and well studied SNe Ia light curves is relatively small, due to the fact that SNe Ia occur in all kind of galaxies, but are mostly observed in late type galaxies because of an observational bias, on the contrary SBF are measured almost only in early type galaxies.
Nevertheless, a comparison of SBF and SNe Ia distances was carried out by Ajhar et al. (2001), who found that there is a good agreement between the two distance indicators, provided that a consistent set of Cepheid calibrating galaxies is used. However, their statistics grounded on objects and Ajhar et al. made it clear that “[…] Unquestionably, the SN Ia and SBF absolute calibrations are in need of further refinement.”
As already mentioned, a total of three type Ia Supernova events has been recorded in the two galaxies. Two SN Ia have been observed in NGC 4374, SN 1991bg and SN 1957B, while SN 1939B was discovered in NGC 4621. The SNe are located all at 1 arcmin from the photometric centre of the host galaxy. Even though all three SNe are classified as type Ia, they show a wide range of luminosity – not unexpected in E/S0 galaxies (Gallagher et al., 2005) –, in particular all events are fainter at maximum light than a normal SN Ia after correcting for the correlation between peak luminosity and decline rate (Hamuy et al., 1996). SN 1991bg is one of the most sub-luminous SN Ia yet observed ( mag fainter than normal, Turatto et al., 1996). SN 1957B has an absolute magnitude at maximum mag fainter than a normal SN, but still brighter than SN 1991bg (Howell, 2001). Finally, SN 1939B at maximum light is mag sub-luminous (Minkowski, 1964).
Unfortunately, being sub-luminous events, the standard peak luminosity versus decline rate relation does not provide good distance estimates with these SNe. Ajhar et al. (2001), in fact, did not take into account SN 1939B and SN 1957B, while SN 1991bg appeared in their list of Supernovae but it was not used for SBF-SNe Ia comparison, it is was instead included “for completeness and for future studies of SNe Ia luminosities.”.
More recent studies, however, have provided new methods that can be adopted to derive distances with these sub-luminous SNe: the calibration based on decline rate and colours by Folatelli et al. (2010), the MLCS2k2 by Jha et al. (2007), and the method by Wang et al. (2006).
Using eq. (6) of Folatelli et al. (2010) with the best-observed fit parameters, we obtain the following distance moduli:
-
•
SN 1939B in NGC 4621: taking the peak luminosity from the Asiago Supernova Catalogue (Barbon et al., 1989)666The updated catalogue is available at the URL http://graspa.oapd.inaf.it , a decline rate of estimated from the light curve reported in Leibundgut et al. (1991), and using eq. (3) from Folatelli et al. (2010) to get the colour, we obtain , with an uncertainty of the order of 0.5 mag if errors of 0.2 mag, 0.25 days and 0.15 mag are adopted for , and , respectively;
- •
- •
In all cases the distance moduli derived using the calibration from Folatelli et al. (2010) agree within uncertainties with the median values reported in Table 4.
Jha et al. (2007) developed an updated version of the MLCS method (Riess et al., 1998) called MLCS2k2, which includes new procedures for the -correction and for internal extinction corrections. Using the light curve parameters of SN 1991bg Jha et al. derive adopting . Although such distance agrees with the values reported in Table 4, the agreement becomes certainly better if is taken - a value consistent with the ones typically derived from SBF distances (Tonry et al., 2000; Freedman et al., 2001) - as suggested by the authors; in that case, in fact, one has mag.
In the case of Wang et al. (2006) the calibration parameter adopted is the , i.e. the colour at 12 days past optical maximum. The authors find , based on the properties of SN 1991bg and using . Such is more than 2– out the median values in Table 4 obtained using many independent distance indicators, and it also disagrees with the values obtained using the Folatelli et al. (2010) or Jha et al. (2007) calibrations, thus we flag the Wang et al. estimate as unreliable for the case of SN 1991bg.
In conclusion, we find that the distances of NGC 4621 and NGC 4374 derived via the light curve properties of their SN Ia agree perfectly with the SBF distances – and with the most recent estimates from literature – if the calibration by Folatelli et al. (2010, useful for all three SNe), or Jha et al. (2007, for the case of SN 1991bg) are used.
4 Analysis of unresolved stellar populations with SBF and integrated colours
As mentioned before, the SBF magnitude of a stellar population corresponds to the ratio of the second to the first moment of its luminosity function. Since its first applications, such characteristic has suggested the use of the SBF method as a powerful diagnostics of stellar population properties. The earliest theoretical studies on this subject (Buzzoni, 1993; Worthey, 1993a, b) were focused on the relationship between SBF and age/metallicity, but also showed how the fluctuation amplitude in bluer pass-bands, like , could be used as a useful tracer of the hot stellar components in the galaxy. Despite several authors have confirmed, and further extended, such early findings (Blakeslee et al., 2001; Cantiello et al., 2003; González et al., 2004; Raimondo, 2009), a comprehensive and homogeneous analysis of multi-band SBF measurements for a large sample of galaxies is still missing. The various set of models have clearly shown that optical to near– SBF colours can be very effective to lift the age/metallicity degeneracy which affects “classical” integrated colours (Worthey, 1994). Observationally, a few data exist in literature (Jensen et al., 2003), but they mostly refer to spatially non homogeneous regions. On the other hand, colours have also been studied for various galaxies, but they suffer for an age/metallicity degeneracy similar to classical colours, although the information obtained using such measures is independent and complementary to the integrated colours derived for the same targets (Tonry et al., 1990; Blakeslee et al., 2001; Cantiello et al., 2007a, b).
Concerning the use of SBF to study stellar populations, using high quality data has allowed to measure SBF variations in optical bands within different regions of the galaxy. As a consequence, even if and SBF magnitudes and colours are not as much effective in removing the age/metallicity degeneracy (see below), the measure of SBF radial variations has provided useful results on how the mean properties of the dominant stellar population change with galactic radius (Cantiello et al., 2005).
The targets analysed in this work have already been considered for other SBF measurements surveys. In particular, the aforementioned ground-based SBF survey (Tonry et al., 2001), the near– measurements for nine Virgo ellipticals by Pahre & Mould (1994), and the ACS Virgo Cluster Survey (Côté et al., 2004) all have the two galaxies in their target list. The SBF magnitudes from these databases are reported in the first part of Table 4. None of these cited works presents the measurement of SBF magnitudes at various galactic radii. On the contrary, thanks to the high quality of the VLT data available, we have been able to obtain fluctuation amplitudes at various radii (Table 3).
Differently from other bright elliptical galaxies studied in previous works (Cantiello et al., 2005, 2007a), we can report the absence of radial and gradients in NGC 4374. For NGC 4621, instead, a small but non-negligible brightening of SBF magnitudes at larger radii is found in and . On the other hand, the of both galaxies shows a significant scatter between the different annuli, thus no evidence of systematic trends with radius is observed in this band.
4.1 SBF-colours versus integrated colours
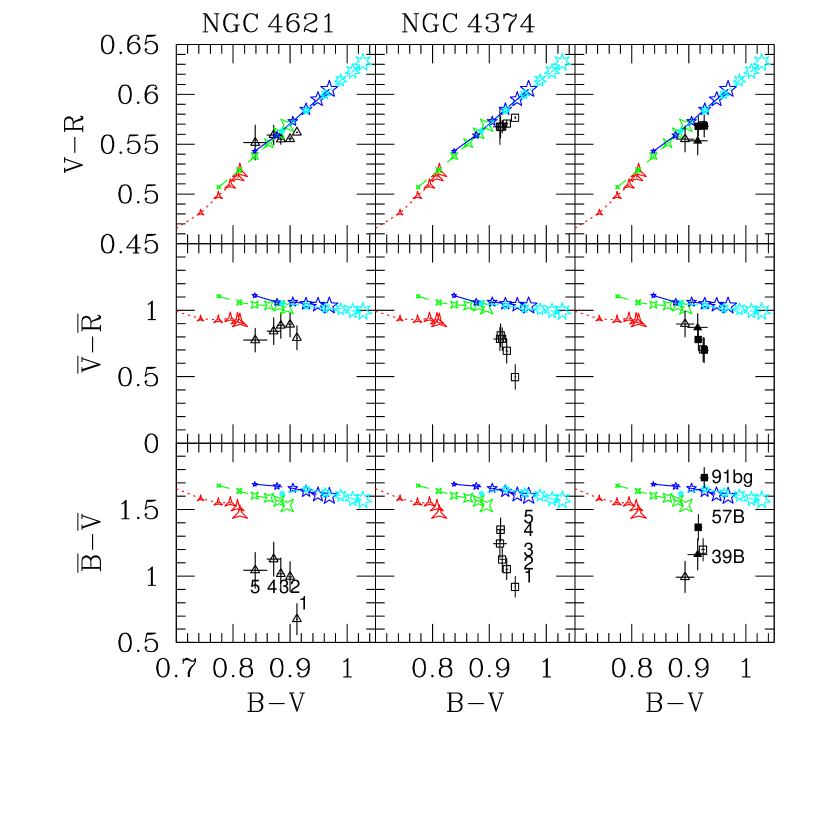
By plotting SBF and integrated colours for each target (Figure 4), and comparing the data of the two galaxies between them and with models, we can make various considerations on the host unresolved stellar systems. We consider the updated version of the SPoT models (Raimondo et al., 2011), which for the photometric bands and chemical composition used in this section confirm the results obtained from the previous Raimondo et al. (2005) models.
As a first general consideration, we find that the SBF colour, and the integrated and colours predicted by models representing old ( 7 Gyr) and metal rich ( dex) SSPs are in good agreement with the measured values. Differently, the is much more sensitive to the properties of the dominant stellar population (see below) and the matching with “canonical” SSP models is less satisfactory in this band.
Starting from these general considerations on the properties of the “dominant” stellar population in the galaxies (i.e. the stellar population which is is emitting the largest part for the flux responsible for the colours and the SBF signal) let us analyse more in details the result of Figure 4.
The left and middle columns of panels in Figure 4 show the SBF colours and measurements in the five annuli considered for each galaxy versus the integrated . The annuli appear numbered in the lower panels according to the numbers reported in Table 3, so that inspecting the data in the figure it is also possible to recognise the radial behaviour of plotted quantities. In the third column, instead, the overall SBF measures are plotted (“main” annulus data in Table 3, empty symbols) together with SBF in the SNe regions. It is useful to emphasise that for both galaxies our integrated colours and colour profiles agree with the same measurements from Idiart et al. (2002).
By inspecting results in the figure, we find that NGC 4621 does not show any significant SBF colour gradient either in or (lower and middle left panels), and no gradient even in the integrated colour (top left panel). The only colour showing radial changes is the , varying from mag for the inner annulus (#1), to in the outermost (#5). As already mentioned, inspecting the and data for NGC 4621 in Table 3, a small but non-negligible gradient seems to be present, of mag in and mag in , if the inner annulus is discarded. The and gradients have the same trend with colour, i.e. brighter SBF magnitudes associated with bluer colours/larger radii, thus they tend to cancel-out when the SBF-colour is considered. In fact, if the innermost annulus is neglected, a SBF-colour gradient of appears in the versus plane for NGC 4621, although it is of the same amplitude of estimated uncertainties. Even so, the radial trends of the SBF magnitudes and of the are both consistent with the well known scenario of a more metal-poor stellar component (i.e. bluer integrated colours, and brighter SBF magnitudes for the pass-bands considered here) at larger galactocentric radii.
For NGC 4374 (central panels) we find that and are practically flat along the galaxy radius, if the innermost annulus (#1) is excluded. Due to the presence of a dusty disk in the galaxy centre, in fact, we left unmasked only a small fraction of the area in the annulus #1, but further contamination from dust might still be present. Differently from the previous case, the and data of NGC 4374 in Table 3 do not show any systematicity versus radius, although the versus panel seems to show a correlation between the two plotted magnitudes, mostly due to the cited innermost annulus.
As mentioned above, the comparison between measurements and models in the two upper panels of each column reveals that the data of galaxies lie close to the position of SSPs with dex and t 7 Gyr. However the age-metallicity degeneracy suffered by classical and SBF colours obtained by combining these bands prevents us from giving more precise information on the dominant stellar components in the galaxy.
The lower panels, which involve , deserve a separate and detailed discussion, since both galaxies show a colour much bluer than models, an evidence more severe for NGC 4621. For this galaxy, in fact, the is 0.2 mag bluer than NGC 4374, and 0.4 mag bluer than models. We also note that NGC 4374 shows a radial change leading the value of the outermost annulus to be quite similar to the models. Differently, NGC 4621 does not present any systematic gradient and, except for the innermost annulus the is nearly constant in every studied region of the galaxy.
To understand the origin of the mismatch between data and models, visible in the lowermost panels of Figure 4, and of the peculiarly blue colour of NGC 4621, we have considered to take advantage of the versatility of the SPoT stellar population synthesis code and carry out some specific numerical simulations, to investigate if and how the presence of a complex stellar population modifies the expected . In addition, for metal rich models we have also considered the case of a non negligible fraction of Horizontal Branch (HB) stars having higher effective temperatures with respect to “canonical” stellar evolution models.
In order to find indications on the origin of the peculiar behaviour of the two galaxies, our numerical tests have been organised as follows: we have explored the effects of the presence of a hot HB (HHB) component to field stars; a young stellar population is added to a “reference” old and metal-rich population, and a metal-poor population is added to the reference one. For the comparison in , and bands we adopted the SBF measured in five annuli, plus the measures in the SNa Ia regions, while for the panels including the taken from literature we adopted our main annuli SBF measurements. The results of the simulations and the comparisons with data are briefly discusses below, and shown in Figure 5 where three different SBF colours are plotted against .
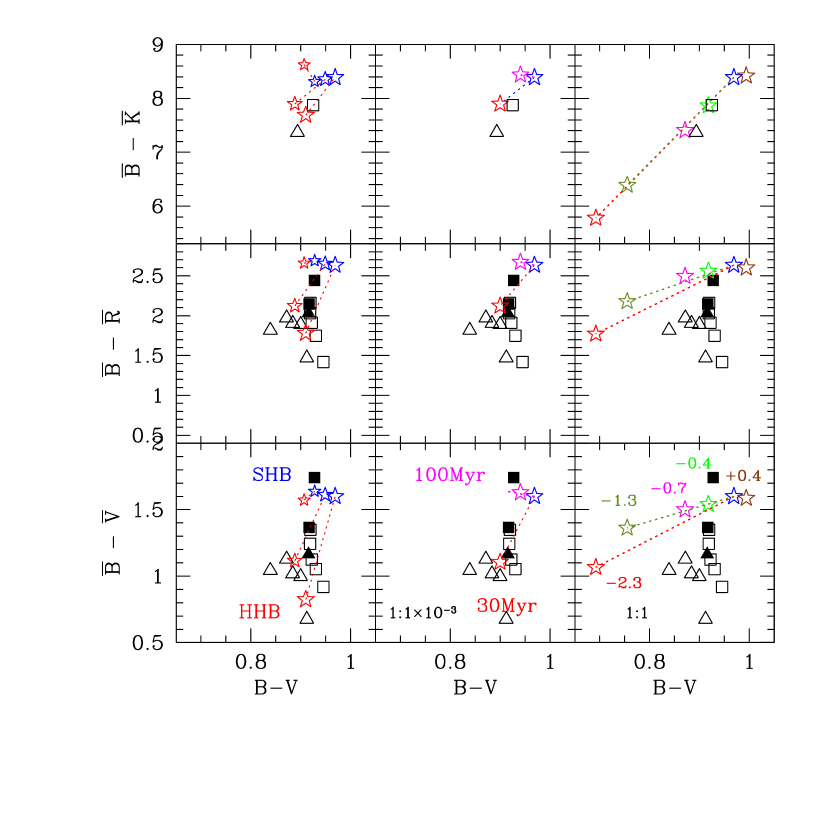
-
•
In order to mimic the presence of HHB stars, we carried out a numerical experiment by considering that 50% of HB stars have suffered large mass–loss during the RGB phase (first column of panels in Figure 5). As a result, a percentage of low mass stars populates the blue/hot part of the horizontal branch. This is not unrealistic since such hot component is observed in several metal-rich stellar clusters (e.g. NGC 6441 and NGC 6388), whatever the mechanism responsible of this evidence is. In the figure we consider three populations with solar metallicity and ages 10, 12, and 14 Gyr. Both SBF and integrated colours move from the “standard” positions (standard HB, SHB, label in the figure) to the hot/blue region of the diagram (HHB in the figure). The effect is larger for SBF colours including with respect to integrated colour due to their increased sensitivity to even a small number of bright hot stars.
-
•
In the second numerical experiment (middle panels) a very young population (two different ages are considered: 30 Myr and 100 Myr) is added to a population of 14 Gyr and solar metallicity, with mass ratio between the two components . From the middle panels of Figure 5 appears that a very recent and diffuse burst of star formation is required to obtain a good matching between models and data.
-
•
The third column of Figure 5 reports the effects of a secondary metal-poor component of 14 Gyr added to the main solar metallicity one, the of the metal-poor component are labelled in the lower right panel of the Figure. Only a very metal poor population with a mass comparable to the one of the main component () produces relevant effects on SBF colours. In that case, however, the values of the observed integrated coluor are not well reproduced any more.
The three sets of simulations described seem to point out what already suggested: the most likely solution to the puzzling behaviour of -band SBF is the presence of hot HB stars. In fact, while the presence of a hot/young stellar component provides a good matching between integrated and SBF colours models with data (second scenario, middle panels in Figure 5), it appears unrealistic that these regular ellipticals host such diffuse and very young stellar component. Moreover, in such a case, i.e. an object with massive and extended recent star formation, it is likely that a large quantity of dust would still be present, preventing the SBF measure itself. However, with the only exception of an inner dust ring in NGC 4374, we do not find any sign of extended dust in both galaxies. The two-metallicity mixing scenario seems even more unlikely, such mixing, in fact, does not solve the mismatch between data and models for optical bands.
As a further element in support of the role played by HHB stars in determining the SBF signal of NGC 4621, we recall the works by Brown et al. (2000) and Brown et al. (2008), based on deep near and far- images of the compact elliptical galaxy M 32. Using HST data, the authors found that the number of PAGB stars in M 32 is significantly lower than the expectations of their stellar evolution models, while the presence of a HHB population has been observed and identified as the main contributor to the -emission of the galaxy.
Related to this issue, Cantiello et al. (2007a), using the data of eight ellipticals, suggested that the role of hot evolved stars cannot be neglected in modelling SBF magnitudes in this passband. In that case, though, the mismatch between the data and models in was solved by enhancing the number of PAGB expected assuming the evolutionary prescriptions by Brocato et al. (1990) and Brocato et al. (2000).
As far as concerns NGC 4621, our present results point towards the direction suggested by the observations of M 32. We show that HHB stars can be the stellar component responsible of the observed -excess, even though a combination of two stellar components (HHB and PAGB stars) could not be ruled out and the topic requires further investigations.
As already mentioned for the case of M 32, a further piece of information comes from the comparison of the integrated properties of the two galaxies in the wavelength interval where the very hot stellar component is dominant, i.e. the regime. In this wavelength regime, Longo et al. (1991) found that NGC 4621 is brighter than NGC 4374. The puzzling presence of a strong emission in some regular early-type galaxies, discovered in late (Code et al., 1972; Bertola et al., 1980), is now widely interpreted as the presence of a old hot stellar component. Although the mechanisms that created such component, or its true nature, are not well understood (Park & Lee, 1997; Kaviraj et al., 2007; Han, 2008), some of these old hot stellar sources may have effects on , as discussed by various authors based on both SSP models predictions (Worthey, 1993a; Cantiello et al., 2003), or on empirical data (Shopbell et al., 1993; Sodemann & Thomsen, 1996; Cantiello et al., 2007a). Moreover, a recent study of Buzzoni & González-Lópezlira (2008) presented a detailed analysis on the link between the characteristics and near– SBF amplitudes of elliptical galaxies.
In conclusion, the present analysis seems to support a scenario where the peculiar is related to a hot and old diffuse stellar component, like HHB stars. Larger samples of SBF colours in blue bands are required to provide further constraints.
4.2 SBF colour-colour diagrams
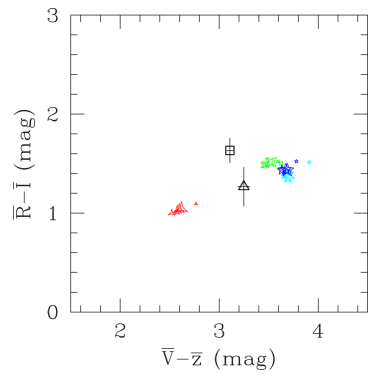
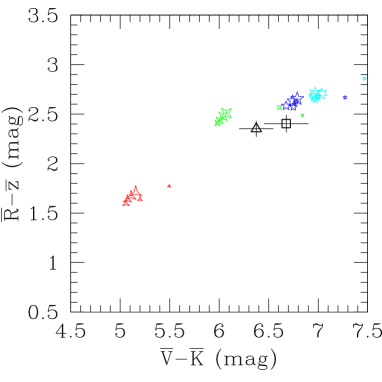
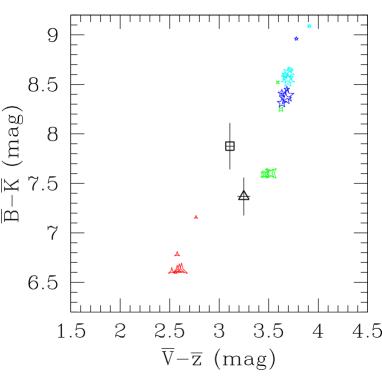
The coupling of literature , and -band SBF data for the two galaxies with our measures (main annuli) provides a sample of six independent SBF values useful to obtain three independent SBF-colour versus SBF-colour diagrams. Such wide pass-band coverage is, to our knowledge, the first ever presented for SBF. The diagrams with observations are shown in Figure 6, together with models. The upper panel of the Figure shows a feature that has already been discussed (e.g. Blakeslee et al., 2001; Cantiello et al., 2003), that is that model separation for pure optical SBF colours is not effective in removing the age-metallicity degeneracy. In such panel, in fact, all -0.4 dex models overlap to each other, with old and metal rich models superposed to young and metal poor ones.
The models degeneracy is significantly reduced in the middle panel, which includes the optical to near– SBF colour. The position of the two objects overlaps with models with different metal contents. In particular the bluer point, i.e. NGC 4621, is located near to the region of -0.4 dex with respect to NGC 4374, which appears slightly more metal–rich. Such behaviour is not unexpected, since the latter galaxy is brighter than the first one and, due to the known mass-metallicity relation (e.g. Bernardi et al., 1998), it is reasonable to expect a field population slightly more metal–rich in NGC 4374. It is worth to emphasise that the two-SBF–colour panel represents a useful tool to provide insights to the “absolute” of the dominant stellar component, within the observational error-bars, and the SSP models scenario adopted.
In other words, based on the SBF-colours analysis and on the integrated colours of field stars from this work (see also Tonry et al., 2001; Idiart et al., 2002; Mei et al., 2007) we find that the dominant stellar population of NGC 4374 is either more metal rich or older, or both, than what found in NGC 4621. Moreover, this result agrees with independent estimates of the metal content in these galaxies, based on spectral index measurements, which predict nearly identical (Idiart et al., 2007) or slightly higher metallicity for NGC 4621 (Kuntschner et al., 2001; Scott et al., 2009).
It must be pointed out, though, that these results are based on the naive interpretation of field stellar population properties solely in terms of age and chemical content differences. Nevertheless, as discussed above, SBF magnitudes and colours can be very sensitive to the presence of a blue/hot stellar sub-system, especially SBF in bluer pass-bands.
The lower panel in Figure 6 includes our measurements. As for the first panel, the colour is used in abscissa, in this case the separation between different SSP models allows to recognise that for the two larger values the colour is bluer for older ages. Taking as reference the models with solar metallicity, one can conclude that both galaxies have similar , matching with the oldest SSP models, but NGC 4621 has mag bluer than NGC 4374, as one would also expect in the case of a diffuse hot stellar component is present in this galaxy. As an example, a canonical SSP model at Gyr, solar metallicity has and mag; by artificially increasing the number of HHB stars (as described in section 4.1) our models predict , i.e. roughly the colour difference between the two galaxies, while is left unchanged.
A further consideration is the fact that in the bottom panel of Figure 6, NGC 4621 falls within the region of models with between -0.7 and -0.4 dex, even though the -band SBF is too bright. Such behaviour could be explained with bright -band SBF, so that the and SBF excess compensate each other allowing observations to match with models of intermediate metallicity. This would also make too red, causing the shift observed in the middle panel. In that case, i.e. too bright and -band SBF, the three panels of Figure 6 are all suggesting a for NGC 4621, and a larger metallicity for the dominant stellar component in NGC 4374.
Whether the position of NGC 4621 with respect to models is due to the presence of a metal poor dominant stellar component, or it is related to a diffuse hot component, cannot be established with present data. New independent observational data sets, and accurate modelling, able to match all the observed properties of the two galaxies, are needed to better understand the physical characteristics of the unresolved stellar systems in both targets.
Nevertheless, the coupling of -band with other optical or near– SBF measures, appears to be a promising method to unveil the properties of hot stellar components possibly hidden to other photometric indicators.
4.3 SBF colours and stellar populations properties in regions hosting type Ia Supernovae
The correlation between the SN Ia peak magnitude and the host-galaxy morphology, i.e. the host stellar population, is well known since the work by Hamuy et al. (1996), showing that intrinsically fainter events occur in early-type galaxies, while luminous events are often seen in late-type galaxies. The results on the mean stellar population properties in the galaxies, discussed in the previous sections, seem to support the idea that old stellar system, i.e. old progenitors, are required for sub-luminous SNe Ia.
To better constrain the properties of the local stellar populations we have measured SBF and colours in the areas where the SNe Ia exploded, adopting a square region. The results of the measurements are reported in Table 3, and shown with full triangles (for NGC 4621), and full squares (for NGC 4374) in the right panels of Figure 4.
First of all, we note that, from , and data, the stellar population properties in the selected regions and in the main annulus (empty black symbols) appear remarkably homogeneous. Taking into account only such colours, we conclude that the stellar component in the regions hosting the three SNe Ia and the overall stellar population in the galaxies have quite similar properties, with all data matching SSP models of dex and Gyr. In any case, old ages are expected, supporting the results by Gallagher et al. (2008) based on spectroscopic data. It is interesting to note that the properties of the dominant stellar populations in the regions of the two SNe Ia host by NGC 4374 appear strikingly similar in these panels, nearly identical to each other, notwithstanding the large projected separation (10 kpc) between the two regions.
Larger differences are seen between the three regions in the versus panel (lower right panel in Figure 4). Due to the aforementioned stronger sensitivity of -band SBF to changes of stellar population properties respect to other pass-bands, the larger scatter between the three SNe Ia is not surprising, and it might be possibly related to different levels of local “pollution” from a hot stellar component. Furthermore, the regions of NGC 4374 where SN 1991bg and SN 1957B exploded show a mag, despite their nearly homogeneous , and colours. Whether the is related to the SNe progenitors and their environment, and thus to the mag between the two SNe Ia, or to problems with the correction cannot be said using present data, and further analysis based on a richer sample is needed.
For what concerns NGC 4621, even including -band SBF data we find a good matching between global and local, i.e. near SN 1939B, stellar population properties.
5 Conclusions
We have presented a detailed multi-band study of SBF magnitudes for two bright galaxies in the Virgo cluster, NGC 4621 and NGC 4374, based on deep , and -band imaging data of the FORS2 camera at the VLT telescope.
Among the three bands available, the and have known empirical SBF calibrations useful to obtain the distances of the targets. Coupling our measurements with such calibrations, or with calibrations obtained from simple and composite stellar population models, we obtained accurate distances for the two galaxies which agree very well with other distance estimates taken from literature. This demonstrates both the reliability of the measured SBF magnitudes and the goodness of the calibrations adopted. Taking advantage of the fact that various SBF distances, based on different calibrations for different filters, are available for the two targets, we have compared the average SBF distance moduli with other non-SBF ones, to check for any possible systematics. Although the sample of galaxies is statistically small, the results obtained seem to rule out the presence of possible bias on SBF distances.
Taking the median of all available SBF and non-SBF distance estimates, we estimated: for NGC 4621, and for NGC 4374.
The two target galaxies hosted a total of three SN Ia events: one in NGC 4621, SN 1939B, and two in NGC 4374, SN 1957B and SN 1991bg, all classified as sub-luminous. Using some recent calibration relations based on decline rate and colours of the SN (Folatelli et al., 2010), and on the updated MLCS method (Jha et al., 2007) we find an excellent agreement between the SBF and SNe Ia distances. A result that is very promising in view of a reduction of the number of “rungs” to bridge local to cosmological scale distances, i.e. to significantly reduce the systematic uncertainties on distances of objects at large distances and, consequently, on cosmological parameters.
We also carried out SBF measurements on -band images, but such
measures were rejected for distance analysis. The sensitivity of SBF
magnitudes in this band to the stellar population properties makes
unreliable any calibration in this band. We tentatively derived
a -band calibration based on SPoT models - which have proved being
realistic in both and bands, as well as other studied bands
(Biscardi et al., 2008) -, but the results obtained confirm that SBF
magnitudes in such band are not well suited for any kind of distance
analysis.
Thanks to the high quality of the data, we have succeeded in measuring SBF magnitudes in various galactic regions. Both integrated and SBF colours (excluding ) seem to point out that the stellar population are relatively uniform along the galaxy radius. No sizable SBF gradient is observed in NGC 4374, while for NGC 4621 a small but non-negligible SBF gradient in and is observed, consistent with the known scheme of more metal poor dominant stellar populations at larger galactocentric radii (e.g. Cantiello et al., 2005). Given the fact that compared to -band SBF and are more sensitive to stellar population properties (Blakeslee et al., 2001; Cantiello et al., 2003), and gradients up to magnitudes were measured by Cantiello et al. (2005) on similar radial scales for a different set of targets, the negligible and gradients detected here might be explained by the position of the two objects within their host cluster. Since the two targets analysed are located in the regions with highest galaxy density in the Virgo cluster, in fact, this behaviour might be related to the major-merging events in such environment, which tend to smear out possible stellar population gradients (Kobayashi, 2004).
Taking advantage of the multi-wavelength coverage of our data set, and of existing , , and -band SBF measurements, we analysed the data of both galaxies in the SBF–colour versus integrated–colour and SBF–colour versus SBF–colour diagrams. This is the first SBF-analysis carried out using SBF data in six different pass-bands. As a result we concluded that the dominant stellar component in the two galaxies is very similar, though NGC 4374 seems to be slightly more metal rich than NGC 4621.
If -band measures are taken into account, the SBF colours of the two galaxies show non-negligible differences, with NGC 4621 having brighter SBF than NGC 4374. Given the known link between SBF magnitudes in blue bands and the properties of a hot old stellar component (Worthey, 1993a; Cantiello et al., 2003), we used the SPoT Stellar Population Synthesis code to simulate populations with “non-canonical” properties. In particular, to a solar metallicity old Gyr population, we have enhanced the content of hot HB stars (i.e., 50% canonical HB and 50% HHB), added a very young (down to 30 Myr) diffuse secondary component, and added a more metal poor SSP (down to dex). Within the limits of the small number of data, and adopting as a razor the physical plausibility of the population mixing, the simulations seem to favour the HHB component scenario.
This is also supported by the fact that Brown et al. (2000) and Brown et al. (2008) find the presence of HHB stars in the compact elliptical galaxy M 32 on the basis of observations. In this framework, it is relevant to recall that NGC 4621 is substantially brighter than NGC 4374 in the bands (Longo et al., 1991), and that the integrated properties of normal elliptical galaxies with bright emission are now interpreted as an effect of a diffuse hot stellar component (e.g. Park & Lee, 1997). Thus, further analysis is required to better constrain the links between the emission and SBF in early type galaxies, also in view of the recent studies on the relation of with near– SBF amplitudes (Buzzoni & González-Lópezlira, 2008), and larger samples of SBF colours in blue bands are required to provide further constraints to this scenario.
Finally, taking into account the integrated colours and plus SBF for the areas of the galaxies where type Ia Supernova exploded, we find no substantial differences between the local and the global stellar population properties in the galaxies. For SN 1939B and its host, NGC 4621, this is also true for -band SBF data. On the contrary, there is a 0.4 mag difference between the regions of the two SNe host in NGC 4374, SN 1957B and SN 1991bg. Due to the quoted sensitivity of blue-band SBF to stellar population properties, such difference and, more in general, the scatter in between the three SNe Ia might be related to different levels of local pollution from a hot stellar component, although for the case of SN 1991bg we cannot exclude the possible systematic effect of a low signal, comparable to the correction.
In conclusion, the present set of SBF measures shows that optical to near– SBF magnitudes can be very effective to unveil the properties of global and/or local stellar populations in distant galaxies. In particular, if (or even SBF in bluer bands) are available, various constraints can be set to the role of hot field stars in normal ellipticals, at the same time multi–band SBF can be used to analyse the relation between SNe and local stellar population properties. Nevertheless, serious limitations are set by the small samples of measures still available, new observations are advisable to further study stellar population properties based on multi–colour SBF analysis.
Acknowledgements.
M.C. acknowledges the support provided by the PRIN-INAF 2008 (PI. M. Marconi). We also thank the referee for his very helpful suggestions. Based on data obtained from the ESO Science Archive Facility.References
- Ajhar et al. (2001) Ajhar, E. A., Tonry, J. L., Blakeslee, J. P., Riess, A. G., & Schmidt, B. P. 2001, ApJ, 559, 584
- Barbon et al. (1989) Barbon, R., Cappellaro, E., & Turatto, M. 1989, A&AS, 81, 421
- Bernardi et al. (1998) Bernardi, M., Renzini, A., da Costa, L. N., et al. 1998, ApJ, 508, L143
- Bertin & Arnouts (1996) Bertin, E. & Arnouts, S. 1996, A&AS, 117, 393
- Bertola (1964) Bertola, F. 1964, AJ, 69, 236
- Bertola et al. (1980) Bertola, F., Capaccioli, M., Holm, A. V., & Oke, J. B. 1980, ApJ, 237, L65
- Biscardi et al. (2008) Biscardi, I., Raimondo, G., Cantiello, M., & Brocato, E. 2008, ApJ, 678, 168
- Blakeslee et al. (2010) Blakeslee, J. P., Cantiello, M., Mei, S., et al. 2010, ApJ, 724, 657
- Blakeslee et al. (2009) Blakeslee, J. P., Jordán, A., Mei, S., et al. 2009, ApJ, 694, 556
- Blakeslee et al. (2001) Blakeslee, J. P., Vazdekis, A., & Ajhar, E. A. 2001, MNRAS, 320, 193
- Brocato et al. (1998) Brocato, E., Capaccioli, M., & Condelli, M. 1998, Memorie della Societa Astronomica Italiana, 69, 155
- Brocato et al. (2000) Brocato, E., Castellani, V., Poli, F. M., & Raimondo, G. 2000, A&AS, 146, 91
- Brocato et al. (1990) Brocato, E., Matteucci, F., Mazzitelli, I., & Tornambe, A. 1990, ApJ, 349, 458
- Brown et al. (2000) Brown, T. M., Bowers, C. W., Kimble, R. A., Sweigart, A. V., & Ferguson, H. C. 2000, ApJ, 532, 308
- Brown et al. (2008) Brown, T. M., Smith, E., Ferguson, H. C., et al. 2008, ApJ, 682, 319
- Buzzoni (1993) Buzzoni, A. 1993, A&A, 275, 433
- Buzzoni & González-Lópezlira (2008) Buzzoni, A. & González-Lópezlira, R. A. 2008, ApJ, 686, 1007
- Cantiello et al. (2007a) Cantiello, M., Blakeslee, J., Raimondo, G., Brocato, E., & Capaccioli, M. 2007a, ApJ, 668, 130
- Cantiello et al. (2005) Cantiello, M., Blakeslee, J. P., Raimondo, G., et al. 2005, ApJ, 634, 239
- Cantiello et al. (2007b) Cantiello, M., Raimondo, G., Blakeslee, J. P., Brocato, E., & Capaccioli, M. 2007b, ApJ, 662, 940
- Cantiello et al. (2009) Cantiello, M., Raimondo, G., Brocato, E., & Biscardi, I. 2009, MemSAIt, 80, 40
- Cantiello et al. (2003) Cantiello, M., Raimondo, G., Brocato, E., & Capaccioli, M. 2003, AJ, 125, 2783
- Code et al. (1972) Code, A. D., Welch, G. A., & Page, T. L. 1972, in NASA Special Publication, Vol. 310, Scientific results from the orbiting astronomical observatory (OAO-2), ed. A. D. Code, 559
- Côté et al. (2004) Côté, P., Blakeslee, J. P., Ferrarese, L., et al. 2004, ApJS, 153, 223
- Folatelli et al. (2010) Folatelli, G., Phillips, M. M., Burns, C. R., et al. 2010, AJ, 139, 120
- Freedman et al. (2001) Freedman, W. L., Madore, B. F., Gibson, B. K., et al. 2001, ApJ, 553, 47
- Gallagher et al. (2005) Gallagher, J. S., Garnavich, P. M., Berlind, P., et al. 2005, ApJ, 634, 210
- Gallagher et al. (2008) Gallagher, J. S., Garnavich, P. M., Caldwell, N., et al. 2008, ApJ, 685, 752
- González et al. (2004) González, R. A., Liu, M. C., & Bruzual A., G. 2004, ApJ, 611, 270
- Hamuy et al. (1996) Hamuy, M., Phillips, M. M., Suntzeff, N. B., et al. 1996, AJ, 112, 2391
- Han (2008) Han, Z. 2008, A&A, 484, L31
- Howell (2001) Howell, D. A. 2001, ApJ, 554, L193
- Idiart et al. (2002) Idiart, T. P., Michard, R., & de Freitas Pacheco, J. A. 2002, A&A, 383, 30
- Idiart et al. (2007) Idiart, T. P., Silk, J., & de Freitas Pacheco, J. A. 2007, MNRAS, 381, 1711
- Jensen et al. (2003) Jensen, J. B., Tonry, J. L., Barris, B. J., et al. 2003, ApJ, 583, 712
- Jensen et al. (1998) Jensen, J. B., Tonry, J. L., & Luppino, G. A. 1998, ApJ, 505, 111
- Jensen et al. (2001) Jensen, J. B., Tonry, J. L., Thompson, R. I., et al. 2001, ApJ, 550, 503
- Jerjen et al. (2004) Jerjen, H., Binggeli, B., & Barazza, F. D. 2004, AJ, 127, 771
- Jerjen et al. (1998) Jerjen, H., Freeman, K. C., & Binggeli, B. 1998, AJ, 116, 2873
- Jerjen et al. (2000) Jerjen, H., Freeman, K. C., & Binggeli, B. 2000, AJ, 119, 166
- Jha et al. (2007) Jha, S., Riess, A. G., & Kirshner, R. P. 2007, ApJ, 659, 122
- Jordán (2004) Jordán, A. 2004, ApJ, 613, L117
- Kaviraj et al. (2007) Kaviraj, S., Sohn, S. T., O’Connell, R. W., et al. 2007, MNRAS, 377, 987
- Kobayashi (2004) Kobayashi, C. 2004, MNRAS, 347, 740
- Kosai et al. (1991) Kosai, H., Kushida, R., Kato, T., Filippenko, A., & Newberg, H. 1991, IAU Circ., 5400, 1
- Kuntschner et al. (2001) Kuntschner, H., Lucey, J. R., Smith, R. J., Hudson, M. J., & Davies, R. L. 2001, MNRAS, 323, 615
- Landolt (1992) Landolt, A. U. 1992, AJ, 104, 340
- Lanoix (1998) Lanoix, P. 1998, A&A, 331, 421
- Leibundgut et al. (1991) Leibundgut, B., Tammann, G. A., Cadonau, R., & Cerrito, D. 1991, A&AS, 89, 537
- Longo et al. (1991) Longo, G., Ceriello, A., & Capaccioli, M. 1991, A&AS, 90, 375
- Mei et al. (2007) Mei, S., Blakeslee, J. P., Côté, P., et al. 2007, ApJ, 655, 144
- Minkowski (1964) Minkowski, R. 1964, ARA&A, 2, 247
- Pahre & Mould (1994) Pahre, M. A. & Mould, J. R. 1994, ApJ, 433, 567
- Park & Lee (1997) Park, J. & Lee, Y. 1997, ApJ, 476, 28
- Phillips et al. (1999) Phillips, M. M., Lira, P., Suntzeff, N. B., et al. 1999, AJ, 118, 1766
- Press et al. (1992) Press, W. H., Teukolsky, S. A., Vetterling, W. T., & Flannery, B. P. 1992, Numerical recipes in FORTRAN. The art of scientific computing (Cambridge: University Press, —c1992, 2nd ed.)
- Raimondo (2009) Raimondo, G. 2009, ApJ, 700, 1247
- Raimondo et al. (2005) Raimondo, G., Brocato, E., Cantiello, M., & Capaccioli, M. 2005, AJ, 130, 2625
- Raimondo et al. (2011) Raimondo et al. 2011, in preparation
- Riess et al. (1998) Riess, A. G., Filippenko, A. V., Challis, P., et al. 1998, AJ, 116, 1009
- Schlegel et al. (1998) Schlegel, D. J., Finkbeiner, D. P., & Davis, M. 1998, ApJ, 500, 525
- Scott et al. (2009) Scott, N., Cappellari, M., Davies, R. L., et al. 2009, MNRAS, 398, 1835
- Sersic (1968) Sersic, J. L. 1968, Atlas de galaxias australes (Cordoba, Argentina: Observatorio Astronomico, 1968)
- Shopbell et al. (1993) Shopbell, P. L., Bland-Hawthorn, J., & Malin, D. F. 1993, AJ, 106, 1344
- Sirianni et al. (2005) Sirianni, M., Jee, M. J., Benítez, N., et al. 2005, PASP, 117, 1049
- Sodemann & Thomsen (1996) Sodemann, M. & Thomsen, B. 1996, AJ, 111, 208
- Tonry & Schneider (1988) Tonry, J. & Schneider, D. P. 1988, AJ, 96, 807
- Tonry et al. (1990) Tonry, J. L., Ajhar, E. A., & Luppino, G. A. 1990, AJ, 100, 1416
- Tonry et al. (2000) Tonry, J. L., Blakeslee, J. P., Ajhar, E. A., & Dressler, A. 2000, ApJ, 530, 625
- Tonry et al. (2001) Tonry, J. L., Dressler, A., Blakeslee, J. P., et al. 2001, ApJ, 546, 681
- Turatto et al. (1996) Turatto, M., Benetti, S., Cappellaro, E., et al. 1996, MNRAS, 283, 1
- Wang et al. (2006) Wang, X., Wang, L., Pain, R., Zhou, X., & Li, Z. 2006, ApJ, 645, 488
- Worthey (1993a) Worthey, G. 1993a, ApJ, 415, L91+
- Worthey (1993b) Worthey, G. 1993b, ApJ, 409, 530
- Worthey (1994) Worthey, G. 1994, ApJS, 95, 107
- Zwicky (1942) Zwicky, F. 1942, ApJ, 96, 28