Raman signature of electron-electron correlation in chemically doped few-layer graphene
Abstract
We report an experimental Raman study of few-layer graphene after chemical doping achieved by a plasma process in CHF3 gas. A systematic reduction of both the splitting and the area of the band is observed with increasing the doping level. Both effects can be ascribed to the electron-electron correlation, which on the one hand reduces the electron-phonon coupling strength, and on the other hand affects the probability of the double resonant Raman process.
Since the possibility to isolate and identify graphene atomic layers has been experimentally demonstrated, Novoselov2005 the direct observation of many peculiar physical phenomena (e.g. the half-integer quantum hall effect for Dirac fermions NovoselovKim2005 ) has become accessible by standard characterization techniques, such as charge transport measurements, vibrational spectroscopy, scanning probe spectroscopy. In particular Raman spectroscopy, which is a very powerful technique for studying graphene, able to easily discriminate monolayers from bilayers and trilayers, Ferrari2006 has unveiled many important features of the graphene system, such as Kohn anomalies in the phononic spectrum, Yan2007 ; Das2008 ; Mafra2009 and the failure of the adiabatic Born-Oppenheimer approximation in describing the electron-phonon coupling (EPC) for Brillouin-zone center optical phonons. Pisana2007 ; Lazzeri2006 Here we show that even the evolution of electron-electron correlation can be experimentally revealed in the Raman spectrum of multilayer graphene, with a doping-dependent hallmark in the band.
The band arises from a double resonant Raman process, where the intervalley scattering of two electrons is accompanied by the emission of two phonons with opposite momentum (around the K point of the Brillouin zone). Ferrari2006 Therefore, such a Raman process is very sensitive to the electronic bands, which determine all the possible initial and final states for the electrons involved in the intervalley scattering, allowing to monitor the evolution of the electronic band structure with the number of stacked graphene layers (from monolayer to bilayer to few-layer). Very recently, it was shown that even the change in the band structure due to a different stacking order can be captured in the Raman band of few-layer graphene. Lui2011
Moreover, the Raman spectrum of graphene is affected by EPC, which, for optical phonons near the point, shows up in the dispersive behavior of the and band. Indeed, the dependence of the Raman band on the excitation energy is proportional to the slope of the phononic band near , which is determined by the EPC strength. Piscanec2004 In such a scenario, the electron-electron interactions play an important role, giving a major contribution to the dispersion of the highest optical phonon branch near in neutral graphene. Lazzeri2008 In fact, the experimental phonon slope can be theoretically reproduced by ab initio calculations only within the approach, where nonlocal exchange-correlation effects are included. Recently, Attaccalite et al. Attaccalite2010 theoretically showed that the deformation potential (i.e. the EPC strength) for optical phonos near is strongly affected by the charge carriers density in graphene, due to electron-electron correlation effects, so that the and Raman bands should reflect such a doping dependence.
We carried out an experimental study of chemically-doped few-layer graphene, monitoring the Raman band as a function of the doping level. Graphene was mechanically exfoliated from natural graphite and deposited on 285 nm thick SiO2 on Si substrates. The number of stacked graphene layers in the deposited flakes was established by an optical contrast analysis, Bruna2009 using an optical microscope and appropriate bandpass filters, so that up to 7 stacked layers were clearly distinguished. Bruna2010 Then, chemical doping was performed by a radio frequency (RF) plasma process in CHF3 gas, at RF power of 15 W and gas pressure of 100 mTorr. We have shown elsewhere Bruna2010 that, at such experimental conditions, a high p-type doping of graphene can be achieved, due to the adsorption of fluorine atoms at the graphene surface. Moreover, no structural modification of the graphene lattice occurs, as indicated by the absence of the Raman peak. Raman spectra were acquired by means of a Jobin-Yvon U1000 Raman spectrometer equipped with a microscope (100X objective) and with an Ar-Kr laser, using the excitation wavelength nm. The incident laser power focused on the sample was adjusted to be less than 5 mW, in order to avoid any local heating effect.
In Fig. 1 the change induced by chemical doping in the 2D band of N-layer graphene (N=1-6) is reported. The spectra were taken on the same substrate, before and after the plasma treatment. The result was checked on different flakes on the same substrate and on different substrates.
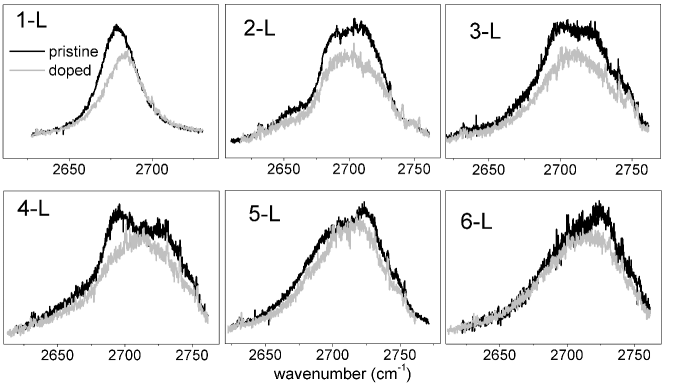
On the one hand, as expected for high p-type doping, the monolayer spectrum is blue-shifted, consistently with the literature. Das2008 On the other hand, all the few-layer spectra display a common feature, i.e. a systematic reduction of the band splitting, which was theoretically predicted by Attaccalite et al. Attaccalite2010 by taking into account electron-electron correlation effects in the calculation of the deformation potential as a function of doping. Indeed, the band splitting in multilayer graphene is directly related to the slope of the highest optical phonon branch near K, i.e. to the EPC strength, which is tuned by the charge carrier density. In our experiments we always observed that the sub-peaks composing the few-layer band tend to shrink toward a single spectral position at high doping levels, indicating a strong decrease of the phonon energy dispersion. Moreover, even the band area seems to be systematically decreased by the chemical doping, as already reported for monolayer graphene. Das2008 ; Basko2009
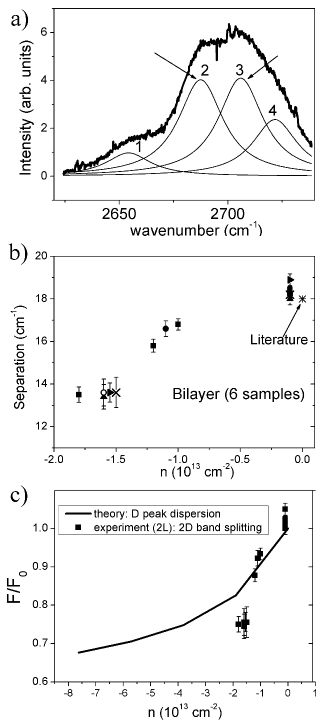
In order to confirm these qualitative observations, we have analyzed in detail the evolution of the bilayer band with the doping level. In fact, in the bilayer case the band is described by the convolution of four lorentzian peaks, corresponding to the four possible resonant processes giving rise to the Raman signal, and among the four peaks, two of them (labeled as 2 and 3 in Fig. 2a) are known to be prominent. Ferrari2006
Therefore, we have fitted the bilayer spectra by four lorentzian peaks with FWHM fixed at 25 cm-1 (typical width of the single peak of monolayer graphene), Malard2007 and we have analyzed the evolution of the two most intense peaks with the doping level. The peaks width was assumed to be unaffected by the doping, on the basis of the observation of the monolayer 2D peak width, which did not display any significant variation after the plasma treatment.
As shown in Ref. Bruna2010 , the modification induced by the plasma treatment was not stable under ambient conditions, and the Raman spectra changed with the passing of time, slowly tending to their pristine form. Therefore, we were able to gradually vary the doping level on top of the graphene flakes, monitoring the Raman spectrum as a function of doping. Moreover, we could estimate the carrier density by means of the analysis of the band splitting carried out in Ref. Bruna2010 , in order to plot the peaks position as a function of the doping level. Indeed, the bilayer band is splitted in two peaks by heavy top-layer doping, and the behavior as function of the carrier density can be fitted by the thoretical curves given in Ref. Gava2009 , yielding to an estimate of the doping level in the experiment.
In Fig. 2b the reduction of the spectral separation of peaks 2 and 3 with increasing the doping level can be clearly appreciated. The reported data were obtained by fitting the band of six bilayer samples, and error bars were estimated by propagating the peaks position standard deviations given by the fitting procedure. A typical peaks separation value reported in the literature Malard2007 is also shown as a reference in Fig. 2b. The robustness of the fit results was checked by repeating the fitting procedure with the FWHM as a free parameter (i.e. not fixed at the value of 25 cm-1), in order to take into account possible variations of the peaks width with the doping. Although a higher uncertainty for the peaks separation values was obtained in this case, a splitting reduction of about the same magnitude could still be clearly appreciated, confirming the results reliability.
The consistence of this observation with theory Attaccalite2010 was checked by comparing the experimental peaks separation (normalized by the value reported in the literature for the undoped case) to the theoretically predicted peak dispersion slope (normalized by the its value at zero doping). Indeed, since the band splitting is proportional to the peak dispersion, the relative variation of the two quantities is expected to be the same. In Fig. 2c the direct comparison of the two curves is reported (where F is either the experimental peaks separation or the theoretical peak dispersion slope, and F0 the corresponding value at zero doping), suggesting a qualitative agreement between theory and experiment. More experiments carried out within a broader range of carrier density would be necessary to definitely quantify the doping effect on the band splitting. However, the chemical doping approach here reported gives rise to a high carrier density ( cm-2) which cannot be reached in standard field effect experiments. In order to further increase the doping level, an electrochemical gating approach should be employed, Das2008 whose experimental realization is more challenging.
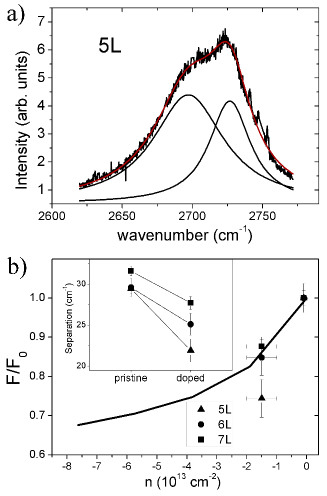
Moreover, an analogous study was carried out on 5-layer, 6-layer and 7-layer graphene samples, in order to corroborate the results of the bilayer analysis. Indeed, with increasing the number of stacked layers, the few-layer graphene Raman spectrum approaches the bulk graphite spectrum, where the 2D band is well fitted by two lorentzian peaks. In Fig. 3 the results of fitting the experimental spectra by two lorentzian peaks with variable FWHM are reported, and the evolution of the peaks separation with increasing the doping level is plotted, showing a clear reduction as in the bilayer case. The magnitude of the effect is comparable to the bilayer case, and of the same order of the theoretical prediction. Horizontal error bars are due to the uncertainty of the doping value, because in this case it was not possible to exploit the band analysis to extract the carrier density as in the bilayer case. However, basing on the values obtained for monolayers and bilayers, it is likely that the doping value immediately after plasma treatment ranges between and cm-2 for every few-layer graphene.
Furthermore, the area of the band was analyzed as well, in order to study its dependence on chemical doping. For monolayer graphene, it has been shown that the band intensity is decreased by doping, Das2008 ; Basko2009 due to electron-electron scattering processes which affect the resonant Raman process. Thus, we have performed the same analysis of Ref. Basko2009 on the band of few-layer graphene, using the area of a monolayer band (measured on the same substrate and in the same experimental conditions) as a normalization factor, in order to neglect spurious experimental contributions to the measured intensity variation. Indeed, the band area is almost unaffected by doping in monolayer graphene as far as the Fermi level eV, Basko2009 whereas in the bilayer case it can display strong modifications due to inversion symmetry breaking. Bruna2010 ; Malard2008 ; Yan2009 ; Zhao2010 ; Ando2009
Fig. 4 shows an evident systematic reduction of all the considered areas, with a decrease of about for the bilayer peaks with an estimated doping level of less than cm-2.
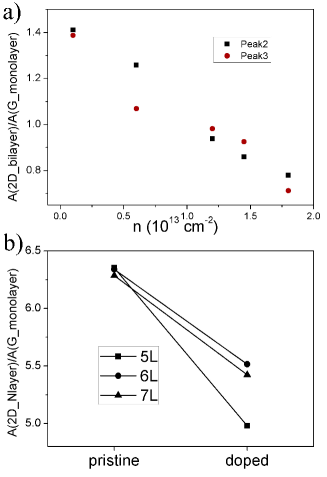
Such a result strongly suggests that the probability of the Raman process involving optical phonons near in few-layer graphene is reduced by the onset of doping-induced electron-electron scattering processes, in analogy with the monolayer case.
In summary, we have experimentally observed the reduction of both the splitting and the area of the Raman band with increasing the doping level in N-layer graphene, for N ranging from 2 to 7. The analysis carried out on various few-layer graphene samples confirms that such a behavior can be ascribed to the electron-electron correlation, which reduces the EPC strength for optical phonons near the point and the probability of the associated Raman process. Therefore, we have reported a clear signature of the electron-electron interactions in multilayer graphene, and shown an experimental evidence of the EPC tuning which can be easily achieved by a simple chemical doping method.
References
- (1) K. S. Novoselov, D. Jiang, F. Schedin, T. J. Booth, V. V. Khotkevich, S. V. Morozov, and A. K. Geim, Proc. Natl. Acad. Sci. U.S.A. 102, 10451 (2005).
- (2) K. S. Novoselov, A. K. Geim, S. V. Morozov, D. Jiang, M. I. Katsnelson, I. V. Grigorieva, S. V. Dubonos, and A. A. Firsov, Nature 438, 197 (2005); Y. Zhang, Y. W. Tang, H. L. Stormer, P. Kim, Nature 438, 201 (2005).
- (3) A. C. Ferrari J. C. Meyer, C. Casiraghi, M. Lazzeri, F. Mauri, S. Piscanec, D. Jiang, K. S. Novoselov, S. Roth, and A. K. Geim, Phys. Rev. Lett. 97, 187401 (2006).
- (4) J. Yan, Y. Zhang, P. Kim, and A. Pinczuk, Phys. Rev. Lett. 98, 166802 (2007).
- (5) A. Das S. Pisana, B. Chakraborty, S. Piscanec, S. K. Saha, U. V. Waghmare, K. S. Novoselov, H. N. Krishnamurthy, A. K. Geim, A. C. Ferrari and A. K. Soo, Nat. Nanotechnol. 3, 210 (2008).
- (6) D. L. Mafra, L. M. Malard, S. K. Doorn, H. Htoon, J. Nilsson, A. H. Castro Neto, and M. A. Pimenta, Phys. Rev. B 80, 241414(R) (2009).
- (7) S. Pisana, M. Lazzeri, C. Casiraghi, K. S. Novoselov, A. K. Geim, A. C. Ferrari, and F. Mauri, Nature Mater. 6, 198 (2007).
- (8) M. Lazzeri, and F. Mauri, Phys. Rev. Lett. 97, 266407 (2006).
- (9) C. H. Lui, Z. Li, Z. Chen, P. V. Klimov, L. E. Brus, and T. F. Heinz, Nano Lett. 11, 164 (2011).
- (10) S. Piscanec, M. Lazzeri, F. Mauri, A. C. Ferrari, and J. Robertson, Phys. Rev. Lett. 93, 185503 (2004).
- (11) M. Lazzeri, C. Attaccalite, L. Wirtz, and F. Mauri, Phys. Rev. B 78, 081406(R) (2008).
- (12) C. Attaccalite, L. Wirtz, M. Lazzeri, F. Mauri and A. Rubio, Nano Lett. 10, 1172 (2010).
- (13) M. Bruna, and S. Borini, J. Phys. D: Appl. Phys. 42, 175307 (2009).
- (14) M. Bruna, and S. Borini, Phys. Rev. B 81, 125421 (2010).
- (15) D. M. Basko, S. Piscanec, and A. C. Ferrari, Phys. Rev. B 80, 165413 (2009).
- (16) L. M. Malard, J. Nilsson, D. C. Elias, J. C. Brant, F. Plentz, E. S. Alves, A. H. Castro Neto, and M. A. Pimenta, Phys. Rev. B 76, 201401(R) (2007).
- (17) P. Gava, M. Lazzeri, A. M. Saitta, and F. Mauri, Phys. Rev. B 80, 155422 (2009).
- (18) L. M. Malard, D. C. Elias, E. S. Alves, and M. A. Pimenta, Phys. Rev. Lett. 101, 257401 (2008).
- (19) J. Yan, T. Villarson, E. A. Henriksen, P. Kim, and A. Pinczuk, Phys. Rev. B 80, 241417(R) (2009).
- (20) W. Zhao, P. Tan, J. Zhang, and J. Liu, Phys. Rev. B 82, 245423 (2010).
- (21) T. Ando, and M. Koshino, J. Phys. Soc. Jpn. 78, 034709 (2009).