Reciprocity Failure in HgCdTe Detectors: Measurements and Mitigation
Abstract
A detailed study of reciprocity failure in four 1.7 m cutoff HgCdTe near-infrared detectors is presented. The sensitivity to reciprocity failure is approximately 0.1 % decade-1 over up to five orders of magnitude in illumination intensity. The four detectors, which represent three successive production runs with modified growth recipes, show large differences in amount and spatial structure of reciprocity failure. Reciprocity failure could be reduced to negligible levels by cooling the detectors to about 110 K. No wavelength dependence was observed. The observed spatial structure appears to be weakly correlated with image persistence.
1 Introduction
Nonlinearity in detector response can severely impact photometric precision in astronomical observations. Recent reports of count rate dependent nonlinearity observed in HgCdTe near-infrared (NIR) detectors (Bohlin et al., 2005; Riess, 2010; Hill et al., 2010; Deustua et al., 2010; Biesiadzinski et al., 2011) suggest that this effect is common in HgCdTe detectors, although so far only measurements with detectors from the HAWAII111HAWAII: HgCdTe Astronomy Wide Area Infrared Imager family produced by Rockwell Science Center, now Teledyne Imaging Sensors (TIS), have been reported. Count rate dependent nonlinearity is also referred to as flux dependent nonlinearity or as reciprocity failure. It describes the failure of a detector to respond linearly to changes in the incident flux. A power law of the form can be used to model the effect, where represents the amount of nonlinearity. Values for nonlinearity from less than 0.1 % decade-1 to about 10 % decade-1 have been reported. Reciprocity failure was first pointed out in HgCdTe detectors by Bohlin et al. (2005) for the 2.5 m cutoff Near Infrared Camera and Multi-Object Spectrometer (NICMOS) detectors. For the NICMOS detectors a nonlinearity of about 6 % decade-1 was reported based on a comparison of NICMOS and STIS (Space Telescope Imaging Spectrograph) standard star observations (Bohlin et al., 2005). Further evidence for reciprocity failure comes from measurements on 1.7 m cutoff detectors produced for the NIR channel of the Wide Field Camera 3 (WFC3), installed onboard the Hubble Space Telescope during the final servicing mission in 2009. These detectors show reciprocity failure between 0.3 % and 1 % in the wavelength range from 0.85 m to 1.0 m (Hill et al., 2010).
In all measured detectors this nonlinearity is such that for a constant fluence, a pixel’s response to a high flux is larger than its response to a low flux. This nonlinearity is different from the well-known and well-understood classical nonlinearity that is observed as charge is integrated at the junction capacitance of the pixel node. The physical mechanism that leads to reciprocity failure however is not yet understood. Charge traps in the bulk material have been suggested as the cause for image persistence (Smith et al., 2008), and it is conceivable that a mechanism based on charge trapping is also responsible for reciprocity failure. Alternatively, this nonlinearity could originate in the HAWAII multiplexer, or it may be caused by small leakage currents at the charge integrating transistors.
2 Instrument and Operation
A dedicated test system was designed and built to precisely characterize reciprocity failure in HgCdTe detectors over their full spectral and dynamic range. A sensitivity to reciprocity failure of approximately 0.1 % was achieved for flux levels between 1 and 50,000 photons s-1 and exposure times of 5 seconds to 5 hours. A detailed description of this setup can be found in Biesiadzinski et al. (2011). In the following only a brief outline of the experimental method is presented followed by a discussion of experimental uncertainty in the linearity measurement and the readout strategy.
To quantify reciprocity failure, the HgCdTe detector response was measured and compared to the response of a monitoring photodiode while the illumination intensity was varied. The detector was repeatedly read out in what is referred to as sample-up-the-ramp mode (SUR). The analysis of the detector response at different charge integration levels allows for the removal of the classical gain non-linearity (Biesiadzinski et al., 2011). For this measurement the detector dark current, typically on the order of 0.05 e/sec/pixel, was taken into account.222Any background illumination, including thermal leakage, was smaller than the dark current level and was treated as a part of the dark current.
In order to obtain an absolute measurement of reciprocity failure, knowledge of the linearity of the monitoring photodiodes over the full illumination level used during the investigation was required. Good spectral coverage was achieved by using two monitoring diodes, a Si photodiode for measurements up to 1.0 m and an InGaAs photodiode for measurements up to 1.8 m. Precise linearity characterization of the diodes was not available from the vendor. Thus linearity of the Si photodiode (Edmund Optics 53371) was measured independently in a dedicated setup (Biesiadzinski et al., 2011). The Si photodiode illumination intensity nonlinearity was measured to be (0.08 0.08) % decade-1 consistent with zero. Along with the comparison of Si and InGaAs photodiode responses, this established a 0.1% decade-1 systematic uncertainty in our test setup.
The reciprocity characterization setup operates shutter-less and therefore the shortest exposure time is determined by the time it takes to read out the detector. This limits the dynamic range of observable photon intensities. To extend this range towards higher photon fluxes the majority of the characterization was performed in a mode in which only part of the detector was read out. This readout mode is referred to as stripe mode. In this mode only an area of 300 2048 pixels was read out to reduce the readout time from the 1.418 seconds it takes to read the full detector (2048 2048 pixels) to 0.210 seconds.
A fraction of the measurements was performed where the full detector was read out to probe possible spatial variation in reciprocity failure across a detector. This readout mode is referred to as full mode. The spatial resolution was sampled by subdividing the detector into tiles of 64 64 pixels in the full mode and 60 64 pixels in the stripe mode. This tiling reduces the uncertainty in the measurement due to photon shot noise and read noise.
3 Measurements and Results
The SuperNova / Acceleration Probe (SNAP) was proposed as a satellite mission to explore the nature of dark energy (Aldering et al., 2002). SNAP evolved into JDEM, the Joint Dark Energy Mission. As part of the R&D effort for SNAP/ JDEM a number of near-infrared detectors were procured and characterized. The SNAP science specifications, challenging vendor capabilities at the onset of the program, could ultimately be met and several devices with low read noise and very good quantum efficiency (QE) were delivered (Schubnell et al., 2006). In the course of several production runs the HgCdTe growth and detector manufacturing processes were tuned to improve performance. The detector growth recipe was originally largely based on the experience gained with devices produced for WFC3. The WFC3 baseline process was extended to a 2048 2048 format with an emphasis on reducing read noise while maintaining good quantum efficiency. This development ran parallel to the SNAP effort and both projects aimed to improve detector quantum efficiency and achieve low read noise and dark current. Initially, the improvement of those detector characteristics was driving development efforts, but later fabrication runs also included substrate removal and reduction of capacitive coupling between pixels. For the investigation presented here, four SNAP/ JDEM devices, representing three generations of development, were tested in the University of Michigan reciprocity characterization system. All four detectors were produced by TIS and all have 2048 2048 pixels with a pixel pitch of 18 m. They are HgCdTe detectors with a high wavelength cutoff at 1.7 m hybridized to a HAWAII-2 readout integrated circuit. Substrate removal and anti-reflective coating provide good response extending from the UV to the near-infrared. Detector characterization was initially performed at a single temperature (140 K) followed by measurements at several wavelengths to test a possible wavelength dependence of reciprocity failure. In later measurements the temperature was also varied to investigate temperature dependence. In section 3.1 the results from measurements on each of the four detectors at 140 K are discussed. In section 3.2 it is shown how reciprocity failure can be mitigated by lowering the device temperature. An overview of all measurements can be found in Tables 4 and 5. Note that the quoted uncertainties are statistical only and do not include the overall 0.1% systematic uncertainty.
3.1 Measurements at 140 K
3.1.1 H2RG-102
Device H2RG-102 was manufactured early on during the SNAP/JDEM R&D program and was delivered in 2005. The QE is greater than 90% from 0.9 m to 1.7 m and about 40% at 0.45 m. The dark current and read noise performance is very good; the Fowler-1 noise is 25 e-. Unlike devices produced later, this detector is mounted on a molybdenum pedestal. The multiplexer is of type HAWAII-2RG-A0.
Characterization of reciprocity failure in detector H2RG-102 was described in detail in Biesiadzinski et al. (2011). This detector exhibits low reciprocity failure () % decade-1 at 790 nm and shows no wavelength dependence.
3.1.2 H2RG-142
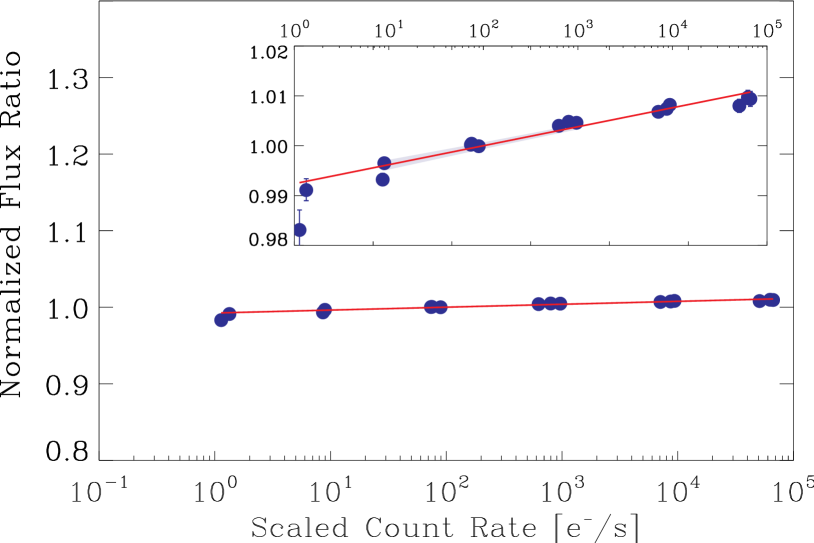
Device H2RG-142 came from the fifth manufacturing run for SNAP. It was mounted on a SiC pedestal specifically developed for SNAP/JDEM to provide a good thermal match to the multiplexer. Devices from this run were also mated to the HAWAII-2RG-A0 multiplexer. H2RG-142 has high QE and low read noise. It exhibits a somewhat larger number of hot pixels than H2RG-102 but is otherwise cosmetically good. Figure 8 shows reciprocity failure of () % decade-1 at 790 nm in stripe mode. The average reciprocity failure value measured for this device was very similar to detector H2RG-102 at all wavelengths.
In addition to the stripe mode measurements the structure of reciprocity failure was also characterized in the full mode. Although the signal to noise ratio was low, nonlinearity variations in the detector did appear in a range from 0.35 to 0.85 % decade-1. In particular one corner of the device exhibited larger reciprocity failure.
3.1.3 H2RG-236 and H2RG-238
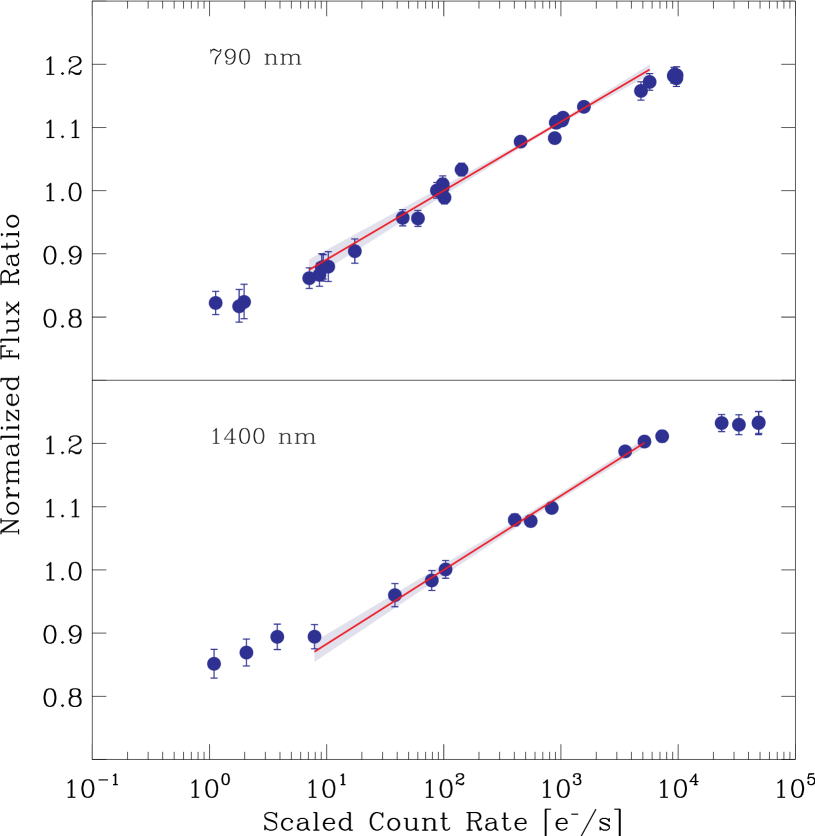
Devices H2RG-236 and H2RG-238 were produced during the sixth manufacturing run of the SNAP /JDEM R&D program. Like device H2RG-142 they both are mounted on a SiC pedestal but unlike that device, they were hybridized to a newer multiplexer, the HAWAII-2RG-A1 designed in part to reduce capacitive coupling between neighboring pixels (Brown et al., 2006). Both devices have low dark current and read noise and are very good cosmetically. Quantum efficiency of both devices is lower than in earlier detectors but is exceptionally uniform when measured at high flux. The average reciprocity failure measured in stripe mode for device H2RG-236, shown in Figure 9, is () % decade-1 and () % decade-1 at 790 nm and 1400 nm, respectively. The results from the two measurements are very similar, emphasizing the insensitivity of reciprocity failure to the wavelength of the illumination for these detectors. Data taken at 1400 nm and 950 nm (not shown in Figure 9) revealed that a linear fit is only representative for illumination levels between roughly 10 counts s-1 and 10,000 counts s-1. Outside this range the detector response appears to become linear, indicating a saturation effect at high illumination levels and possibly a turn-on threshold at low illumination levels. Detector H2RG-236 showed the largest reciprocity failure of the four devices measured.
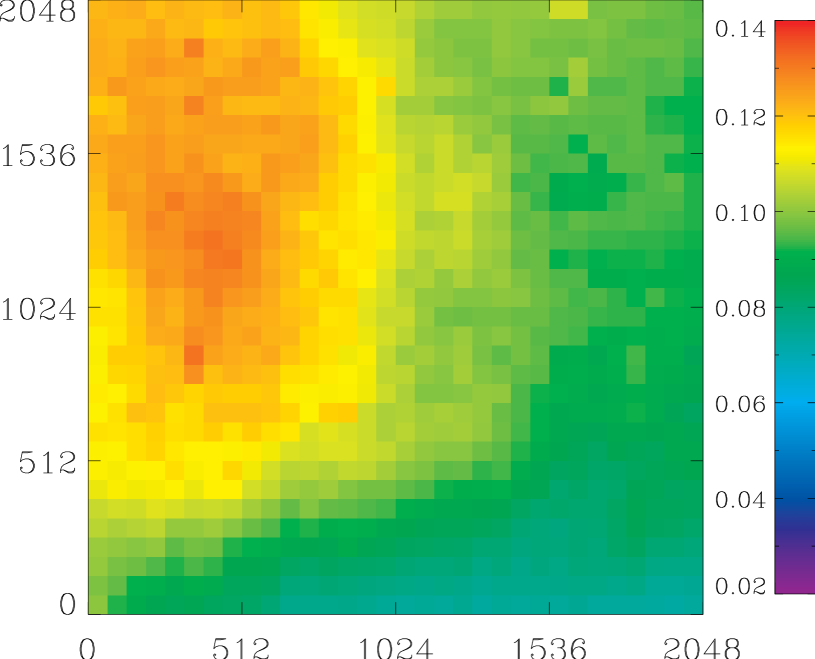
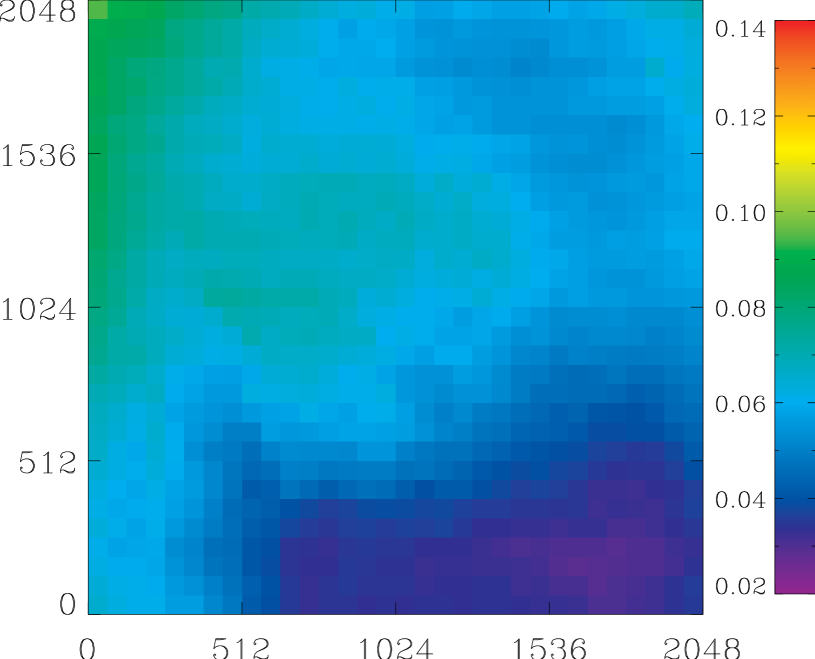
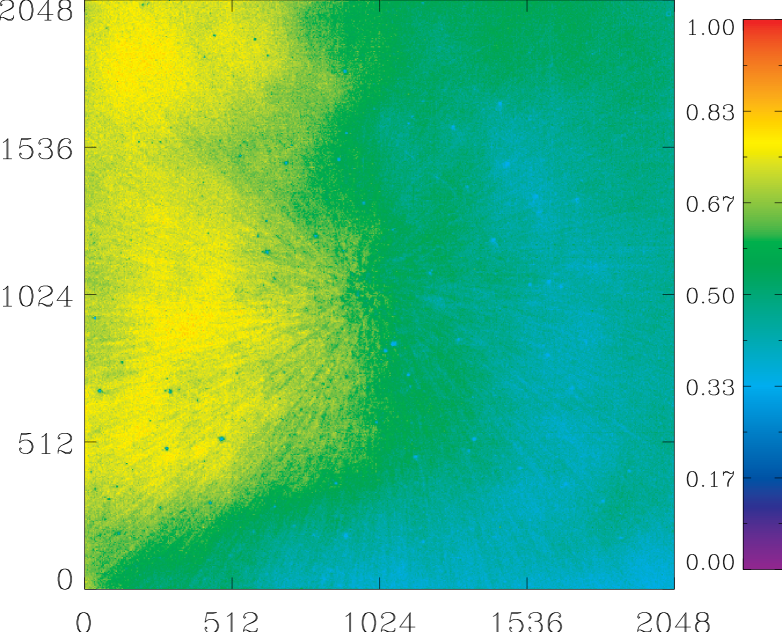
Strong spatial variation of reciprocity failure was observed in these two devices, ranging from 7.3 % decade-1 to 13.1 % decade-1 for device H2RG-236 (Figure 10) and from 2.9 % decade-1 to 9.5 % decade-1 for device H2RG-238 (Figure 11). It is worth noting that for such a device, simply correcting for the average reciprocity failure without accounting for spatial structure will result in a large residual uncertainty in photometric measurements.
| Wave- | Reciprocity Failure | ||
| Detector | length | Stripe Mode | Full Mode |
| [nm] | [% decade-1] | ||
| H2RG-102aaPublished in Biesiadzinski et al. (2011). | 700 | 0.35 0.04 | |
| 790 | 0.35 0.03 | ||
| 880 | 0.36 0.05 | ||
| 950 | 0.29 0.04 | ||
| 1400 | 0.38 0.05 | ||
| H2RG-142 | 790 | 0.38 0.03 | 0.53 0.14 |
| 950 | 0.48 0.07 | ||
| 1400 | 0.33 0.04 | ||
| H2RG-236 | 790 | 10.9 0.5 | 10.3 0.6 |
| 950 | 11.9 0.5 | ||
| 1400 | 11.7 0.5 | 10.6 1.9 | |
| H2RG-238 | 790 | 5.1 0.7bb Full mode data analyzed as stripe mode. | 4.0 0.8 |
| 950 | 4.4 0.4 | ||
3.2 Temperature Dependence
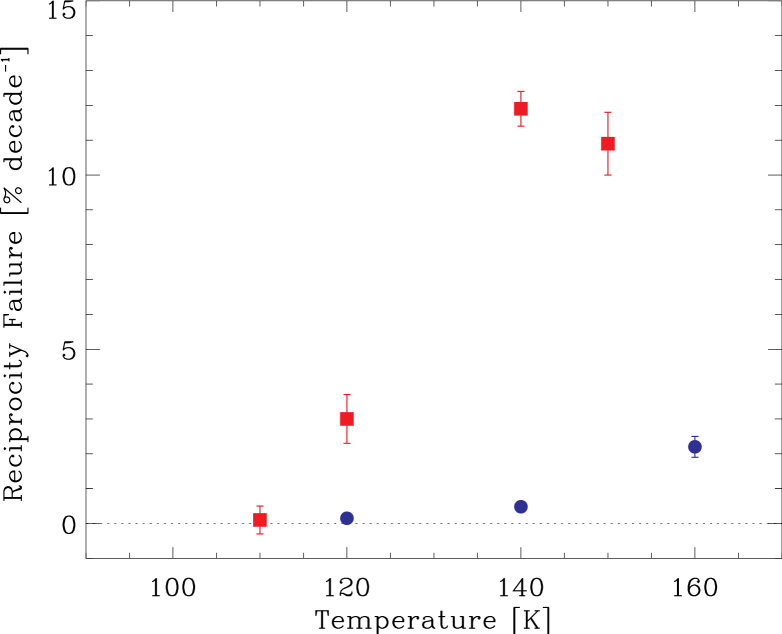
In an attempt to better understand the physical mechanisms that lead to reciprocity failure, it was investigated how reciprocity failure is affected by device temperature. Detectors H2RG-142 and H2RG-236, low and high reciprocity devices, respectively, were tested at temperatures ranging from 100 K to 160 K. These tests revealed that flux dependent nonlinearity can be “frozen out” at sufficiently low temperatures. The results from the two detectors, shown in Figure 12, suggest that this freeze-out temperature depends on the amount of reciprocity failure in a particular detector and will therefore most likely vary for different detectors. An overview of the temperature test results is presented in Table 5.
| Temperature | Reciprocity Failure | |
|---|---|---|
| [K] | [% decade-1] | |
| H2RG-142 | H2RG-236 | |
| 160 | 2.2 0.3 | |
| 150 | 10.9 0.9 | |
| 140 | 0.48 0.07 | 11.9 0.5 |
| 120 | 0.15 0.07 | 3.0 0.7 |
| 100 | 0.1 0.4 | |
3.3 Reciprocity Failure and QE
For detectors that exhibit reciprocity failure, care must be taken when measuring quantum efficiency. Reciprocity failure will bias QE measurements towards higher values at high illumination levels and towards lower QE values at low illumination levels. In addition, spatial nonuniformity of reciprocity failure across a detector will alter the apparent device uniformity as a function of the illumination intensity. One possible approach is to measure QE at sufficiently low temperature to suppress reciprocity failure in order to reveal the “true” QE.
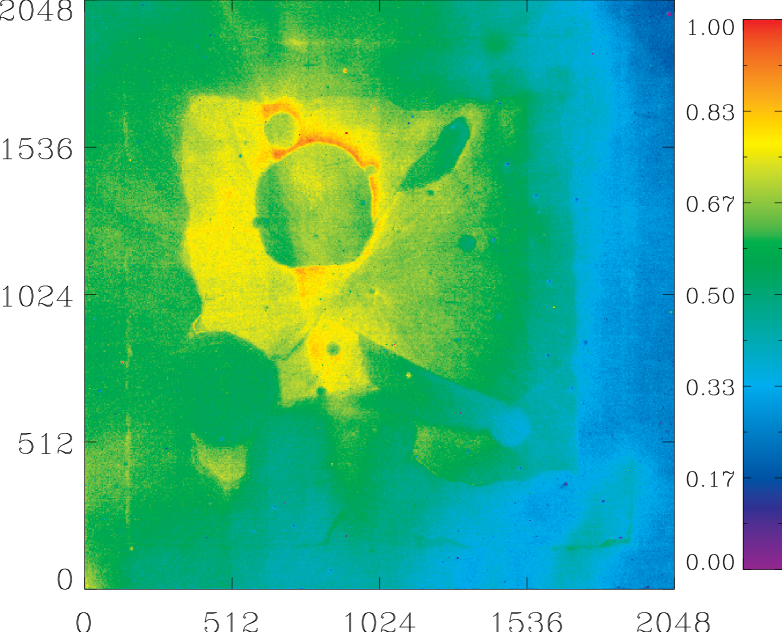
Precise characterization of reciprocity failure is a rather elaborate procedure and requires a specialized experimental setup. However, a simple measurement can reveal possible spatial structure in a detector’s reciprocity failure. Using a standard flat field illumination test setup two flat field images were produced, one at a very high illumination intensity and a second at a very low illumination intensity. The ratio of these two images, shown in Figure 13, displays the same spatial variability as the reciprocity failure map for this detector shown in Figure 10. Such a measurement may therefore be used as a simple test that does not require any special equipment beyond a basic illumination system. However, some caveats apply. This test will only reveal spatial structure in reciprocity failure of a device, and will not produce an absolute value for the strength of reciprocity failure, nor will it reveal reciprocity failure in detectors where the effect is spatially uniform.
4 Discussion
Although a detector’s reciprocity failure can be large, it will likely be possible to correct for it. If a sufficient amount of calibration data is obtained it should be possible to correct for reciprocity failure on a pixel by pixel level. Cooling detectors that exhibit strong reciprocity failure provides a straightforward mitigation strategy although the required temperature may vary for individual devices. While, for example, detector H2RG-142 will likely not exhibit noticeable reciprocity failure at 120 K, device H2RG-236 would have to be cooled below 100 K.
The observed spatial nonuniformity in reciprocity failure provides an opportunity to investigate a possible correlation with other detector properties such as dark current, QE near cutoff 333In all HgCdTe devices that were tested, strong QE variations are observed near the cutoff wavelength. This is caused by inconsistencies in the doping of the HgCdTe material by the MBE process., and image persistence. Therefore the cross correlation between the spatial structure of reciprocity failure and the other properties was computed for device H2RG-236. This particular detector was selected because of the pronounced spatial nonuniformity in reciprocity failure. The correlation coefficient was normalized to have a value between and for fully anti-correlated structure and identical structure, respectively. A value of zero represents the absence of correlation. Both, the 790 nm and the 1400 nm reciprocity failure data were used for this analysis as shown in Table 6. The correlation coefficient for the reciprocity failure maps at those two wavelengths is 0.92, indicating that not only the average reciprocity is independent of wavelength but also the spatial structure.
| 790 nm | 1400 nm | |
|---|---|---|
| Dark Current | -0.41 | -0.42 |
| QE at 1750 nm | 0.11 | 0.15 |
| Persistence | 0.70 | 0.57 |
| Conversion Gain | -0.09 | 0.00 |
The two detectors that show low reciprocity failure, H2RG-102 and H2RG-142, and the two detectors that show high reciprocity failure, H2RG-236 and H2RG-238, differ in the type of multiplexer used for device readout. The 100-series detectors were hybridized to the HAWAII-2RG-A0 multiplexer while for the 200-series the redesigned HAWAII-2RG-A1 multiplexer was used. It was investigated whether the change in the multiplexer design was responsible for the large discrepancy in reciprocity failure between the 100 and 200 series. For this test an external RC circuit with a large capacitance and a precisely measured selectable resistance was used. The RC circuit was charged, simulating charge collecting at the pixel node, and read out by the multiplexer. Using the RC circuit instead of the detector diode allowed to measure the linearity response of the multiplexer by varying the circuit’s impedance. The test was performed with the multiplexers of devices H2RG-142 and H2RG-238. No difference in multiplexer voltage readout linearity was observed, indicating that the difference in multiplexer readout electronics alone is not responsible for the observed difference in reciprocity failure.
At present the fundamental mechanism that leads to reciprocity failure is not understood. The comparison of spatial structures in characteristic maps discussed above does not provide a satisfactory suggestion of correlation between reciprocity failure and any other detector characteristic. In fact the only correlation that has been observed so far is that detectors with high reciprocity failure show also large image persistence, and detectors that show very low reciprocity failure tend to have low image persistence. Note that this observation is based on the very limited sample of detectors discussed here and may not be a general property of HgCdTe detectors. Small leakage currents due to Ohmic parasitic resistance across the integrating field effect transistor can be excluded as cause for reciprocity failure because they would not reproduce the observed power-law behavior. However, non-linear leakage currents, typical for diodes, may provide an explanation for this effect. Furthermore, a charge trapping mechanism has been suggested as the underlying mechanism for image persistence (Smith et al., 2008), and it is conceivable that such a process also accounts for reciprocity failure.
5 Conclusions
Reciprocity failure was measured in four devices developed as part of the SNAP/JDEM R&D program with an overall sensitivity of 0.1% per decade in illumination intensity. It was found to vary from device to device with detector-averaged values (in % decade-1 at 790 nm) of for H2RG-102, for H2RG-142, for H2RG-236 and for H2RG-236. In addition, spatial variation of reciprocity failure was observed in all three devices that were tested in the full readout mode. A wavelength dependence, such as reported for the NICMOS detectors, was not observed.
Reciprocity failure causes a systematic error in measurements of faint astronomical sources relative to bright standards. If not corrected for, an observation spanning three decades in illumination could suffer from a 1% (in low reciprocity devices) to 30% (in high reciprocity devices) error in the flux determination. Such a device would, if used for supernova cosmology for example, lead to an incorrect overestimate of the acceleration of the universe. In addition, this nonlinearity has to be accounted for when performing a standard detector characterization such as measuring QE. The value of QE and its spatial uniformity depends on the intensity of the light at which they are measured.
Because of the wide range of reciprocity failure from one detector to another and of its spatial structure, reciprocity failure calibration presents a challenge. Furthermore, it is currently unknown if on-orbit radiation damage may alter it. Without a fundamental understanding of the underlying mechanism, reciprocity failure is therefore best addressed by the selection of “low reciprocity failure” devices and by cooling them sufficiently.
References
- Aldering et al. (2002) Aldering, G. et al. 2002, Proc SPIE, 4835, 146
- Biesiadzinski et al. (2011) Biesiadzinski, T., Lorenzon, W., Newman, R., Schubnell, M., Tarlé, G., & Weaverdyck, C. 2011,PASP, 123, XX
- Bohlin et al. (2005) Bohlin, R., Lindler, D. & Riess, A. 2005, NICMOS Instrument Science Report 2005-002
- Brown et al. (2006) Brown, M., Schubnell, M., Tarlé, G. 2006, PASP, 118, 1443
- Deustua et al. (2010) Deustua, S., Long K. S., McCullough P., Riess A. G., MacKenty J., Kimble R., Baggett S. M., Hilbert B., Hill R. J.,Pavlovsky C., Petro L. D, and the WFC3 Team 2010, Proc. SPIE 7731, 77313C
- Hill et al. (2010) Hill R. J., Malumuth, E., Foltz, R., Kimble, R. A., Waczynski, A., Boehm, N., Wen, Y., Kan, E. and Collins, N. R. 2010, Proc. SPIE 7742, 774222
- Riess (2010) Riess, A. 2010, WFC3 Instrument Science Report 2010-07
- Schubnell et al. (2006) Schubnell, M., Barron, N., Bebek, C., Borysow, M., Brown, M. G., Cole, D., Figer, D., Lorenzon, W., Bower, C., Mostek, N., Mufson, S., Seshadri, S., Smith, R., Tarlé, G. 2006, Proc. SPIE, 6276, 62760Q
- Schubnell et al. (2010) Schubnell, M., Biesiadzinski T., Lorenzon, W., Newman, R. Tarlé, G. 2010, Proc. SPIE 7742, 77421N
- Smith et al. (2008) Smith, R., Zavodny, M., Rahmer, G., Bonati, M. 2008, Proc. SPIE, 7021, 70210J
| Wave- | Reciprocity Failure | ||
| Detector | length | Stripe Mode | Full Mode |
| [nm] | [% decade-1] | ||
| H2RG-102aaPublished in Biesiadzinski et al. (2011). | 700 | 0.35 0.04 | |
| 790 | 0.35 0.03 | ||
| 880 | 0.36 0.05 | ||
| 950 | 0.29 0.04 | ||
| 1400 | 0.38 0.05 | ||
| H2RG-142 | 790 | 0.38 0.03 | 0.53 0.14 |
| 950 | 0.48 0.07 | ||
| 1400 | 0.33 0.04 | ||
| H2RG-236 | 790 | 10.9 0.5 | 10.3 0.6 |
| 950 | 11.9 0.5 | ||
| 1400 | 11.7 0.5 | 10.6 1.9 | |
| H2RG-238 | 790 | 5.1 0.7bb Full mode data analyzed as stripe mode. | 4.0 0.8 |
| 950 | 4.4 0.4 | ||
| Temperature | Reciprocity Failure | |
|---|---|---|
| [K] | [% decade-1] | |
| H2RG-142 | H2RG-236 | |
| 160 | 2.2 0.3 | |
| 150 | 10.9 0.9 | |
| 140 | 0.48 0.07 | 11.9 0.5 |
| 120 | 0.15 0.07 | 3.0 0.7 |
| 100 | 0.1 0.4 | |
| 790 nm | 1400 nm | |
|---|---|---|
| Dark Current | -0.41 | -0.42 |
| QE at 1750 nm | 0.11 | 0.15 |
| Persistence | 0.70 | 0.57 |
| Conversion Gain | -0.09 | 0.00 |