Long-term monitoring of the TeV emission from Mrk 421 with the ARGO-YBJ experiment
Abstract
ARGO-YBJ is an air shower detector array with a fully covered layer of resistive plate chambers. It is operated with a high duty cycle and a large field of view. It continuously monitors the northern sky at energies above 0.3 TeV. In this paper, we report a long-term monitoring of Mrk 421 over the period from 2007 November to 2010 February. This source was observed by the satellite-borne experiments - and in the X-ray band. Mrk 421 was especially active in the first half of 2008. Many flares are observed in both X-ray and -ray bands simultaneously. The -ray flux observed by ARGO-YBJ has a clear correlation with the X-ray flux. No lag between the X-ray and -ray photons longer than 1 day is found. The evolution of the spectral energy distribution is investigated by measuring spectral indices at four different flux levels. Hardening of the spectra is observed in both X-ray and -ray bands. The -ray flux increases quadratically with the simultaneously measured X-ray flux. All these observational results strongly favor the synchrotron self-Compton process as the underlying radiative mechanism.
1 Introduction
Mrk 421 () is one of the brightest blazars known and is classified as a BL Lac object, a subclass of active galactic nuclei (AGNs). Mrk 421 was the first BL Lac source detected (by EGRET in 1991) at energies above 100 MeV (Lin et al., 1992), and was also the first extragalactic object detected by a ground-based experiment (Whipple) at energies around 1 TeV (Punch et al., 1992)(in the following we will refer to -rays as those around 1 TeV). Its emission, like that of the other blazars, is generally dominated by nonthermal radiation from a relativistic jet aligned along our line of sight. The spectral energy distribution (SED) is double-humped at X-ray and -ray energies in a plot of versus (Fossati et al., 1998), where is the frequency and the flux density. The hump at low energies is usually interpreted as being due to synchrotron radiation from relativistic electrons (and positrons) within the jet. The origin of the hump at high energies is under debate. Many models attribute the high-energy emission to the inverse Compton scattering of the synchrotron (synchrotron self-Compton, SSC) or external photons (external Compton, EC) by the same population of relativistic electrons (Ghisellini et al., 1998; Dermer et al., 1992), therefore an X-ray/-ray correlation would naturally be expected. Other models invoke hadronic processes including proton-initiated cascades and/or proton-synchrotron emission in a magnetic-field-dominated jet. Although the hadronic models may also accommodate the observed SED and X-ray/-ray correlation (Aharonian, 2000; Mücke et al., 2003), they are generally challenged by the most rapid flares in the TeV region (Gaidos et al., 1996).
Mrk 421 is a very active blazar with major outbursts about once every two years in both X-ray (Cui et al., 2004) and -ray (Tluczykont et al., 2010) bands. A major outburst usually lasts several months and is accompanied by many rapid flares with timescales from tens of minutes to several days. Its high variability and broadband emission require long-term, well-sampled, multiwavelength observations in order to understand the emission mechanisms of these outbursts. During the last decade, several coordinated multiwavelength campaigns focusing on Mrk 421 have been conducted both in response to strong outbursts and as part of dedicated observation campaigns (Rebillot et al., 2006; Fossati et al., 2008; Acciari et al., 2009; Donnarumma et al., 2009; Horan et al., 2009). Some important general features of the AGN flares have been obtained. Although X-rays and -rays are found to be strongly correlated, neither type is evidently correlated with optical and radio emissions. The spectral index becomes harder at higher fluxes in both X-ray and -ray bands (Rebillot et al., 2006; Krennrich et al., 2002; Aielli et al., 2010). An intensive multiwavelength monitoring campaign has recently been conducted with the Whipple telescope and the - () (Blazejowski et al., 2005). Similar features, including correlated variability at different energies, flaring and spectral evolution are also observed. All these phenomena can be interpreted in the framework of the SSC model. However, “orphan flares”, which have only -ray emission without low-energy companions, and a lag of about two days between X-rays and -rays (Blazejowski et al., 2005) are usually recognized as major challenges to the model.
A long-term simultaneous X-ray/-ray observation is better performed by means of a combination of satellite-borne X-ray experiments and wide field-of-view air shower experiments, such as the Tibet AS- experiment (Amenomori et al., 2003) and ARGO-YBJ experiment (Aielli et al., 2006), which are operated day and night with a duty cycle higher than 85% and can observe any source with a zenith angle less than 50∘. This is essential in order to investigate the temporal features of AGN emissions. The ARGO-YBJ experiment has continuously monitored the northern sky for outbursts from all AGNs, such as Mrk 421, since 2006 June. Meanwhile, these sources were also monitored by the satellite-borne X-ray detectors All-Sky Monitor (ASM)/ and Burst Alert Telescope (BAT)/. In this paper, we report on the long-term monitoring of Mrk 421 for -ray outbursts and on the correlation between -rays and simultaneous X-rays over the period from 2007 November to 2010 February. The paper is organized as follows: the ARGO-YBJ experiment is briefly introduced in Section 2 and its long-term performance is shown in Section 3. A data analysis method is described in Section 4. Observation findings are presented in Section 5. Conclusions are given in Section 6.
2 The ARGO-YBJ Experiment
The ARGO-YBJ experiment, located in Tibet, China at an altitude of 4300 m a.s.l., is the result of a collaboration among Chinese and Italian institutions and is designed for very high energy -ray astronomy and cosmic ray observations. The detector consists of a single layer of resistive plate chambers (RPCs), which are organized with a modular configuration. The basic module is a cluster (5.7 m 7.6 m) composed of 12 RPCs (2.850 m 1.225 m each). The RPCs are equipped with pick-up strips (6.75 cm 61.80 cm each), and the logical OR of the signal from eight neighboring strips constitutes a logical pixel (called a “pad”) for triggering and timing purposes. One hundred thirty clusters are installed to form a carpet of about 5600 m2 with an active area of 93%. This central carpet is surrounded by 23 additional clusters (a “guard ring”) to improve the reconstruction of the shower core location. The total area of the array is 110 m 100 m. More details about the detector and RPC performance can be found in, for example, Aielli et al. (2006).
The RPC carpet is connected to two independent data acquisition systems corresponding to two different operation modes, referred to as the shower and the scaler (Aielli et al., 2008) modes. Data used in this paper refer to the shower mode, in which the ARGO-YBJ detector is triggered when at least 20 pads in the entire carpet detector are registered within 420 ns. The high granularity of the apparatus permits a detailed spatialtemporal reconstruction of the shower profile and therefore the incident direction of the primary particle. The arrival time of the particles is measured by time to digital converters (TDCs) with a resolution of approximately 1.8 ns. In order to calibrate the 18,360 TDC channels, an off-line method (He et al., 2007) has been developed using cosmic ray showers. The calibration precision is 0.4 ns, and the procedure is applied every month (Aielli et al., 2009a).
The central 130 clusters began taking data in 2006 June, and the “guard ring” was merged into the DAQ stream in 2007 November. The trigger rate is 3.6 kHz with a dead time of 4%, and the average duty cycle is higher than .
3 Detector Performance
For long-term monitoring campaigns, the stable operation of the equipment is very important. In order to continuously monitor the performance of the RPCs, including detection efficiency and time resolution, a cosmic ray muon telescope is set up near the detector array. The RPC efficiency fluctuates by about 0.3% and the time resolution by about 0.4 ns in a day, and these values become 1.5% and 1 ns in a year, respectively. Detailed information about the performance monitored using this telescope can be found in Aielli et al. (2009c).
To estimate the angular resolution and effective area, a full Monte Carlo simulation of the RPC detector array is developed. In the code, the CORSIKA package (Heck et al., 1998) is used to describe the air shower development. G4argo (Guo et al., 2010), a GEANT4-based (Agostinelli et al., 2003) package, is used to simulate the response of the RPC array. For events with a number of fired pads () greater than 100, the Point Spread Function (PSF) has a single Gaussian functional form. For events at lower Npad, the best fit to the PSF becomes a combination of two Gaussian distributions, the wider of which contains 20% of the events. To simplify the description of the PSF, a parameter is defined as is the opening angle containing 71.5% of the events. When the PSF is a single Gaussian, maximizes the signal-to-background ratio for a point source. For , is 0.47∘, while at becomes 2.8∘. The effective area of the detector for -induced showers depends on the -ray energy and incident zenith angle, e.g., it is about 100 m2 at 100 GeV and 10,000 m2 above 1 TeV for a zenith angle of 20∘ (Aielli et al., 2009b).
The angular resolution, pointing accuracy and stability of the ARGO-YBJ detector array have been thoroughly tested by measuring the shadow of the Moon in cosmic rays (Iuppa et al., 2009). The shadow is detected with a significance of 10 per month using the ARGO-YBJ data. The position of the shadow allows the investigation of any pointing bias. The east-west displacement is in good agreement with the expectation, while a 0.2∘ pointing error toward the north is observed and is under investigation.
4 Data Analysis
For the analysis presented in this paper, only events with a zenith angle less than 45∘ are used, and the data set is divided into six groups according to . The event selections are listed in Table 1, where is the distance between shower core position and the carpet center, and TS is the time spread of the shower front in the conical fit defined in Eqation(1) of Aielli et al. (2009a). With these selections, the angular resolution is improved, e.g., for events with and , the opening angle decreases from 1.68∘ and 1.27∘ to 1.36∘ and 0.99∘. As a consequence, the significance of the Crab Nebula is increased by about 10% and 25%, respectively.
In order to obtain a sky map using events in each group, an area centered at the source location in celestial coordinates (right ascension and declination) is divided into a grid of bins and filled with detected events according to their reconstructed origin. The number of events in each grid bin is denoted as , where the subscript denotes the bin number. In order to extract an excess of -rays from the source, the direct integral method (Fleysher et al., 2004) is applied to estimate the number of cosmic ray background events in the bin, denoted as . An essential assumption in this estimation is that the background must be uniform around the source. However, an anisotropy of the cosmic ray flux is measured over spatial scales such as and larger (Amenomori et al., 2006; Zhang et al., 2009). This anisotropy as measured by the ratio is stable; therefore, it is possible to correct it with a long-term measurement for each grid bin. An average of the ratio over the bins in a window centered on the source bin is applied for smoothing. In this procedure, in order to avoid any contamination of the excess in the source bin and possible spread out due to the finite angular resolution, the contribution from a window around the source bin is excluded. Finally the correction factor, denoted as , is calculated as follows:
| (1) |
where the subscript is the index of the selected grid bins. The corrected number of background events in each bin is . The typical value of around Mrk 421 is approximately 0.9995. The value of for each bin is calculated using about two years of data and is stored in a database for routine analysis.
Taking into account the PSF of the ARGO-YBJ detector, the events in a circular area centered on the bin with an angular radius of are summed together. Namely,
| (2) |
where is the number of bins in the circular area, is the total number of events, and is the number of background events. The LiMa formula (Li & Ma, 1983) is used to estimate the significance.
5 Results
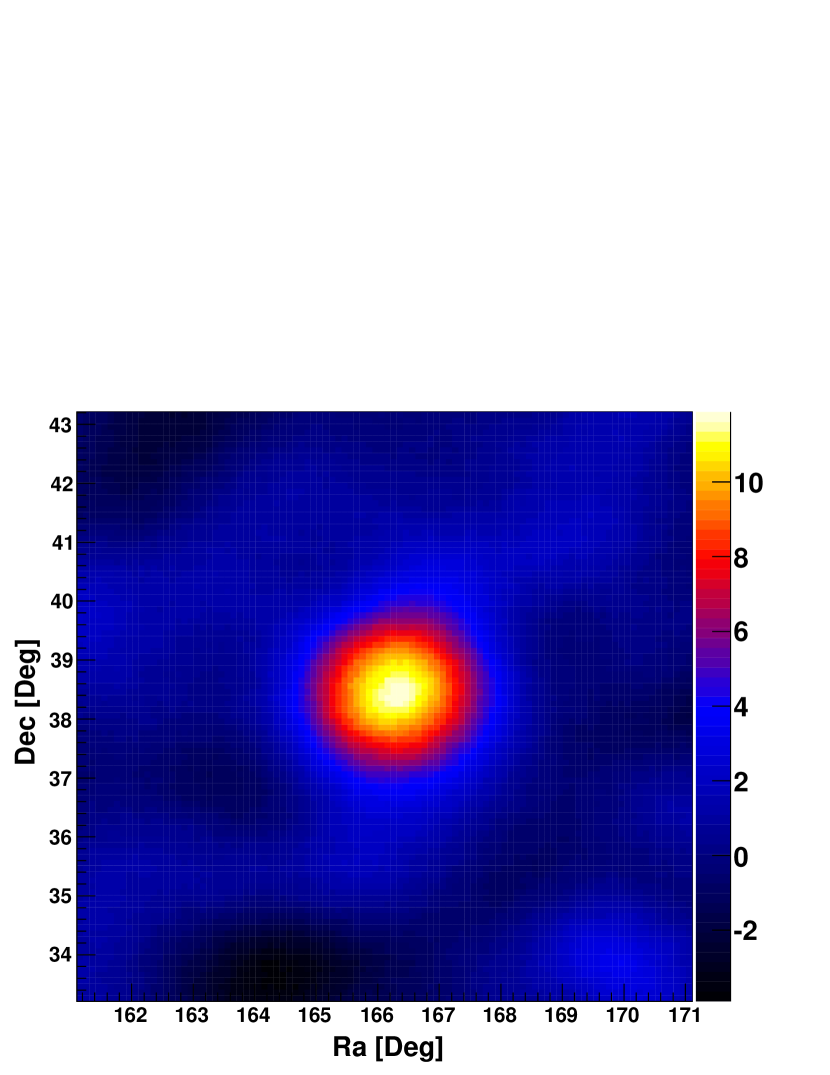
The data used in this paper were collected by the ARGO-YBJ experiment in the period from 2007 November to 2010 February. The total lifetime is 676.0 days. The numbers of events in different groups after the selections are listed in Table 1. A clear signal from Mrk 421 with significance greater than 11 is observed using events with (see Figure 1). A signal at such a level of significance allows us to study flux variations, correlations with the X-ray flux, and the evolution of the SED.
5.1 Temporal Analysis
In order to study the correlation between -rays and X-rays, the daily averaged light curves of both the hard X-rays (1550 keV) measured by BAT/111 Transient monitor results provided by the BAT/ team: http://heasarc.gsfc.nasa.gov/docs/swift/results/transients/weak/Mrk421/. and the soft X-rays (212 keV) measured by ASM/222Quick-look results provided by the ASM/ team: http://xte.mit.edu/ASM_lc.html. are used. The observations by and have a rather long exposure by orbiting the Earth every 1.5 hr. Since the fluctuation of the X-ray flux is abnormally large in some days, in order to control the quality of the data, days that have a very large error on the mean daily event rate are removed from the data set. For ASM/, the distribution of the error indicates that a selection of the errors smaller than 1 count s-1 will cut everything beyond four standard deviations in the distribution. A similar cut applies to the BAT/ data, in which a selection of the errors smaller than 0.0035 counts cm-2 s-1 cuts everything beyond four standard deviations in the error distribution. Approximately, 6.4% and 5.6% of events are removed from the and data sets, respectively. Whether it is day or night, ARGO-YBJ observes Mrk-421 while the AGN is in its field of view. A typical transit lasts usually 6 hr. An observational time less than 5 hr day-1 indicates some malfunctioning of the detector in that day, which is thus removed from the data set. In total, 9.7% of data are removed in this way. Finally, 737, 728, and 712 days are selected from the ASM, BAT, and ARGO-YBJ reconstructed data sets, respectively.
5.1.1 Light Curves
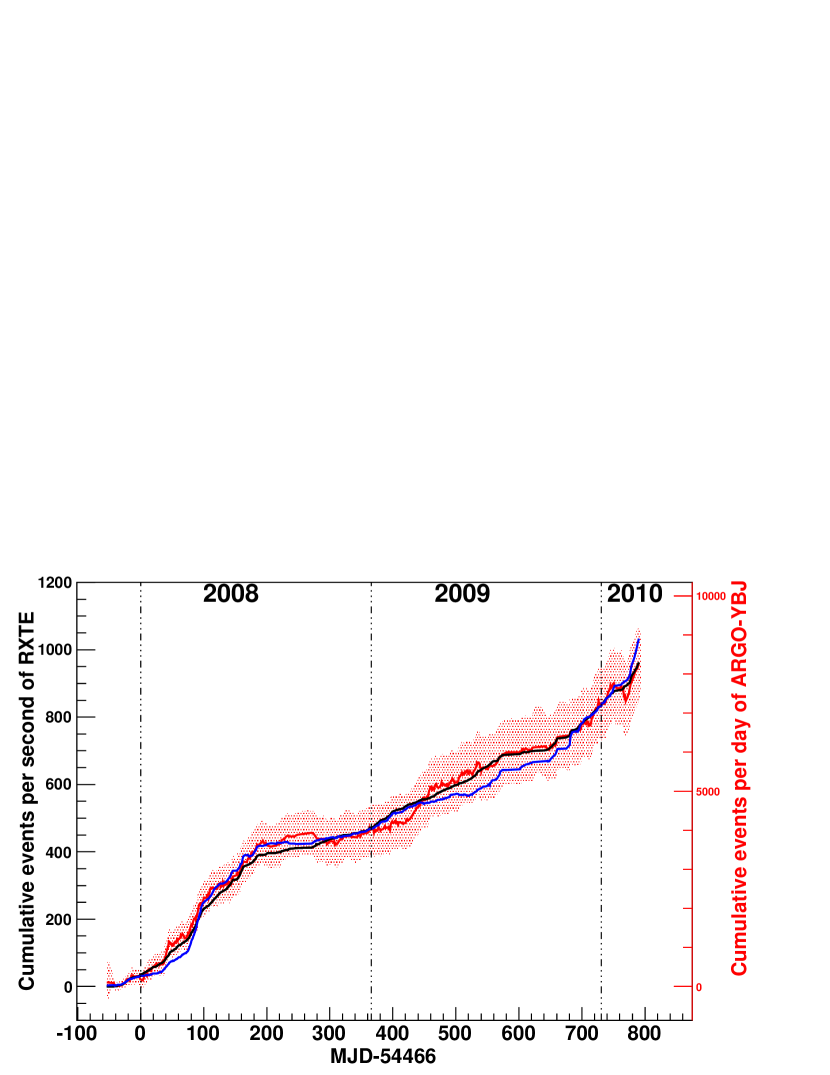
In 552 days all three experiments observed Mrk 421 simultaneously. In Figure 2, the accumulation of event rates from the Mrk 421 direction is shown. The event rate has been normalized using the scale and the ARGO-YBJ curve is obtained using events with , thus the median energy of the observed photons is 1.8 TeV, assuming a spectral index 2.4. The fast increase in the three curves indicates that the source had a long-term outburst at the beginning of 2008. The following quiet state lasted for about 200 days. Afterward Mrk 421 became increasingly more active. In fact, there were flares in 2009 November (Isobe et al., 2010). The duty cycle of ARGO-YBJ was low due to detector maintenance, therefore it is not obvious in Figure 2. There was a large flare in 2010 February (Isobe et al., 2010; Ong, 2010).
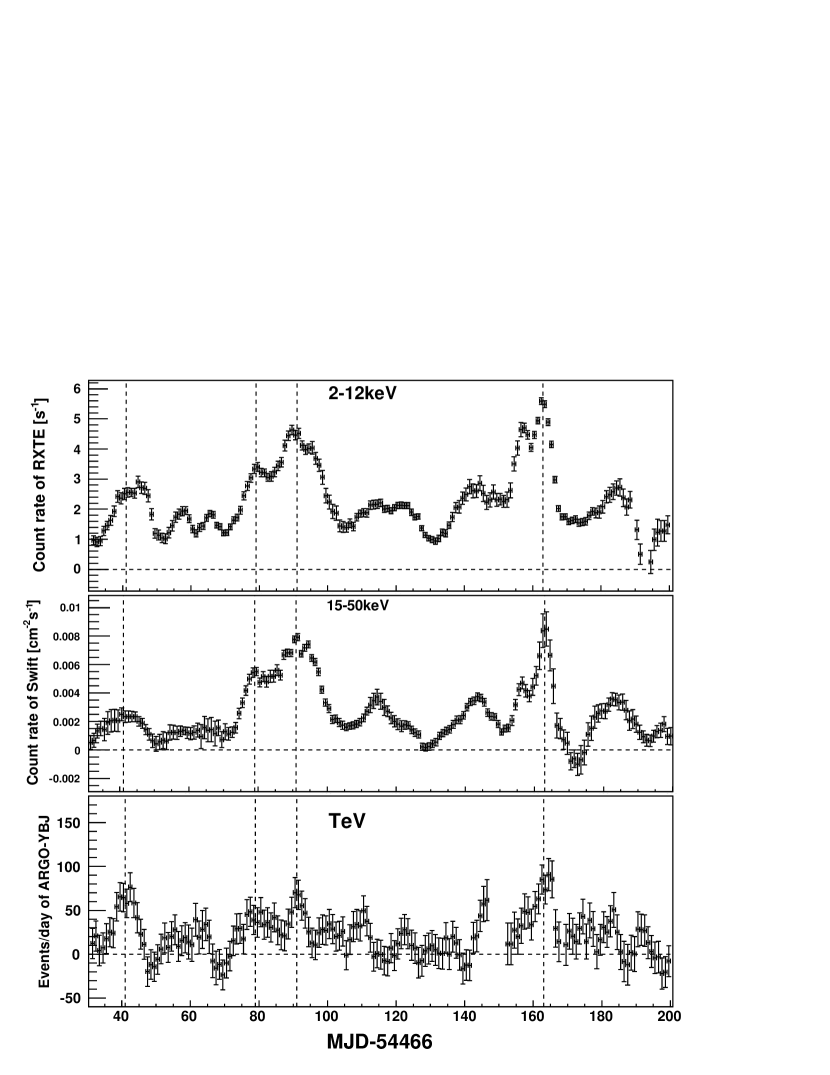
Out of the long-term variation that is clearly revealed in the cumulative light curve shown in Figure 2, Mrk 421 undergoes a large outburst during the period from 2008 February to June, indicated by the steepest part of the curves. In fact, it is a combination of several large flares. A better view of these is shown in Figure 3, where a smoothing analysis is applied for both -ray and X-ray curves, and each point is the event rate averaged over five days. Four large flares are observed by all three detectors, and the peak times are in good agreement with one another. The fourth flare has been reported by the ARGO-YBJ experiment in Aielli et al. (2010). It gives an important observation when the Cherenkov telescopes are hampered by the Moon. It can be concluded that there exists a good long-term correlation between -rays and X-rays.
5.1.2 X-ray/TeV Correlation
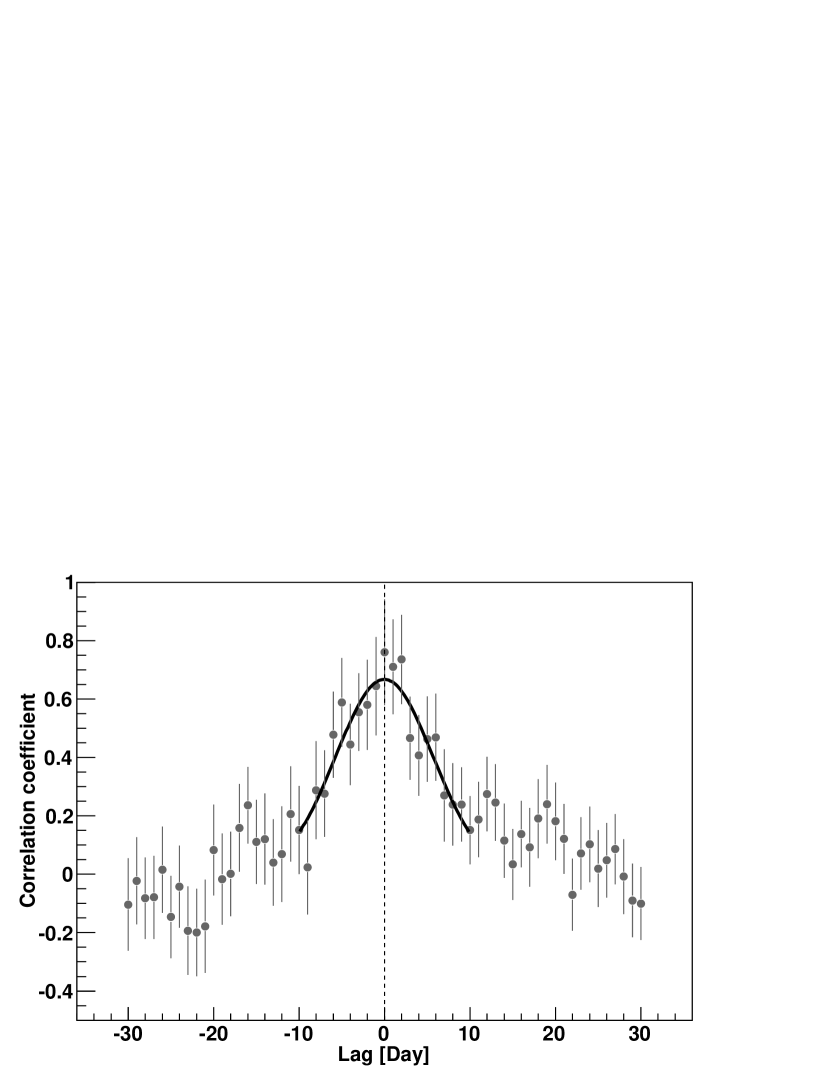
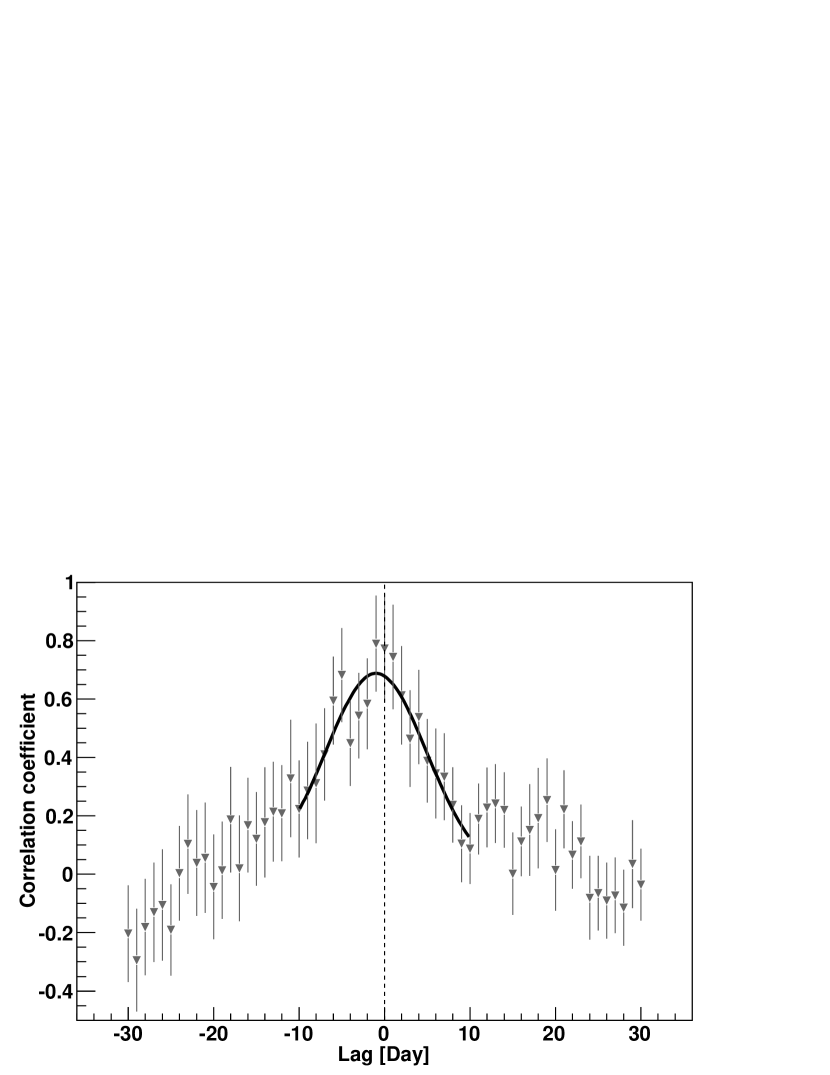
The discrete correlation function (DCF) (Edelson & Krolik, 1988) is used to quantify the degree of correlation and the phase differences (lags) in the variations between -rays and X-rays. The daily fluxes before smoothing are used for this analysis. The DCF (in 1 day bins) derived from and ARGO-YBJ data (with ) is shown in the left panel of Figure 4, where a positive value means that -rays lag X-rays. The peak of the distribution is around zero and the correlation coefficient at zero is . The result derived from and ARGO-YBJ data is shown in the right panel of Figure 4 and the correlation coefficient at zero is . To estimate the lag and its uncertainty, a data-based simulation suggested by Peterson et al. (1998) is applied and the correlation coefficient between 10 and 10 days is fitted with a Gaussian function. The median value and corresponding 68% confidence level errors are and days for the correlations of ARGO-YBJ/ and ARGO-YBJ/ data, respectively. No significant lag longer than one day is found.
5.2 Spectral Energy Distribution
To study the SED at different flux levels, the data simultaneously observed in -ray and X-ray bands are divided into four groups according to the observational time periods in which the ASM/ counting rate is , , or cm-2 s-1. For each group, a flux-averaged SED is constructed both at -ray and X-ray energies.
5.2.1 X-ray Spectra
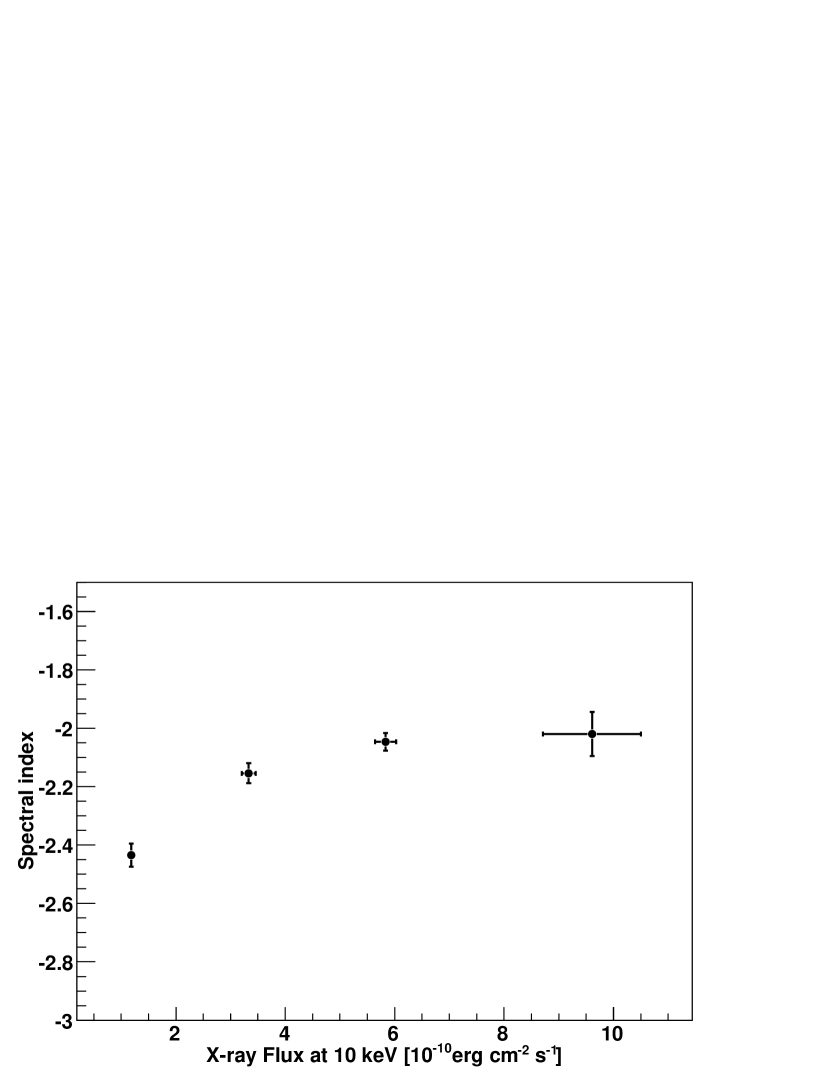
ASM/ monitors the X-ray emission from Mrk 421 at three energy bands, i.e., , and keV (Levine et al., 1996). In the flux estimation, the hydrogen column density cm-2(Dickey & Lockman, 1990) and a power law spectrum are assumed. The best-fit spectral indices for the four flux levels are , , , and , respectively, in which only statistical errors are taken into account. The spectral indices versus the corresponding fluences at 10 keV are shown in Figure 5. This result is consistent with the analysis of Rebillot et al. (2006), in which a spectral hardening toward high fluxes is also reported based on a shorter timescale observation. This indicates that this correlation is independent of the timescale.
5.2.2 -ray Spectra
To estimate the spectrum of -rays with a distribution of the number of events in excess as a function of , we follow a widely used method that is described in detail elsewhere (Amenomori et al., 2009; Aielli et al., 2010). In this procedure, we assume for the spectrum of Mrk 421 a power law with a cutoff factor , which takes into account the absorption of -rays in the extragalactic background light. We adopt the optical depth (E) estimated by Franceschini et al. (2008). The ARGO-YBJ detector response is also taken into account. The simulated events are sampled in the energy range from 10 GeV to 100 TeV.
To test this method, the same analysis is performed with the data in the direction of the Crab Nebula, the standard candle in the -ray sky. The resulting spectrum is (E/TeV) photons TeV-1 cm-2 s-1, which is in agreement with our previous measurement (Aielli et al., 2010) and observations by other detectors, such as H.E.S.S. (Aharonian et al., 2006), MAGIC (Albert et al., 2008), and Tibet AS- (Amenomori et al., 2009).
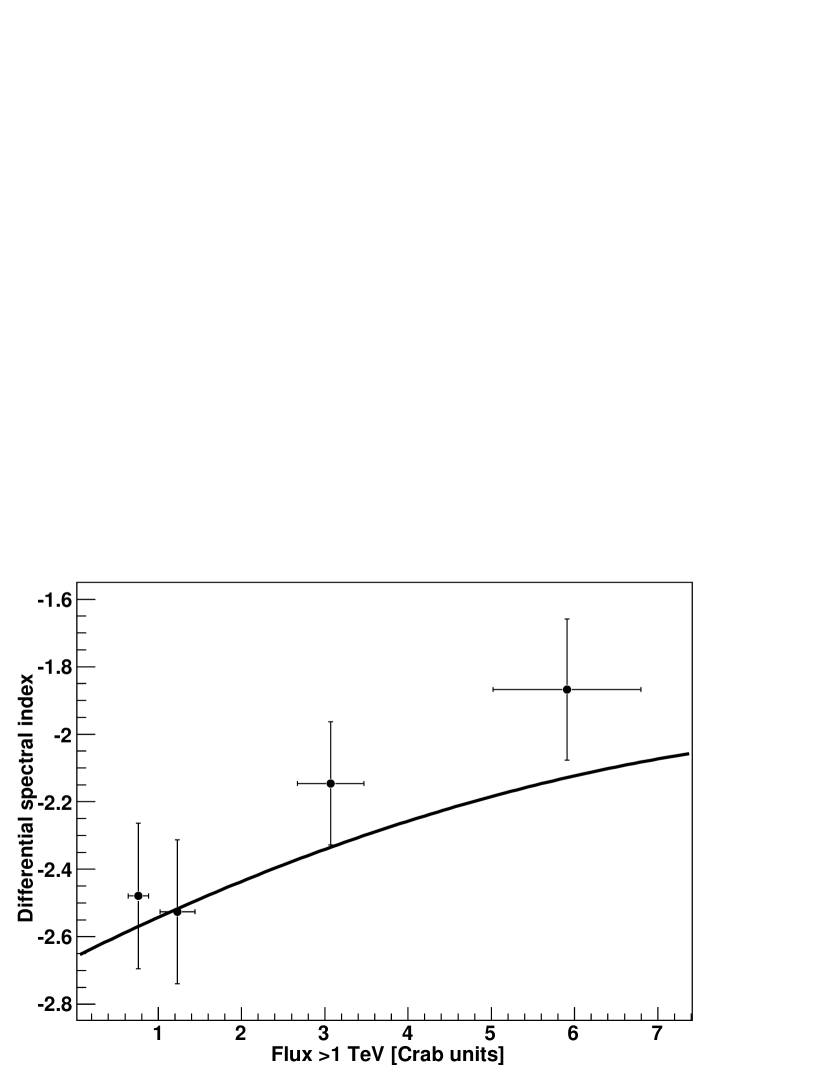
Applying this procedure to Mrk 421, we obtain the spectra for the four event groups with different flux levels. The spectral indices in the energy range from 300 GeV to 10 TeV are , , , and , respectively. Only statistical error is quoted. The corresponding flux above 1 TeV ranges from 0.8 to 6 times that of the Crab Nebula unit, i.e., photons cm-2 s-1. The spectra seem to become harder with increasing flux, as indicated in Figure 6, in agreement with the function obtained by the Whipple experiment (Krennrich et al., 2002). A similar result has been reported elsewhere (Aielli et al., 2010) using the three-day flare data in 2008 June. The quoted errors in Figure 6 are statistical. The systematic error is estimated to be 30% in the flux level determination (Aielli et al., 2010).
5.2.3 Correlation Between -ray and X-ray Fluxes
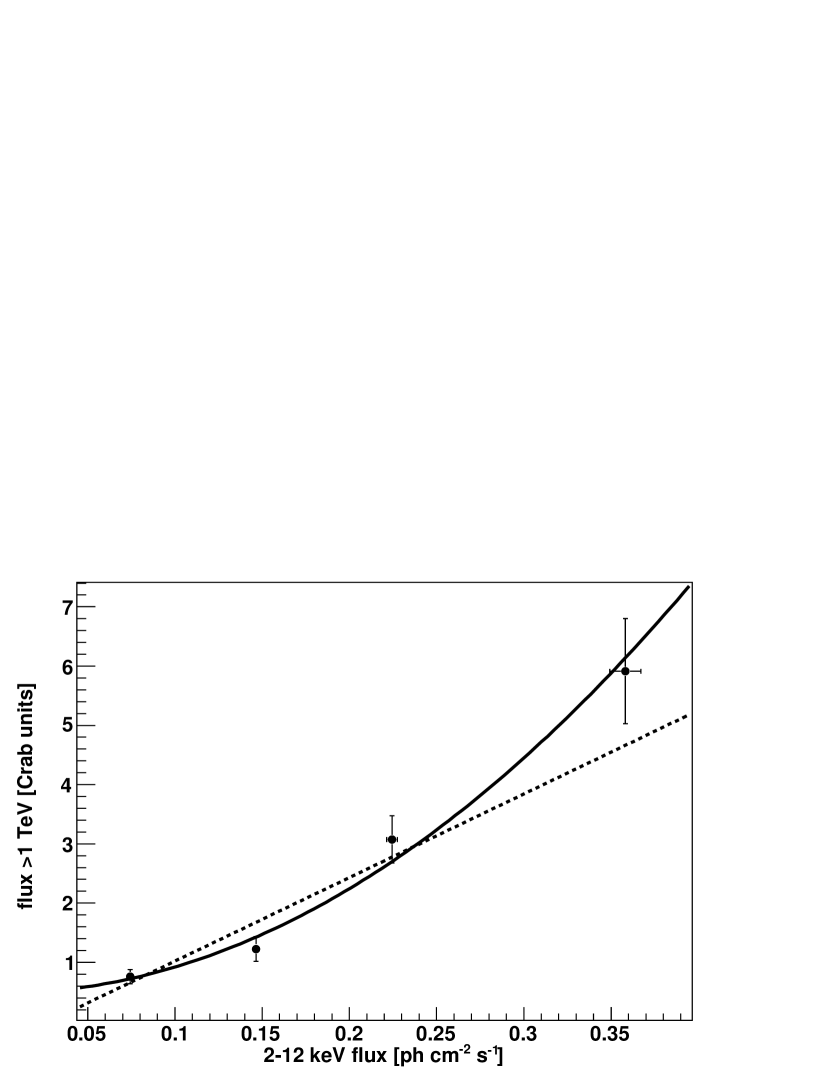
Using the spectra described above, we investigate the correlation between -ray and X-ray fluxes. Figure 7 shows the integral -ray flux above 1 TeV as a function of the integral X-ray flux from 2 keV to 12 keV; a positive correlation is observed. A quadratic fit (with the function ) to the data points yields dof, while a linear fit yields dof, where dof refers to degrees of freedom. The observation favors a quadratic correlation between -ray and X-ray fluxes. A similar quadratic correlation has been reported by Fossati et al. (2008). In contrast, an observation with linear correlation is obtained by Amenomori et al. (2003). According to Katarzyński et al. (2005), changes of the magnetic field, electron density, and adiabatic cooling may be associated with different correlations between -ray and X-ray fluxes.
5.3 Modeling of the X-ray and -ray Emissions
A fit to the four flux-averaged SEDs with a homogeneous one-zone SSC model proposed by Mastichiadis & Kirk (1995) (see also Mastichiadis & Kirk, 1997; Yang et al., 2008) is performed. In this model the parameters include the Doppler factor ; the spherical blob radius R; magnetic field strength ; electron spectral index ; electron maximum Lorentz factor ; and electron injection compactness , where and are the Lorentz factor and the speed of the blob, respectively, is the electron Lorentz factor, is the Thomson cross section, is the angle between its direction of motion and the line of sight of the observer, and , the electron spectrum at injection, is assumed to follow a power law . The best fits are shown in Figure 8 for different flux levels, with the corresponding parameters given in Table 2. In our fits, the magnetic field strength is estimated by (see Equation (6) of Mastichiadis & Kirk (1997)), where is the synchrotron peak frequency in units of Hz and is the IC peak frequency in units of Hz. For the lowest flux level (see Figure 8(1)), the magnetic field strength is estimated to be G. Compared to the lowest flux level, X-ray peak frequencies in other flux levels increase by a factor of , but the IC peak frequencies have few changes. Therefore, the magnetic field strengths in other flux levels are larger than that in the lowest flux level by a factor of when the Doppler factor is roughly fixed.
6 Discussion And Summary
Mrk 421 is a very active blazar with frequent outbursts, which are composed of many flares and can last as long as a few months. This makes this blazar an excellent candidate for studying the jet physics in AGNs. A strong correlation between its -ray and X-ray emissions has been confirmed by many observations in the past decade (for a review see Wagner (2008)). Most of the previous -ray observations, however, are carried out by Cherenkov telescopes with limited exposure and usually focus on short timescales. In contrast, the high duty cycle of the ARGO-YBJ experiment makes possible a long-term and continuous observation of this variable source, allowing simultaneous monitoring of -rays and X-rays for about two years. This increases the set of long-term simultaneous multiwavelength observations of Mrk 421, which are essential for studying the correlation between energy bands where different emission mechanisms are at work. The observation time, from 2007 December to 2010 February, covers both active and quiet phases. The -ray flux shows a good long-term correlation with the X-ray flux (see Figure 2) and all the large X-ray flares have their -ray counterparts during the outburst time (see Figure 3), indicating that -rays and X-rays may have a common origin as assumed in the SSC model (Mastichiadis & Kirk, 1995).
In the SSC model, the -ray photons are produced via inverse Compton scattering off the synchrotron photons by the same electrons, and simultaneous variability or short lags are expected between -ray and X-ray fluxes. Short lags can be caused by differences in acceleration and cooling timescales or by reverse shocks, and sub-hour lags have been definitely measured between different X-ray (Ravasio et al., 2004) and -ray (Albert et al., 2007) interband energies and between X-ray and -ray bands (Fossati et al., 2008). On the other hand, the characteristic timescale of the SSC process would be too short to account for a lag of two days such as that reported by Blazejowski et al. (2005) with a marginal significance. In this paper, the two-year data are used to search for possible lags between variations in X-rays and -rays. No lag longer than one day is observed (see Figure 4).
A sudden variation of flux can be caused by different reasons, e.g., a change in the number of emitting electrons and/or the maximum momentum of emitting electron and/or the magnetic field strength, with different evolutions of the SED at X-rays and -rays in the SSC model. To investigate the evolution at different flux levels, both the -ray and X-ray data are divided into four groups according to the X-ray flux. A hardening in the spectra toward high fluxes is observed (see Figure 5 and Figure 6). The results based on two years of data are consistent with the results obtained by the Whipple experiment (Krennrich et al., 2002). A close tie between the variation of the flux and of the spectral index indicates peak energy increases with the flux, which has also been found in Aleksic et al. (2010). This supports the prediction of the SSC model for changes in the maximum momentum of emitting electrons (Mastichiadis & Kirk, 1997). Moreover, we study the correlation function between -rays and X-rays, finding that the -ray flux shows a quadratic increase with the X-ray flux (see Figure 7). In the homogeneous SSC model, the synchrotron flux is proportional to the electron density, and the IC -ray flux is proportional to both the electron density and the synchrotron flux; therefore, the -ray flux is a quadratic function of the synchrotron flux. Never before was there an indication distinguishing quadratic from linear correlations between -ray and X-ray fluxes according to observations of flares, as reviewed by Wagner (2008). We also construct a homogeneous one-zone SSC model to simultaneously fit the -ray and X-ray emissions in four different flux levels (see Figure 8) by changing the electron parameters and/or and/or magnetic field strength. We find that the flux variation seems to be caused by the variation of the maximum energy and density of the electron injection spectrum.
In conclusion, we have presented a long-term continuous monitoring of Mrk 421 and a correlation between -rays observed by the ARGO-YBJ experiment and satellite-borne X-ray data. The temporal and spectral analysis strongly support the predictions of the SSC model.
References
- Acciari et al. (2009) Acciari, V.A., et al. 2009, ApJ, 703, 169
- Agostinelli et al. (2003) Agostinelli, S., et al. 2003, Nucl. Instrum. Methods Phys. Res. A, 506, 250 (http://geant4.web.cern.ch/geant4/)
- Aharonian (2000) Aharonian, F.A. 2000, New Astron, 5, 377
- Aharonian et al. (2006) Aharonian, F.A., et al. 2006, A&A, 457, 899
- Aielli et al. (2006) Aielli, G., et al. 2006, Nucl. Instrum. Methods Phys. Res. A, 562, 92
- Aielli et al. (2008) Aielli, G., et al. 2008, Astropart. Phys., 30, 85
- Aielli et al. (2009a) Aielli, G., et al. 2009a, Astropart. Phys., 30, 287
- Aielli et al. (2009b) Aielli, G., et al. 2009b, Astropart. Phys., 32, 47
- Aielli et al. (2009c) Aielli, G., et al. 2009c, Nucl. Instrum. Methods Phys. Res. A, 608, 246
- Aielli et al. (2010) Aielli, G., et al. 2010, ApJ, 714, L208
- Albert et al. (2007) Albert, J., et al. 2007, ApJ, 669, 862
- Albert et al. (2008) Albert, J., et al. 2008, ApJ, 674, 1037
- Aleksic et al. (2010) Aleksic, J., et al. 2010, A&A, 519, A32
- Amenomori et al. (2003) Amenomori, M., et al. 2003, ApJ, 598, 242
- Amenomori et al. (2006) Amenomori, M., et al. 2006, Science, 314, 439
- Amenomori et al. (2009) Amenomori, M., et al. 2009, ApJ, 692, 61
- Blazejowski et al. (2005) Blazejowski, M., et al. 2005, ApJ, 630, 130
- Cui et al. (2004) Cui, W. 2004, ApJ, 605, 662
- Dermer et al. (1992) Dermer, C. D., et al. 1992, A&A, 256, L27
- Dickey & Lockman (1990) Dickey, J., & Lockman, J. 1990, ARA&A, 28, 215
- Donnarumma et al. (2009) Donnarumma, I., et al. 2009, ApJ, 691, L13
- Edelson & Krolik (1988) Edelson, R.R., & Krolik, J.H. 1988, ApJ, 333, 646
- Fleysher et al. (2004) Fleysher, R., et al. 2004, ApJ, 603, 355
- Fossati et al. (1998) Fossati, G., et al. 1998, MNRAS, 299, 433
- Fossati et al. (2008) Fossati, G., et al. 2008, ApJ, 677, 906
- Franceschini et al. (2008) Franceschini, A., et al. 2008, A & A, 487, 837
- Gaidos et al. (1996) Gaidos, J. A., et al. 1996, Nature, 383, 319
- Ghisellini et al. (1998) Ghisellini, G., et al. 1998, MNRAS, 301, 451
- Guo et al. (2010) Guo, Y.Q., et al. 2010, CPC(HEP & NP), 34, 555
- Heck et al. (1998) Heck, D., et al. 1998, Forschungszentrum Karlsruhe Report No. FZKA 6019
- He et al. (2007) He, H. H., Bernardini, P., Calabrese Melcarne, A. K., & Chen, S. Z. 2007, Astropart. Phys., 27, 528
- Horan et al. (2009) Horan, D., et al. 2009, ApJ, 695, 596
- Isobe et al. (2010) Isobe, N., et al. 2010, PASJ, 62, L55
- Iuppa et al. (2009) Iuppa, R., et al. 2009, ICRC, HE.1.1
- Katarzyński et al. (2005) Katarzyński, K., et al. 2005, A&A, 433, 479
- Krennrich et al. (2002) Krennrich, F., et al. 2002, ApJ, 575, L9
- Levine et al. (1996) Levine, A. M., et al. 1996, ApJ, 467, L33
- Li & Ma (1983) Li, T.P.,& Ma, Y.Q. 1983, ApJ, 272, 317
- Lin et al. (1992) Lin, Y.C., et al. 1992, ApJ, 401, L61
- Mastichiadis & Kirk (1995) Mastichiadis, A. & Kirk, J.G. 1995, A&A, 295, 613
- Mastichiadis & Kirk (1997) Mastichiadis, A. & Kirk, J.G. 1997, A&A, 320, 19
- Mücke et al. (2003) Mücke, A., et al. 2003, Astropart. Phys., 18, 593
- Ong (2010) Ong, R.A., 2010, ATel#,2443
- Peterson et al. (1998) Peterson, B.M., et al. 1998, PASP, 110, 660
- Punch et al. (1992) Punch, M., et al. 1992, Nature, 358, 477
- Ravasio et al. (2004) Ravasio, M., et al. 2004, A&A, 424, 841
- Rebillot et al. (2006) Rebillot, P.F., et al. 2006, ApJ, 641, 740
- Tluczykont et al. (2010) Tluczykont, M., et al. 2010, A&A, 524, 48
- Wagner (2008) Wagner, R., 2008, arXiv:0808.2483v1
- Yang et al. (2008) Yang, C.Y., Fang, J., Lin, G.F. & Zhang, L. 2008, ApJ, 682, 767
- Zhang et al. (2009) Zhang, J.L., et al. 2009, ICRC, HE.1.1
| range | (m) | TS (ns2) | Number of Events |
|---|---|---|---|
| No cut | 50 | 8.711010 | |
| No cut | 30 | 1.831010 | |
| 70 | 20 | 6.13109 | |
| 70 | 20 | 3.42109 | |
| 60 | 20 | 1.05109 | |
| 30 | 20 | 3.71108 |
| Flux Level | (G) | (cm) | ||||
|---|---|---|---|---|---|---|
| 1 | 0.08 | 16 | 1.7 | |||
| 2 | 0.15 | 15 | 1.7 | |||
| 3 | 0.15 | 15 | 1.7 | |||
| 4 | 0.15 | 15 | 1.7 |