On the absence of molecular absorption in high redshift millimetre-band searches
Abstract
We have undertaken a search for millimetre-wave band absorption (through the CO and HCO+ rotational transitions) in the host galaxies of reddened radio sources (). Despite the colour selection (optical–near infrared colours of in all but one source), no absorption was found in any of the eight quasars for which the background continuum flux was detected. On the basis of the previous (mostly intervening) and OH detections, the limits reached here and in some previous surveys should be deep enough to detect molecular absorption according to their colours. However, our survey makes the assumption that the reddening is associated with dust close to the emission redshift of the quasar and that the narrow millimetre component of this emission is intercepted by the compact molecular cores. By using the known millimetre absorbers to define the colour depth and comparing this with the ultra-violet luminosities of the sources, we find that, even if these assumptions are valid, only twelve of the forty objects (mainly from this work) are potentially detectable. This is assuming an excitation temperature of K at , with the number decreasing with increasing temperatures (to zero detectable at K).
keywords:
radio lines: galaxies – galaxies: active – quasars: absorption lines – cosmology: observations – galaxies: abundances – galaxies: high redshift1 Introduction
Millimetre-wave observations of molecular absorption systems along the sight-lines to distant quasars provide a powerful probe of the cold, dense, star forming gas in the distant Universe. Furthermore, comparison of the redshifts of the rotational transitions of the molecules with those of the spin-flip transition of H i, as well as the electronic optical/UV transitions of metal ions, can be used to determine high redshift values of the fundamental constants, to at least an order of magnitude the sensitivity of purely optical data (see Curran et al. 2004a). However, despite much searching, only four such systems are currently known (Wiklind & Combes, 1995, 1996a, 1996b, 1997), the highest redshift being at . Of these, two are intervening systems (gravitational lenses towards more distant quasars), with the other two systems arising through absorption within the host galaxy of the quasar. Subsequent searches at the redshifts of known high column density H i absorption systems, intervening the sight-lines to more distant quasi-stellar objects (QSOs), have also failed to detect molecular absorption in the millimetre-band (Curran et al. 2004b and references therein), despite the possibility that these so-called damped Lyman- systems (DLAs)111These have neutral hydrogen column densities of and are usually detected at , where the Lyman- transition is redshifted in to the optical band. may account for more than 80 per-cent of the neutral gas content in the Universe (Prochaska et al., 2005).
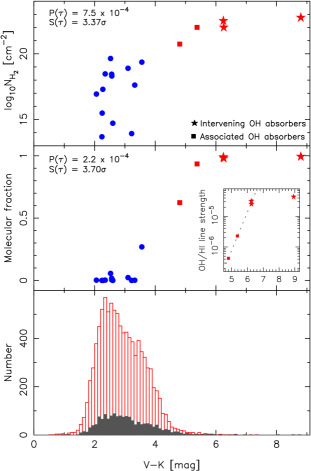
DLAs are, however, not devoid of molecular gas: To date, the Lyman and Werner ultra-violet bands of have been detected in 19 DLAs (see Noterdaeme et al. 2008222One of which, J1439+113, has also been detected in the CO UV band (Srianand et al., 2008)., Jorgenson et al. 2009 and Srianand et al. 2010). These, however, have molecular abundances which are generally much lower than those detectable with current microwave and radio telescopes (Curran et al. 2004b and Fig. 1, top). Furthermore, in Curran et al. (2006) we showed that the -bearing DLAs have molecular fractions of and (Fig. 1, middle), i.e. in the same range as a ”typical” QSO (Fig. 1, bottom)333 in general and if radio-loud., whereas the millimetre and decimetre band absorbers have molecular fractions and optical–near-infrared colours of .
The correlations in Fig. 1 present strong evidence that the quasar light is reddened by dust in the foreground absorber: Since the presence of the dust is necessary to prevent the dissociation of the molecular gas by the ambient ultra-violet field, the molecular fraction is expected to be correlated with the dust abundance, as observed. The paucity of millimetre-wave band absorption can therefore be attributed to the traditional optical selection of targets biasing towards absorbers of low dust content and therefore low molecular fractions.
The fact that intervening absorbers are usually found through optical spectroscopy, yielding a redshift but also giving the above bias against dusty objects, means that millimetre-band searches of known intervening absorbers have generally been unsuccessful (Curran et al. 2004b and references therein). An alternative target for molecular absorption is towards the fainter “red quasars”, where the red colour may indicate an intervening column of dust. However, due to the relatively narrow bandwidths in the millimetre band (see Sect. 4.2), such an approach is currently only practical at longer (decimetre) wavelengths (see Curran et al. 2011b). In the absence of any known intervening absorbers, selecting the quasar itself gives a redshift () to which to tune the receiver. Naturally, such a selection of targets prevents any useful comparison with the optical redshifts, in order to measure the values of the fundamental constants, although any detections could be followed up in 21-cm, giving the redshift of the spin-flip transition of H i.
2 Observations
2.1 Target selection
As per Curran et al. (2006), our sources were selected from the Parkes Half-Jansky Flat-spectrum Sample (PHFS, Drinkwater et al. 1997)444With the addition of 0500+019, included since it has been detected in 21-cm absorption (Carilli et al., 1998). We also included J0906+4952 & J1341+3301, which are two very red sources from Glikman et al. (2004) [Sect. 2.3]., on the basis of their optical–near-IR photometry (Francis et al., 2000). From these, we selected the 30 reddest sources (which correspond to an extinction of ), in which the emission redshift of the quasar () would place a strong absorption line (CO or HCO+) into the 3-mm band. After culling these further, by selecting those of ∘ (thus being observable from northern latitudes)555We miss SEST. and with 3-mm flux densities expected to be mJy, the ten objects listed in Table 3.1 remained.
2.2 The IRAM 30-m observations
From December 2003 to February 2004 we observed three of the targets with the IRAM (Institut de Radio Astronomie Millimetrique) 30-m telescope at Pico Veleta, Spain. We used two 3-mm SIS receivers (A100 and B100), tuned to the redshifted frequencies of the molecular transitions (see Table 3.1). The observations were done with a nutating subreflector, switching symmetrically in azimuth with a frequency of 0.5 Hz. The continuum levels of the observed sources were determined using a continuum backend and increasing the subreflector switch frequency to 2 Hz. The image sideband rejection of the receivers were high, of the order of 20 dB (single sideband). System temperatures typically ranged from 120 K (90 GHz) to 180 K (113 GHz). We used the full 1 GHz backend with broad (1MHz) filterbanks and narrow band autocorrelators, the former giving a channel spacing of (Table 3.1) over a bandwidth of , which should be sufficient to cover uncertainties in the emission redshifts, all of which are known to at least three decimal places ( corresponds to for our sample). The pointing of the telescope was checked regularly on nearby continuum sources. Typical pointing corrections were . The focus was checked regularly on Mars and Saturn. The Half Power Beam Width (HPBW) at 95 GHz is .
We prioritised the three targets according to the 3-mm flux densities estimated from an interpolation of the decimetre and near-infrared values: 12.8 hours of integration on 0500+019 ( Jy), 13.6 hours on 1430–155 ( Jy) and 7.2 hours on 1504–166 ( Jy), which, upon comparison with the observed values (Table 3.1), were reasonable estimates. The data were reduced with the gildas666http://www.iram.fr/IRAMFR/GILDAS/ software package.
2.3 The NRO 45-m observations
The remainder of the sample was observed with the Nobeyama Radio Observatory’s 45-m telescope in March 2004. We used the H28/32 (1-cm) and the S80, S100 (3-mm) receivers to observe the and transitions over a range of redshifts (Table 3.1). The observations were performed in position switching mode, with an integration time of 20 s for each scan. The antenna temperature, , was obtained by the chopper-wheel method, which corrected for atmospheric and ohmic losses. System temperatures typically ranged from 200 K (1-cm) to 500 K (3-mm). We used the AOS backend over 250 MHz split over 2048 channels, which gave channel spacings of 0.37 (3-mm) to 1.1 (1-cm) with bandwidths of and , respectively. The pointing of the telescope was checked by observing SiO maser sources with the H40 (40 GHz band) receiver and the corrections were .
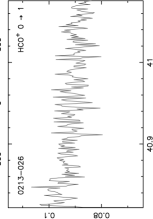
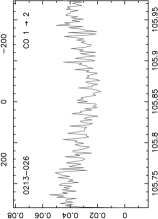
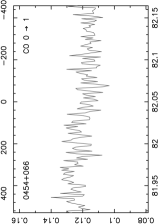
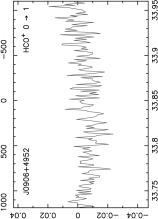
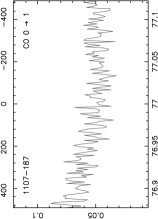
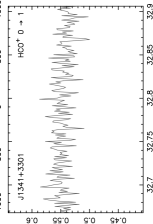
The 3-mm observations were performed when the weather was clearest, with total integration times of 2 hours for 0213–026, 5 hours for 0454+066, 3.7 hours for 1107–187 and 8.5 hours for 1706+006 (for which we could not determine the flux density, Fig. 2)777The highest frequency flux measurement available for 1706+006 is 0.44 Jy at 5.0 GHz (Wright & Otrupcek, 1990).. During less than ideal weather conditions, we observed in the 1-cm band and included the radio detected, optically dim sources of Glikman et al. (2004), where HCO+ is redshifted into this band — the FIRST–2MASS reddened quasars J0906+4952 (SDSS J090651.49+495235.9) and FTM J1341+3301. The data were reduced with the newstar package and, like the IRAM results, upon the removal of a low order baseline and smoothing no absorption features were apparent in the spectra.
3 Results
3.1 Observational results
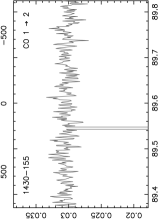
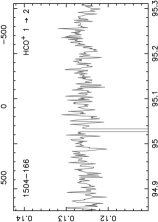
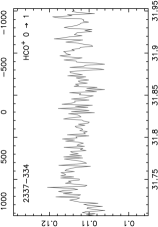
![[Uncaptioned image]](/html/1106.0578/assets/x12.png)
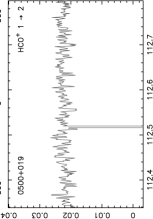
In Fig. 2 we show the reduced spectra and in Table 3.1 we summarise our observational results. The limit to the total column density of each molecule is calculated from
| (1) |
where is the rest frequency of the transition, and are the statistical weight and the Einstein A-coefficient of the transition, respectively, and is the partition function888The Einstein A-coefficients are taken from Chandra et al. (1995, 1996) or derived from the permanent electric dipole moment of the molecule, obtained from the JPL Spectral Line Catalog (Pickett et al., 1998), along with the energy of each level, . An on-line column density calculator based on Equation 1 is available from http://www.phys.unsw.edu.au/sjc/column/. In the case of the four known systems, the covering factor is expected to be close to unity (Wiklind & Combes, 1994, 1995, 1996b, 1998) so, as in the optically thin regime, this can be written outside of the integral. However, unlike lower frequency searches (e.g. OH 18-cm, ), in the millimetre regime even low excitation temperatures give and so the column density cannot be approximated via a linear dependence on this. Therefore, unlike the decimetre searches for associated absorption (Curran et al., 2006, 2008, 2011a), we must assume an excitation temperature.
In Table 2 we apply Equation 1 to the velocity integrated optical depths given in the references in order to derive the column densities and excitation temperatures of the four known systems.
| System | Reference | CO | HCO+ | |||
|---|---|---|---|---|---|---|
| [K] | [] | [K] | [] | |||
| 0218357 | 0.68466 | Wiklind & Combes (1995) | 9 | – | ||
| 1413135 | 0.24671 | Wiklind & Combes (1997) | – | 8 | ||
| 1504377 | 0.67335 | Wiklind & Combes (1996b) | 16 | 13 | ||
| 1830211 | 0.88582 | Wiklind & Combes (1996a, 1998) | – | 8 | ||
These are found to be close to those derived by Wiklind & Combes (1995, 1996a, 1996b, 1997) and so for our targets we adopt an excitation temperature of K at .
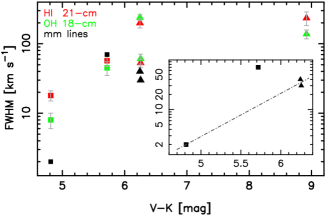
Although the excitation temperatures are similar, the four known millimetre absorbers exhibit a range of full-width half maxima (FWHMs), ranging from FWHM (1413+135, Wiklind & Combes 1997) to (the main component towards 1504+377, Wiklind & Combes 1996b). For these, plus the absorber towards 0132–097 (Sect. 1), it has been shown that the OH 18-cm () FWHMs are similar to those of the H i 21-cm profiles (Curran et al., 2007), although we cannot yet unambiguously state that millimetre widths are correlated with those of the decimetre lines (Fig. 3).
In any case, of all of our targets, only one (0500+019) has been detected in 21-cm absorption (see table 6 of Curran et al. 2008 and Sect. 4.2), and so we would have no information on what the width of each of the undetected lines should be. If this were known, we would smooth the spectral resolution () of the data to the FWHM of the line, thus giving the best possible optical depth limit, based upon the detection of absorption in a single channel. Multiplying the resulting optical depth, scales the velocity integrated optical depth to , giving an overall scaling of .
Choosing either the minimum and maximum FWHM of the four known absorbers, therefore gives a possible range in scaling factors of , and so the choice of either FWHM or could lead to a significant over/under-estimate in the profile width. We therefore use the optical–near-infrared colour, which appears to be correlated with the profile width in the four known systems (Fig. 3)999This suggests that the path length through the dust responsible for the reddening may be correlated with the orientation of a rotating cloud complex, such as the disk of a galaxy (Curran & Whiting, in prep.). There is a 1% probability of this correlation arising by chance (for H i, Fig. 3), i.e. a significance assuming Gaussian statistics., in order to estimate what the FWHM of an undetected absorber should be.
As seen from the figure, the associated absorber in 1504+377 represents a stray point with a FWHM of . We therefore estimate the profile widths from the least-squares-fit to the other three systems (shown in the inset of Fig. 3). The fact that this is based upon only three points, with the removal of one which we simply do not like, limits the robustness of this method, although it should give a better handle on the profile width than a simple assumption. We therefore use this fit, (for ), to estimate the column density limits (given in Table 3.1).101010In order to guard against over-compensating, we use the minimum and maximum observed profile widths of 2 and 70 in cases where the estimated FWHMs are less or greater than these limiting values.
3.2 Comparisons with the known high redshift molecular absorbers
In Fig. 4 we show the CO and HCO+ column densities
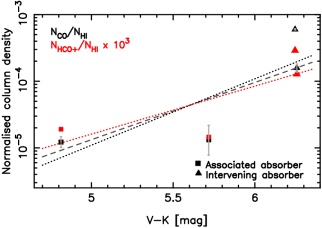
normalised by that of the H i 21-cm (from Carilli et al. 1992, 1993; Carilli et al. 1998; Chengalur et al. 1999) against the optical–near-IR colour, for the four known millimetre absorbers. From this it is difficult to ascertain whether there is a correlation between the normalised millimetre-wave column density and the colour, as is found for the normalised OH column densities in Curran et al. (2006) [Fig. 1]. Furthermore, 21-cm line strengths are not available for the sample although in Curran et al. (2006) there was still a, albeit more scattered, correlation between the un-normalised OH column density and the colour, which appears to apply to all of the molecular absorbers (Fig. 1, top). Therefore in Fig. 5 we show the un-normalised CO and HCO+ column densities against the colour for our targets, as well as those from previous searches of associated molecular absorption (Wiklind & Combes, 1995, 1996b; Drinkwater et al., 1996; Murphy et al., 2003; Curran et al., 2008).111111In the plots we give Wiklind & Combes (1995, 1996b); Drinkwater et al. (1996) the same colour as the latter paper includes some of the results of the first two.
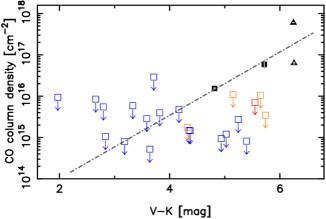
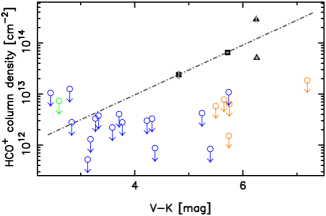
From these, we see that many of the limits (especially the new ones reported in this paper, shown in orange), should be more than sufficient to detect molecular absorption, particularly HCO+. Incorporating the upper limits of the column densities, via the asurv survival analysis package (Isobe et al., 1986), gives Kendall’s two-sided probabilities of () [i.e a significance of for CO]121212 Bearing in mind that these limits are subject to the FWHM estimates (Sect. 3.1), we have also derived the probabilities when applying the two FWHM extrema of the detected absorbers, 2 and 70 . Not generally being as red as the detected sample, the values do not change for FWHM , and for 70 , & (). and () [ for HCO+]131313 Again, applying FWHM introduces no change to the correlation and & (). of the column density–colour correlations occuring by chance. For the five known OH absorbers, (Curran et al., 2011a), which falls to for those four detected in millimetre transitions.141414 for the five known OH absorbers plus the OH limits (Curran et al., 2011a). So although the search results do not lessen the significance of the column density–colour correlations (but actually increase them), many of the limits are below those expected for a detection and so we discuss other possible reasons as to why millimetre-wave spectral lines were undetected in this and the previous surveys.
4 Discussion: Possible explanations for these and the previous non-detections
4.1 Millimetre-wave covering factors
While there is an apparent correlation between the normalised column density and the optical–near infrared colour, Fig. 1 actually shows the ratio of the OH 18-cm velocity integrated optical depth to that of the H i 21-cm. Therefore in order for the fit to be accurate for the normalised column densities, the four known millimetre absorbers must also have similar spin and excitation temperatures, as well as H i and OH covering factors (or at least a similar ratio of these quantities). While the excitation temperatures can be well constrained from the millimetre transitions (Table 2) and the spin temperatures can be removed by not normalising the column densities (Fig. 4 cf. 5), the covering factor, , is ingrained into the optical depth via, . Since the CO and HCO+ lines are optically thick in the four known systems, , thus not allowing to be taken outside of the integral in Equation 1, although, as noted in Sect. 3.1, if this would have little effect.
In any case, the correlation shown in Fig. 4 does not hold for all five of the absorbers: Towards the quasar PMN J0134–0931 (0132–097), Kanekar et al. (2005) detected OH at a column density of in the intervening gravitational lens, although HCO+ was undetected to . This gives a column density ratio of . Curran et al. (2007) have suggested that the non-detection of millimetre absorption towards 0132–097 could be a geometrical effect, where a molecular cloud has a much larger chance of occulting the lower frequencies, since the decimetre emission region is likely to be much larger than the millimetre region (as may also be exhibited by the wider decimetre profiles, Fig. 3). That is, the narrower millimetre emission is less likely to intercept the CO and HCO+ gas which will be localised in dense molecular cores. The fact that the millimetre and decimetre emission, and thus absorption, trace different components of the gas could be responsible for the significance of the correlation with colour not changing when normalising the millimetre column densities by that of the H i (Sect. 3.2).
In the case of 0132–097 , the possibility that the core of the absorbing molecular gas is offset from the centre of the emission may also result in a reduction of the decimetre covering factor, which could be the cause of the normalised OH line strength in 0132–097 not being as high as expected from its colour (i.e. below the fit defined by the others in Fig. 1, right), although more absorbers would be required to verify this.
4.2 Location of the absorbing gas
From the fact that, of our sample, H i has only been detected in 0500+019151515As well as a possible detection towards 1107–187, which at (Curran et al., 2011a), is not covered by the 76.88–77.12 GHz () range observed here (Fig. 2). 0213–026, 1504–166 and 1706+006 are undetected in 21-cm (Curran et al., 2011a), with the remainder of the sample as yet unsearched (see tables 1 & 2 of Curran & Whiting 2010). we may be incorrect in our assumption that the host galaxy is generally the location of the quasar reddening, as it is for only two of the five known OH absorbers. As is the case for the remaining three of the known systems, the absorption (and thus the cause of the reddening) could be occuring anywhere between us and the emission redshift of the quasar. Unfortunately, full range spectral scans are not feasible towards most sources with current instruments and, over the ranges which are scanned, there is a trade-off between the redshift space which can be covered and the depth of the search. Thus our motivation for searching for molecular absorption within the host galaxy. Spectral scans have, however, been attempted (Murphy et al., 2003; Curran et al., 2005), with 0500+019 being one of the targets common to ours. We summarise the results in Table 3,
| Quasar | HCO+ | CO | ||||||||
|---|---|---|---|---|---|---|---|---|---|---|
| Trans. | -range | [] | Trans. | -range | [] | |||||
| 0500+019 | 21.2 | 0.58457 | 0.1025–0.1391 | 0.063 | 0.4249–0.4722 | 0.081 | ||||
| … | … | … | 0.0311–0.0431 | 0.021 | 0.3326–0.3482 | 0.027 | ||||
| … | … | … | 0.5771–0.5846 | 0.013 | 0.0192–0.0283 | 0.016 | ||||
| … | … | … | 0.2615–0.3721 | 0.189 | — | — | — | — | ||
| 0727–115 | 22.5 | 1.591 | 0.1025–0.1391 | 0.023 | 0.4249–0.4722 | 0.030 | ||||
| … | … | … | 1.2049–1.2781 | 0.046 | — | — | — | — | ||
| … | … | … | 0–0.0630 | 0.040 | 0.2737–0.3739 | 0.063 | ||||
| … | … | … | 0.9710–1.1260 | 0.097 | 1.5474–1.7478 | 0.027 | ||||
| … | … | … | 0.2615–0.2926 | 0.020 | 0.6304–0.6706 | 0.025 | ||||
| … | … | … | 0.8922–0.9388 | 0.029 | 1.4455–1.5058 | 0.038 | ||||
| … | … | … | 1.5229–1.5850 | 0.039 | — | — | — | — | ||
| … | … | … | 0.2004–0.2491 | 0.031 | 0.5514–0.6144 | 0.040 | ||||
| … | … | … | 0.8005–0.8737 | 0.046 | 1.3270–1.4215 | 0.059 | ||||
| … | … | … | 1.4006–1.4981 | 0.061 | — | — | — | — | ||
from which we see that of the redshift space towards 0500+019 has been scanned for HCO+ and only 12% for CO, with some overlap in these ranges. We therefore cannot rule out that the cause of the reddening may be at some other redshift towards 0500+019 and indeed for the rest of the sample.
There is also the possibility that, even if the reddening (and hence any absorption) is located at the host, it would only be detected if the optical redshift is known precisely enough to ensure that the observed band covers the correct redshift range. The optical spectra of these quasars have spectral resolutions of Å, which corresponds to a few hundred , which is close to our observed bandwidths (Fig. 2). However, most of the quasars observed here have have strong narrow emission lines, which constrain the redshift to better than and all are quoted to at least the third decimal place, although uncertainties are usually not given (Drinkwater et al., 1997). Referring to the ranges covered by our observed bands (Table 3.1), we see that offsets of (at low redshifts) to (at high redshifts) are covered, thus making it unlikely that our observations are generally tuned to the wrong frequency.
4.3 Conditions within the host
Above we suggest the possibility that molecular absorption is not detected since the reddening of the quasar light may not necessarily be occuring close to the redshift of the background quasar. Over and above this, there is the possibility that a large column of absorbing molecular gas cannot be located in the host galaxy on the basis that the there is a low fraction of cool neutral gas in the hosts of quasars and radio galaxies with ultra-violet luminosities of W Hz-1 (Curran et al. 2008). Whether this is due to excitation of the gas or these luminosities selecting gas-poor ellipticals (or indeed whether these two possibilities are inter-related, Curran & Whiting 2010), this appears to be the case for all redshifted () H i 21-cm absorption searches.
| Quasar | Molecules | Ref | Refs | |||||
|---|---|---|---|---|---|---|---|---|
| 4C +40.01 | 0.255 | CO, HCO+ | W96 | 17.89 | 17.67 | 14.87 | Z04,S06 | 22.34 |
| PKS 0113–118 | 0.672 | CO, HCO+ | D96 | 18.27 | 17.95 | 14.37 | Z04 | 23.11 |
| PKS 0213–026 | 1.178 | CO, HCO+ | C11 | 21.33 | 20.82 | 15.17 | F00 | 22.12 |
| [HB89] 0234+285 | 1.213 | CO | W95 | 19.20 | 18.35 | 13.33 | A09, S06 | 23.37 |
| PKS 0335–122 | 3.442 | HCN | D96 | 21.02 | 20.11 | 17.51 | E05,H01 | 23.92 |
| [HB89] 0422+004 | 0.310 | CO, HCO+, HCN | D96 | 13.89 | 14.12 | 11.31 | F04 | 24.55 |
| PKS 0434–188 | 2.702 | HCO+, HCN | C08 | 19.25 | — | 16.24 | E05 | 24.14 |
| PKS 0438–436 | 2.852 | CO | D96 | 20.74 | 19.91 | 16.09 | B04,E05 | 23.77 |
| PKS 0446+11 | 1.207 | CO | W96 | 21.43 | 20.36 | 15.37 | A09,S06 | 22.17 |
| PKS 0454+06 | 0.405 | CO | C11 | 19.38 | 18.74 | 14.42 | F00 | 21.57 |
| PKS 0500+019 | 0.58457 | HCO+ | C11 | 22.50 | 21.35 | 15.6 | D97,C03,S96b | 20.38 |
| PKS 0521–365 | 0.0552 | HCO+ | D96 | 15.60 | 14.60 | 11.33 | H07,S06 | 21.96 |
| PKS 0528+134 | 2.065 | CO | W95 | 20.09 | 20.00 | 15.06 | Z04,G00 | 23.51 |
| [HB89] 0537–441 | 0.894 | CO, HCO+,HCN,CS | D96 | 17.93 | 17.34 | 13.02 | F00 | 23.28 |
| PKS 0601–17 | 2.711 | HCO+, HCN | C08 | 20.45 | — | — | H01 | 23.66 |
| CGRaBS J0650+6001 | 0.455 | CO | W96 | 20.85 | — | 14.63 | Z04,S06 | 21.03 |
| PKS 0727–115 | 1.591 | CO | M03 | 21.13 | 20.07 | 14.52 | A09,C03 | 22.42 |
| [HB89] 0735+178 | 0.424 | CO | W95 | 16.30 | 15.68 | 13.03 | A09,S06 | 23.17 |
| PKS 0823-223 | 0.9103 | HCO+ | W96 | — | 16.11 | 12.34 | F93 | 23.51 |
| Hydra A | 0.0538 | CO, HCO+ | D96 | 13.90 | 12.87 | 10.90 | V91,C03 | 23.89 |
| [HB89] 0954+658 | 0.368 | CO, HCO+ | W96 | 17.18 | 16.80 | 12.43 | P04,S06 | 22.92 |
| PKS 1026–084 | 4.276 | CO | C08 | 21.07 | — | — | H01 | 24.31 |
| PKS 1107–187 | 0.497 | CO | C11 | 22.44 | 21.10 | 15.95 | F00 | 19.16 |
| FTM J1341+3301 | 1.720 | HCO+ | C11 | 23.39 | 21.68 | 14.49 | A09,G07 | 22.36 |
| SBS 1347+539B | 0.978 | HCO+ | W96 | 17.95 | 17.52 | 15.07 | A09,S06 | 23.72 |
| [HB89] 1418+546 | 0.152 | CO | W96 | 16.25 | 15.60 | 11.43 | A09,S06 | 22.18 |
| PKS 1430–155 | 1.573 | CO | C11 | 22.50 | 23.24 | 17.50 | D97,F00 | 21.79 |
| 3C 309.1 | 0.905 | CO | W96 | 16.80 | 16.57 | 14.72 | Z04,S06 | 24.27 |
| PKS 1504–167 | 0.876 | HCO+ | C11 | 20.28 | 19.75 | 14.01 | F00 | 22.36 |
| PKS 1548+056 | 1.422 | CO | D96 | 19.37 | 18.65 | 14.30 | F00 | 23.21 |
| PKS 1555+001 | 1.77 | CO, HCO+ | D96 | 20.34 | 19.95 | 16.24 | F00 | 23.33 |
| PKS 1622–253 | 0.786 | HCO+ | W96 | — | 20.6 | 14.86 | d94,S06 | 22.12 |
| PKS 1622–29 | 0.815 | HCO+ | W96 | — | 18.38 | 14.15 | R02,S06 | 22.83 |
| PKS 1725+044 | 0.296 | CO, HCO+ | D96 | 17.92 | 17.46 | 14.13 | F00 | 22.06 |
| [HB89] 1749+096 | 0.322 | CO, HCO+ | W96 | 17.98 | 17.39 | 12.00 | O09,S06 | 21.87 |
| [HB89] 1823+568 | 0.664 | CO, HCO+ | W96 | 17.41 | 17.02 | 13.84 | Z04,S06 | 23.18 |
| Cygnus A | 0.0561 | CO, HCO+ | D96 | 17.04 | 15.52 | 10.28 | V91,C03 | 20.78 |
| CGRaB J2022+6136 | 0.228 | HCO+ | W96 | 19.55 | 17.97 | 14.28 | Z04,S06 | 20.19 |
| [HB89] 2200+420 | 0.688 | CO, HCO+ | W96 | 13.25 | 13.32 | 10.49 | F04,S06 | 25.34 |
| PKS 2223–052 | 1.404 | CO | D96 | 18.59 | 18.33 | 14.69 | F00 | 23.69 |
| 3C 454.3 | 0.859 | HCO+ | W95 | 16.03 | 16.19 | 13.06 | Z04,S06 | 24.11 |
| PKS 2329–162 | 1.155 | CO | D96 | 20.72 | — | 16.58 | H01,W83 | 22.72 |
| PKS 2337–334 | 1.802 | HCO+ | C11 | 22.93 | 21.89 | 16.39 | F00 | 22.05 |
| PKS 1413+135 | 0.246710 | CO, HCO+, HCN, HNC | W97 | 21.37 | 19.74 | 14.93 | A09,S06 | 19.41 |
| B3 1504+377 | 0.67150 | CO, HCO+, HCN, HNC | W96 | 23.24 | 21.82 | 16.10 | A09,S96a | 19.81 |
Molecular search references: D96 – Drinkwater et al. (1996), W95 – Wiklind & Combes (1995), W96 – Wiklind & Combes (1996b), W97 – Wiklind & Combes (1997), M03 – Murphy et al. (2003), C08 – Curran et al. (2008), C11 – this paper.
Photometry references: W83 – Wright et al. (1983), F93 – Falomo et al. (1993), d94 – di Serego-Alighieri et al. (1994), S96a – Stickel et al. (1996a), S96b – Stickel et al. (1996b), D97 – Drinkwater et al. (1997), F00 – Francis et al. (2000), G00 – Ghosh et al. (2000), E01 – Ellison et al. (2001), H01 – SuperCOSMOS Sky Survey (Hambly et al., 2001), R02 – Romero et al. (2002), C03 – Cody & Braun (2003), B04 – Brocksopp et al. (2004), F04 – Fiorucci et al. (2004), P04 – Papadakis et al. (2004), Z04 – Zacharias et al. (2004), E05 – Ellison et al. (2005), S06 – 2MASS (Skrutskie et al., 2006), A09 – SDDS DR7(Abazajian et al., 2009), O09 – Ojha et al. (2009), FPC – P. Francis (priv. comm.).
In order to investigate whether this could affect our sample, we use the photometry of the searched sources (Table 4) to derive the UV luminosities (as per Curran et al. 2008). Showing these in Fig. 6,
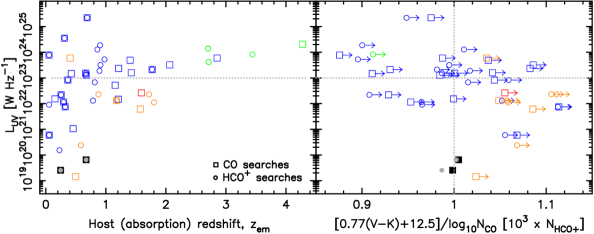
we see the expected increase in luminosity with redshift and note that our selection of the reddest PHFS sources (Sect.2.1) means that nearly all of our targets lie below W Hz-1 (left panel). Since we are unlikely to detect molecular absorption in an environment not conducive to large columns of cool neutral gas, in the right panel of Fig. 6 we show the UV luminosity versus the colour depth, which we define as the optical–near-infrared colour normalised by the depth of the search. As expected from the column density— correlation (Fig. 4), this gives a vertical line with this quantity plotted as the abscissa161616Adding the three intervening absorbers gives a colour depth of for both and . The intervening absorbers are not shown in the plot as, although the ultra-violet luminosities can also be estimated, these are remote from the source. and from this definition we see that 20 discrete sources (mostly from this work) have been searched sufficiently deeply, of which only 12 are located in the bottom right quadrant defined by W Hz-1 and a colour depth .
As expected, in Fig. 6 (right) there is an anti-correlation between the UV luminosity and colour, since the former is derived from the observed frame optical photometry. As such, there is also the possibility that the calculated values of are influenced by the dust extinction towards the source. However, the fact that 21-cm absorption is never detected above a critical luminosity (or below a critical magnitude/dust extinction), as well as the correlation between the 21-cm absorption strength and colour (Curran & Whiting, 2010), indicates that the extinction occurs within the host in the case of the 21-cm detections, which follow the expected 50% detection rate for W Hz-1 (Curran & Whiting, 2010). Therefore, whether due to high intrinsic UV luminosities or a paucity of dust within the host galaxy, it remains that 21-cm absorption is not detected where W Hz-1 and where we do not detect 21-cm we do not expect to detect absorption by molecular gas.
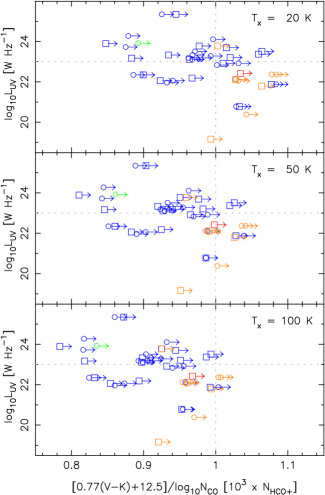
Lastly, as well as a covering factor of , as per the four known systems, we have assumed an excitation temperature of K (at ) [Sect. 4.1]. Since there is no apparent correlation between the optical–near-infrared colour and the excitation temperature for the four known systems (Table 2)171717For 1413135, and K, similar to the excitation temperature of 1830211 with ., we cannot estimate temperatures for any of the searched sample. If the gas were at higher excitation temperatures, being mostly observations of the lower rotational transitions (Table 3.1), the limits are less sensitive than quoted since a larger total column density would be required to give the same observed flux in these transitions. This has the effect of worsening the limits to the point where only two of the searched sources are (just) potentially detectable when K (Fig. 7), although if the gas is diffuse, such excitation temperatures may not be attainable, even in the presence of high kinetic temperatures.
5 Summary
We have undertaken a survey for molecular absorption in the millimetre-band at high redshift. Like all previous surveys (since Wiklind & Combes 1995, 1996a, 1996b, 1997), we have not detected millimetre-band spectral line absorption in any of the targets. In the case of absorption due to intervening sources, it has been established that the paucity of detections is due to the traditional optical selection of these objects, in which the redshift of the intervening object is usually known, biasing against the reddest, and thus dustiest, absorption complexes (Curran et al. 2006). We have therefore aimed to circumvent this bias, by searching for molecular absorption within the hosts of particularly red objects, although like Drinkwater et al. (1996), who also targetted red sources (and type-2 AGN)181818Although as Curran & Whiting (2010) have shown, the bulk cool neutral gas (as traced by H i 21-cm absorption) is not located in the obscuring torus, invoked by unified schemes of active galactic nuclei., we find no absorption.
A possible reason for some of the non-detections is that only 12 of the 40 objects searched are known to be located in the bottom right quadrant of the ultra-violet luminosity–colour depth plot (Fig. 6, right), i.e. where W Hz-1 and . This suggests that only a dozen of the sources may be subject to an ultra-violet flux which permits the presence of cool neutral gas (Curran et al., 2008), while being “sufficiently red” to indicate the presence of a large column of dust along the sight-line to the quasar (Curran et al., 2006). Given that:
-
–
For these, the reddening could be occuring anywhere along the line-of-sight, and not necessarily in the host galaxy, as is the case for three of the five known OH absorbers (four of which make up all the known redshifted millimetre-band absorbers). The only reason we chose to observe the emission redshift is that it gives a frequency to which to tune the receiver – Murphy et al. (2003); Curran et al. (2005) previously attempted millimetre-wave spectral scans towards very dim objects, but the redshift range scanned is a trade-off with the time spent on each frequency, resulting in poor optical depth limits over what were limited redshift ranges in only a few sources.
-
–
This fifth absorber, which was detected in OH but not HCO+, may be the result of lower millimetre-wave covering factors in comparison to those at decimetre wavelengths (Curran et al., 2007). This may be analogous to the effect seen in the optically selected DLAs (Sect. 1), where, due to the steeper cosmological evolution in the heavy element abundance in the -bearing DLAs, Curran et al. (2004) suggest that these constitute a more homogeneous class of objects than the general population DLA (Prochaska et al., 2003). That is, absorption may only be observed in a limited subset of possible sight-lines and Zwaan & Prochaska (2006) suggest that a distinction could arise from the much smaller cross-section of the molecular gas, located in small and dense regions (e.g. Liszt & Lucas 1996), in comparison to that of the atomic gas. This means that only a narrow sight-line will occult the quasar, although the DLA may be apparent through the more widespread 21-cm absorption.
-
–
As well as covering factor effects, if the excitation temperature of the putative absorbing gas is higher than the assumed K (at ), the column density limits are poorer than those calculated here. If large enough ( K), none of these searches, mostly of the lower rotational transitions, have been sensitive enough to detect CO or HCO+ absorption in these sources, although the absorbing medium may be too diffuse to reach such temperatures through collisional excitation.
Drinkwater et al. (1996) accounted for their non-detections by suggesting that the extinction may be occuring outwith the host galaxy or that the X-ray flux from the AGN may be photo-dissociating the molecules. These possibilities are similar to the points made above, although by quantifying these via the findings of Curran et al. (2006, 2008), we find that not all of the targets of Drinkwater et al. (1996) are sufficiently faint and reddened to have been detected, no matter the location of the obscuring material. Therefore, the key to finding new redshifted molecular absorbers in the millimetre-band is through the selection of the faintest optical objects (giving W Hz-1) and performing spectral scans towards these to colour depth limits of , as defined by the column densities and colours of the four known absorbers. In order to also circumvent the covering factor effect, pilot searches for OH in the decimetre band could be undertaken, with the low rest frequency (1667 MHz) allowing a full spectral scan in only four separate tunings with the Square Kilometre Array (Curran et al., 2004a).
Acknowledgements
We would like to thank A. Weiss for assisting with the IRAM observations, as well as Shigeru Takahashi, Jun Maekawa and Hiroki Ashizawa of Nobeyama Radio Observatory for their assistance in installing newstar and the data retrieval. MTM thanks the STFC for an Advanced Fellowship and the Australian Research Council for a QEII Research Fellowship (DP0877998).
We acknowledge financial support from the Access to Major Research Facilities Programme which is a component of the International Science Linkages Programme established under the Australian Government’s innovation statement, Backing Australia’s Ability.
This research has made use of the NASA/IPAC Extragalactic Database (NED) which is operated by the Jet Propulsion Laboratory, California Institute of Technology, under contract with the National Aeronautics and Space Administration. This research has also made use of NASA’s Astrophysics Data System Bibliographic Services and asurv Rev 1.2 (Lavalley et al., 1992), which implements the methods presented in Isobe et al. (1986).
Funding for the Sloan Digital Sky Survey (SDSS) and SDSS-II has been provided by the Alfred P. Sloan Foundation, the Participating Institutions, the National Science Foundation, the U.S. Department of Energy, the National Aeronautics and Space Administration, the Japanese Monbukagakusho, and the Max Planck Society, and the Higher Education Funding Council for England. The SDSS Web site is http://www.sdss.org/.
References
- Abazajian et al. (2009) Abazajian K. N., Adelman-McCarthy J. K., Agüeros M. A., et al., 2009, ApJS, 182, 543
- Becker et al. (1995) Becker R. H., White R. L., Helfand D. J., 1995, ApJ, 450, 559
- Brocksopp et al. (2004) Brocksopp C., Puchnarewicz E. M., Mason K. O., Córdova F. A., Priedhorsky W. C., 2004, MNRAS, 349, 687
- Carilli et al. (1998) Carilli C. L., Menten K. M., Reid M. J., Rupen M. P., Yun M. S., 1998, ApJ, 494, 175
- Carilli et al. (1992) Carilli C. L., Perlman E. S., Stocke J. T., 1992, ApJ, 400, L13
- Carilli et al. (1993) Carilli C. L., Rupen M. P., Yanny B., 1993, ApJ, 412, L59
- Chandra et al. (1995) Chandra S., Kegel W. H., Roy R. J. L., Hertenstein T., 1995, A&AS, 114, 175
- Chandra et al. (1996) Chandra S., Maheshwari V. U., Sharma A. K., 1996, A&AS, 117, 557
- Chengalur et al. (1999) Chengalur J. N., de Bruyn A. G., Narasimha D., 1999, A&A, 343, L79
- Cody & Braun (2003) Cody A. M., Braun R., 2003, A&A, 400, 871
- Curran et al. (2007) Curran S. J., Darling J. K., Bolatto A. D., Whiting M. T., Bignell C., Webb J. K., 2007, MNRAS, 382, L11
- Curran et al. (2004a) Curran S. J., Kanekar N., Darling J. K., 2004a, Science with the Square Kilometer Array, New Astronomy Reviews 48. Elsevier, Amsterdam, pp 1095–1105
- Curran et al. (2004b) Curran S. J., Murphy M. T., Pihlström Y. M., Webb J. K., Bolatto A. D., Bower G. C., 2004b, MNRAS, 352, 563
- Curran et al. (2004) Curran S. J., Webb J. K., Murphy M. T., Carswell R. F., 2004, MNRAS, 351, L24
- Curran et al. (2005) Curran S. J., Webb J. K., Murphy M. T., Kuno N., 2005, in Engvold. O., ed., Highlights of Astronomy, Vol. 13, as presented at the XXVth General Assembly of the IAU - 2003 Deep searches for high redshift molecular absorption. ASP Conf. Ser., San Francisco, pp 845 – 847
- Curran et al. (2011a) Curran S. J., Whiting M., Murphy M. T., et al., 2011a, MNRAS, 413, 1165
- Curran et al. (2006) Curran S. J., Whiting M., Murphy M. T., Webb J. K., Longmore S. N., Pihlström Y. M., Athreya R., Blake C., 2006, MNRAS, 371, 431
- Curran & Whiting (2010) Curran S. J., Whiting M. T., 2010, ApJ, 712, 303
- Curran et al. (2011b) Curran S. J., Whiting M. T., Tanna A., Bignell C., Webb J. K., 2011b, MNRAS, 413, L86
- Curran et al. (2008) Curran S. J., Whiting M. T., Wiklind T., Webb J. K., Murphy M. T., Purcell C. R., 2008, MNRAS, 391, 765
- di Serego-Alighieri et al. (1994) di Serego-Alighieri S., Danziger I. J., Morganti R., Tadhunter C. N., 1994, MNRAS, 269, 998
- Drinkwater et al. (1996) Drinkwater M. J., Combes F., Wiklind T., 1996, A&A, 312, 771
- Drinkwater et al. (1997) Drinkwater M. J., Webster R. L., Francis P. J., et al., 1997, MNRAS, 284, 85
- Ellison et al. (2005) Ellison S. L., Hall P. B., Lira P., 2005, AJ, 130, 1345
- Ellison et al. (2001) Ellison S. L., Yan L., Hook I. M., Pettini M., Wall J. V., Shaver P., 2001, A&A, 379, 393
- Falomo et al. (1993) Falomo R., Bersanelli M., Bouchet P., Tanzi E. G., 1993, AJ, 106, 11
- Fiorucci et al. (2004) Fiorucci M., Ciprini S., Tosti G., 2004, A&A, 419, 25
- Francis et al. (2000) Francis P. J., Whiting M. T., Webster R. L., 2000, PASA, 17, 56
- Fukugita et al. (1996) Fukugita M., Ichikawa T., Gunn J. E., Doi M., Shimasaku K., Schneider D. P., 1996, AJ, 111, 1748
- Ghosh et al. (2000) Ghosh K. K., Ramsey B. D., Sadun A. C., Soundararajaperumal S., 2000, ApJS, 127, 11
- Glikman et al. (2004) Glikman E., Gregg M. D., Lacy M., Helfand D. J., Becker R. H., White R. L., 2004, ApJ, 607, 60
- Hambly et al. (2001) Hambly N., MacGillivray H., Read M., et al., 2001, MNRAS, 326, 1279
- Isobe et al. (1986) Isobe T., Feigelson E., Nelson P., 1986, ApJ, 306, 490
- Jorgenson et al. (2009) Jorgenson R. A., Wolfe A. M., Prochaska J. X., Carswell R. F., 2009, ApJ, 704, 247
- Kanekar et al. (2005) Kanekar N., Carilli C. L., Langston G. I., et al., 2005, PhRvL, 95, 261301
- Lavalley et al. (1992) Lavalley M. P., Isobe T., Feigelson E. D., 1992, in BAAS Vol. 24, ASURV, Pennsylvania State University. Report for the period Jan 1990 - Feb 1992.. pp 839–840
- Liszt & Lucas (1996) Liszt H., Lucas R., 1996, A&A, 314, 917
- Murphy et al. (2003) Murphy M. T., Curran S. J., Webb J. K., 2003, MNRAS, 342, 830
- Noterdaeme et al. (2008) Noterdaeme P., Ledoux C., Petitjean P., Srianand R., 2008, A&A, 481, 327
- Ojha et al. (2009) Ojha R., Zacharias N., Hennessy G. S., Gaume R. A., Johnston K. J., 2009, AJ, 138, 845
- Papadakis et al. (2004) Papadakis I. E., Samaritakis V., Boumis P., Papamastorakis J., 2004, A&A, 426, 437
- Pickett et al. (1998) Pickett H. M., Poynter R. L., Cohen E. A., Delitsky M. L., Pearson J. C., Müller H. S. P., 1998, J. Quant. Spectrosc. Radiat. Transfer, 60, 883
- Prochaska et al. (2003) Prochaska J. X., Gawiser E., Wolfe A. M., Castro S., Djorgovski S. G., 2003, ApJ, 595, L9
- Prochaska et al. (2005) Prochaska J. X., Herbert-Fort S., Wolfe A. M., 2005, ApJ, 635, 123
- Romero et al. (2002) Romero G. E., Cellone S. A., Combi J. A., Andruchow I., 2002, A&A, 390, 431
- Schneider et al. (2007) Schneider D. P., Hall P. B., Richards G. T., et al., 2007, AJ, 134, 102
- Skrutskie et al. (2006) Skrutskie M. F., Cutri R. M., Stiening R., Weinberg M. D., Schneider S., Carpenter J. M., Beichman C., Capps R. . M., 2006, AJ, 131, 1163
- Srianand et al. (2010) Srianand R., Gupta N., Petitjean P., Noterdaeme P., Ledoux C., 2010, MNRAS, p. 1888
- Srianand et al. (2008) Srianand R., Noterdaeme P., Ledoux C., Petitjean P., 2008, A&A, 482, L39
- Stickel et al. (1996a) Stickel M., Rieke G. H., Kühr H., Rieke M. J., 1996a, ApJ, 468, 556
- Stickel et al. (1996b) Stickel M., Rieke M. J., Rieke G. H., Kühr H., 1996b, A&A, 306, 49
- Wiklind & Combes (1994) Wiklind T., Combes F., 1994, A&A, 286, L9
- Wiklind & Combes (1995) Wiklind T., Combes F., 1995, A&A, 299, 382
- Wiklind & Combes (1996a) Wiklind T., Combes F., 1996a, Nat, 379, 139
- Wiklind & Combes (1996b) Wiklind T., Combes F., 1996b, A&A, 315, 86
- Wiklind & Combes (1997) Wiklind T., Combes F., 1997, A&A, 328, 48
- Wiklind & Combes (1998) Wiklind T., Combes F., 1998, ApJ, 500, 129
- Wright & Otrupcek (1990) Wright A., Otrupcek R., 1990, Parkes Catalogue. Australia Telescope National Facility
- Wright et al. (1983) Wright A. E., Ables J. G., Allen D. A., 1983, MNRAS, 205, 793
- Zacharias et al. (2004) Zacharias N., Monet D. G., Levine S. E., Urban S. E., Gaume R., Wycoff G. L., 2004, in Bulletin of the American Astronomical Society Vol. 36 of Bulletin of the American Astronomical Society, The Naval Observatory Merged Astrometric Dataset (NOMAD). p. 1418
- Zwaan & Prochaska (2006) Zwaan M. A., Prochaska J. X., 2006, ApJ, 643, 675