A method for detection of muon induced electromagnetic showers with the ANTARES detector
Abstract
The primary aim of ANTARES is neutrino astronomy with upward going muons created in charged current muon neutrino interactions in the detector and its surroundings. Downward going muons are background for neutrino searches. These muons are the decay products of cosmic-ray collisions in the Earth’s atmosphere far above the detector. This paper presents a method to identify and count electromagnetic showers induced along atmospheric muon tracks with the ANTARES detector. The method is applied to both cosmic muon data and simulations and its applicability to the reconstruction of muon event energies is demonstrated.
keywords:
Neutrino telescope , Electromagnetic shower identification , High energy muons , Energy reconstruction.1 Introduction
The ANTARES neutrino telescope is located at a depth of 2475 m in the Mediterranean Sea, roughly 40 km offshore from Toulon in France. Its main objective is the observation of extraterrestrial neutrinos. Relativistic charged leptons produced by neutrino interactions in and around the detector produce Cherenkov light in the sea water. This light is detected by an array of photomultiplier tubes, allowing the muon direction to be reconstructed.
Although the ANTARES detector is optimised for upward going particle detection, the most abundant signal is due to atmospheric downward going muons [1, 2, 3] produced in the particle showers induced by the interactions of cosmic-rays in the atmosphere. In order to reduce this background the Earth is used as a filter, restricting the search for cosmic neutrinos to sources in the Southern sky.
The processes contributing to the energy loss of a muon in water include ionization, pair production, bremsstrahlung, and photonuclear interactions [4, 5, 6, 7]. Below about 1 TeV, the muon energy loss is dominated by the continuous ionization process. Above about 1 TeV, the muon energy loss is characterised by large energy fluctuations and discrete bursts. These bursts originate from pair production and bremsstrahlung (electromagnetic showers). The photonuclear interaction processes are less frequent and in the following no distinction is made between photonuclear induced showers and electromagnetic showers. The average muon energy loss per unit track length due to these electromagnetic showers increases linearly with the energy of the muon [4].
A reconstruction algorithm is presented to identify electromagnetic showers induced by highly energetic muons with the ANTARES detector. The shower reconstruction algorithm relies on the identification of increased photon emission along the muon trajectory. Counting electromagnetic showers along muon tracks to give an estimate of the muon energy is called the pair meter method [8, 9]. The estimate of the energy of muons is important for many research topics. For example, an alternative method for estimating the energy of muons based on the occurrence rate of repeated measured photons on the photomultiplier tubes [10] has been used by the ANTARES Collaboration to search for a diffuse flux of cosmic high energy muon neutrinos. Moreover, the angular resolution of the muon trajectory could benefit from a precise discrimination of photon emission mechanisms along the estimated track. A similar measurement technique as the one presented in this article has been published recently by the Super-Kamiokande Collaboration and used to select a sample of upward going muons with energies above a TeV [11].
2 The ANTARES detector
The full detector consists of twelve vertical lines approximately m in height equipped with a total of 885 photomultiplier tubes (PMTs). The lines, separated from each other by about m, are anchored to the sea floor by a dead weight and held taut by a buoy located at the top. The instrumented part of the line starts 100 m above the sea floor and consists of 25 floors with a separation distance of 14.5 m along the line. The distance from the highest floor to the sea surface is around 2000 m. A floor consists of three PMTs pointing downward at an angle of with respect to the vertical direction, in order to maximise the detection efficiency of upward going tracks.
ANTARES is operating in the so called all-data-to-shore mode: all signals above a charge threshold (typically 0.3 photoelectrons) are digitised offshore and sent to shore to be processed in a computer farm. This farm applies a set of trigger criteria in order to separate muon-induced Cherenkov light from background light. The main sources of background light are the decay of 40K nuclei and the bioluminescence from organisms in the sea water.
3 Algorithm for shower identification
The technique of the electromagnetic shower identification aims at distinguishing Cherenkov photons emitted continuously along the muon track, hereafter called muon Cherenkov photons, from the Cherenkov photons induced by electromagnetic showers, hereafter called shower photons. Because of the short radiation length in water ( cm), these showers rarely extend more than a few meters and can be considered point-like light sources for the ANTARES detector. The electromagnetic showers are identified by an excess of photons above the continuous baseline of Cherenkov photons emitted by a minimum ionizing muon.
The shower identification algorithm consists of two steps. The first step allows the identification and reconstruction of muon tracks. In the second step, a distinct shower candidate is identified by a cluster of measured photons at a particular point along the muon path. The criteria to isolate this cluster are determined using a simulation code based on Corsika [16].
3.1 Simulation
Cosmic-ray interactions in the atmosphere, including atmospheric shower development, were simulated with Corsika for primary energies between 1 TeV and TeV, and incident angles between zero (vertical downward going) and 85 degrees. The primary cosmic-ray composition and flux model employed is a simplified version of the Hörandel parametrisation111The primary composition of the flux is subdivided into only five mass groups, namely proton, helium, nitrogen, magnesium and iron. [17]. The chosen hadronic interaction model is QGSJET [18]. The result of the Corsika simulation is a set of muon tracks with their position, arrival time and momentum given at the surface of the sea. Typically, a single interaction leads to many muons at the sea surface. These muons are propagated through water. The discrete energy losses at high energies, the Cherenkov light production and propagation, including scattering, and the response of the detector are simulated using a dedicated simulation package [19, 20]. The muon propagation is performed by MUSIC [21] in steps of 1 m. If the energy loss of the muon over the step exceeds a given threshold (1 GeV), an electromagnetic shower is simulated and shower photons are emitted. If the energy loss of the muon over the step is below the threshold, only muon Cherenkov photons are simulated. The simulation package also uses tables generated from GEANT 3 [22] that parameterise the arrival time and the amount of light detected by individual PMTs. These tables take into account the measured properties of the water at the ANTARES site, the angular dependence of the acceptance of the PMT and also the position, distance and orientation of the PMT with respect to a given muon track. The optical background is assumed to be constant at a rate of 60 kHz [23] on each PMT.
3.2 Algorithm

The shower identification algorithm proceeds in several steps. First, the muon trajectory must be determined. This is done using a standard tracking algorithm [24, 25] that provides an estimate of the direction and position of the muon at a given time. In what follows, a hit is taken to be a photomultiplier signal exceeding a charge threshold of 0.3 photoelectrons [26]. Using the configuration in Figure 1, the expected Cherenkov photon arrival time for each hit is calculated as
| (1) |
where is the time at which the muon passes point , is the group velocity of light in water ( = 1.38 is the group refractive index for ANTARES water), is the Cherenkov angle for a relativistic muon in water () and is the perpendicular distance between the muon trajectory and the PMT.
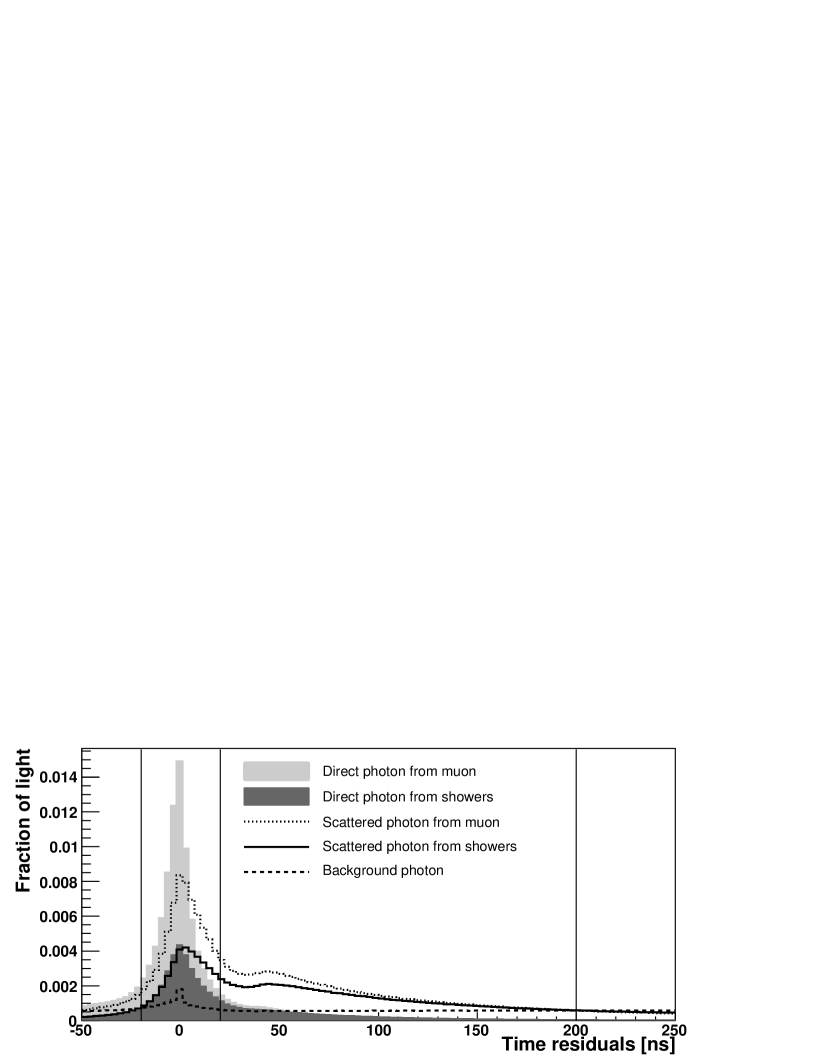
The fitted trajectory can be used to characterize hits by their arrival times into three groups: early hits that are predominantly due to Cherenkov photons, late hits that are mainly due to scattered and shower photons, and extremely early or late hits that can safely be assumed to be due to background. Figure 2 shows time residuals () for muon energies between 100 GeV and 100 TeV generated by the simulation described in Section 3.1. Direct hits have a roughly Gaussian distribution (with a long tail of late hits) with a peak at zero time residual and a full width at half maximum of 20 ns.
Early hits ( ns) contain mostly muon Cherenkov photons whose emission positions along the muon track are given by
| (2) |
The variation in the arrival time of these Cherenkov hits can be attributed to the dispersion of light in the sea water. Note that Equation 2 is used to determine the emission point of all photons leading to early hits, even shower photons that may not be emitted at the Cherenkov angle.
Late hits ( ns) contain the largest fraction of hits due to shower photons. The value of has been taken to be the point at which a hit is equally likely to be due to a shower photon as to a background photon. These shower photons may not necessarily be emitted at the Cherenkov angle from the muon track. Therefore the emission angle is left as a free parameter and, with the photon emission taking place at (see Figure 1), the hit time is given by
| (3) |
Equation (3) has two distinct solutions, and .
Extremely late or early hits ( or ) are assumed to be background hits and are rejected.
All calculated , and positions along the muon track are collected in a one dimensional histogram. The shower position is identified by the localised increase of the number of emitted photons along the reconstructed muon trajectory, identified by a peak in the histogram. If the two solutions and are found in different peaks, the shower identification procedure will ignore the solution in the smaller peak.
An example of the application of this procedure to data can be seen in Figure 3. The bottom right panel of this figure shows the emission points of photons along the muon trajectory, as determined by the solutions of Equation 2 and Equation 3. Two excesses are visible and are attributed to two electromagnetic showers. Each of the other three panels shows a height versus time diagram of data obtained from one of the detector lines. The result of the muon trajectory reconstruction for a relativistic muon in water together with results of the shower identification are also displayed. A downward going muon with two electromagnetic showers is thereby identified. Using the fitted shower positions from the shower identification algorithm, a prediction is made for the arrival time of the shower light. The dotted curves in Figure 3 show the expected photon arrival time under the assumption of a spherical light emission from the reconstructed position of the shower. As can be seen from Figure 3, most, but not all, photons are associated with the muon track fit. Many photons that do not comply with the muon track fit are associated to shower photons. The photons not associated with the muon track or associated showers can be attributed to random background photons due to radioactive decays and bioluminescence.
4 Selection and performance
The selection and performance of the shower identification algorithm has been studied with the simulation described in Section 3.1.
4.1 Muon and shower selection
The shower identification algorithm is applied to well reconstructed muon tracks that have the potential to produce a detectable shower. Two criteria have been used to select such tracks. First, the track length is required to be at least 125 m. The track length is taken to be the distance between the emission points of the photons that gave rise to the earliest and latest hit used in the muon track reconstruction. Second, the muon trajectory reconstruction is required to have used at least 12 hits. These criteria select about 65% of all reconstructed (downward going) muon tracks.
The shower-induced photon emission along the muon trajectory results in localised peaks as shown in Figure 3d. The task to identify a shower is then reduced to a one dimensional peak finding algorithm whose result can be characterised by three parameters, namely the center, width and height of the identified peak. Potential peaks are identified through the subtraction of the constant photon background, as determined by a sensitive nonlinear peak clipping algorithm. This algorithm tracks the baseline of a spectrum by comparing the value of each data point with the average value of neighboring data points, taking the baseline to be the smaller value. Further details can be found in [27].
For each potential peak, the number of hits is integrated in a m window around the peak center. All hits are assumed to be single photons. Only peaks having at least 10 hits above Cherenkov photon baseline in this window of 10 m are selected (typically yielding peaks with three sigma significance). The number of baseline hits is defined as the average number of hits along the track times the window of 10 m. In order to suppress wrongly identified showers, hits from at least five different floors are required for each peak.
4.2 Performance of the shower identification method
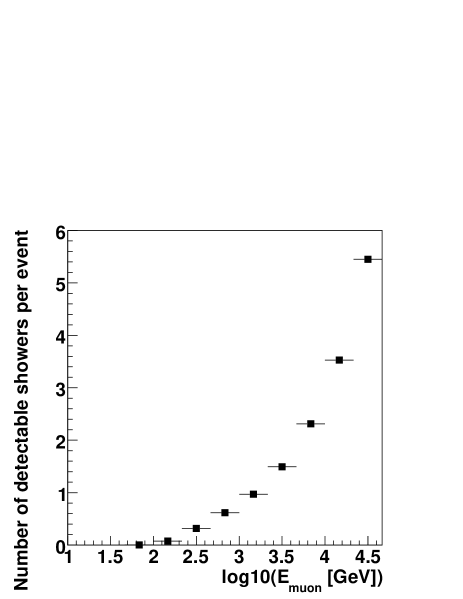
Figure 4 shows the number of detectable showers, coming from well reconstructed muons, that have shower photons detected on at least five different floors per atmospheric muon event as a function of the muon energy. The atmospheric muon events are usually muons in a bundle with an average multiplicity around 3.3 [16]. The muon energy in Figure 4 refers to the muon with the largest energy in the bundle. These muons have an average energy of 1.2 TeV and their mean generated shower energy is around 120 GeV. Muons with at least one identified shower have on average 2.5 times higher energy than muons without an identified shower.
The event selection and algorithm has been tuned to count the number of showers with a high level of purity, even at the expense of efficiency. In order to study the efficiency and purity of the reconstruction, the Monte Carlo truth information is consulted to determine whether the result of the shower reconstruction corresponds to any actual shower and, if so, whether that shower has been well reconstructed. A reconstructed shower is said to have correctly identified an underlying shower if its position is determined to within 25 m of the true generation point and if 25% of the hits in the reconstructed shower are truly due to photons produced by the underlying shower. Here, a hit is in the reconstructed shower if its projected emission point along the muon track is within 5 m of the reconstructed shower position (see Figure 3d).
The efficiency with which showers are correctly identified is given by the ratio of the number of well identified showers to the total number of simulated showers that give rise to hits in at least five different floors, i.e. all showers that may reasonably be expected to be reconstructed. The shower identification efficiency ranges from 5% at low shower energy (300 GeV) to 30% at high shower energy (5 TeV), as shown in Figure 5a.
The purity of the reconstructed shower sample is given by the ratio of the number of correctly identified showers to the number of all reconstructed showers and is shown in Figure 5b. The shower purity ranges from 40% at low shower energy (300 GeV) to 90% at high shower energy (1 TeV). At even higher shower energies, the purity decreases, reaching 60% at 30 TeV. Such showers are mainly produced by very high energy muons. The density of photons along the trajectory of such a muon is great enough that an excess of photons due to a particular shower becomes difficult to observe.
5 Comparison between data and Monte Carlo simulations
A sample of data corresponding to 47.3 days of data taking between January and December 2007 has been used to study the behavior of the shower identification algorithm. During this period the detector comprised five lines.
The Corsika simulation (including the simplified Hörandel flux) was scaled by a factor 0.83 to normalise the simulated muon rate to the measured muon rate for the selected tracks. Figure 6a shows the angular distribution of the shower photons with respect to the muon direction. The shape of the distribution is determined by detector effects and the cuts used in the analysis. The peak around 42 degrees comes from shower photons emitted at the Cherenkov angle through showers oriented in the direction of the muon and whose emission points have been calculated using Equation 2, whereas the other hits have been calculated using Equation 3.
Figure 6b shows the hit multiplicity distribution of selected showers. With the final set of cuts applied, the average number of hits associated to an identified shower is around 14. As the quantity of Cherenkov light produced by an electromagnetic shower increases linearly with the muon energy, counting the number of hits in one shower provides a first order estimate of its energy. The data distributions agree reasonably well with the Corsika simulation.
| Number of identified showers | 0 | 1 | 2 | 3+ |
|---|---|---|---|---|
| Source of uncertainty | Variation in [%] | |||
| Background rate | 0.1 | 1 | 12 | 14 |
| Minimal shower energy | 0.1 | 3 | 6 | 5 |
| PMT angular acceptance | 1.2 | 18 | 30 | 3 |
| Absorption length | 1.3 | 17 | 39 | 77 |
| Total systematic uncertainty [%] | 1.8 | 25 | 51 | 78 |
The simulation has also been used to evaluate systematic uncertainty on the number of identified showers. Table 1 shows the systematic uncertainty determined by varying parameters in the simulation [2]. The measured detector background rate is around 60 kHz on average [23]. The systematic error arising from the uncertainty of this background rate is estimated by repeating the analysis with a background rate of 50 kHz and with a background rate of 120 kHz (row three in Table 1). The values are the percentage variation with respect to the values from the default simulation. Uncertainties arising from the energy threshold to produce hits from electromagnetic showers or hits from muon Cherenkov light is estimated by varying the threshold % from its default value of 1 GeV (row four in Table 1). Uncertainty on the angular acceptance of the optical modules is estimated by taking a different parametrization of the PMT angular acceptance [2] (row five in Table 1). The water properties are taken into account by varying the absorption length by % around the measured value [28] (row six in Table 1).
All systematic uncertainties are added in quadrature. The largest contributions to the systematic error arise from uncertainties on the PMT angular acceptance and on the water absorption length. When decreasing the absorption length, fewer showers are identified, since more photons are absorbed in the water before they reach the PMTs. On the other hand, the systematic studies show evidence that the shower algorithm is robust against large variations of the background, because showers emit a light density much bigger than that of the optical background.
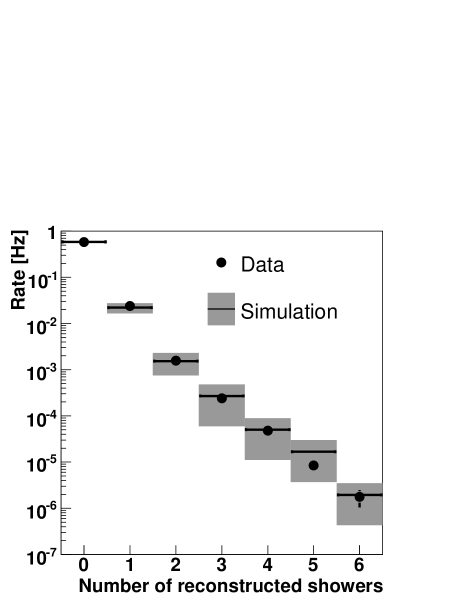
The muon event rate as a function of the number of identified showers is shown in Figure 7. The distribution shows the results for data and the Corsika based simulation with no correction for the identification efficiency. Also shown is the systematic uncertainty for the simulation. For the data points, only the statistical errors are shown. As can be seen, about 4% of the selected muon tracks have one well identified shower. There is agreement between data and Monte Carlo over five orders of magnitude.
6 Conclusions
A method to identify electromagnetic showers emitted by muons has been developed, characterised and applied to the downward going muon data taken with the ANTARES detector. This algorithm exploits the different emission characteristics of shower-induced and primary muon-induced Cherenkov photons. The shower light emission is localised at discrete points along the muon trajectory, whereas the traversing muon continuously emits Cherenkov photons under a constant and known angle relative to the muon trajectory. The essential element of the algorithm is the projection and identification of photon vertices along the muon track with a subsequent peak finding algorithm. The performance of the identification algorithm has been validated using a sample of simulated atmospheric muon events and agreement was found in the number of identified showers between data and simulations.
With the development and validation of this electromagnetic shower multiplicity estimator, important new information becomes available for physics analysis. In particular the method establishes a first step towards a new energy estimator. With the application of this method, it can be concluded that stochastic energy loss has been observed in ANTARES.
Acknowledgments
The authors acknowledge the financial support of the funding agencies: Centre National de la Recherche Scientifique (CNRS), Commissariat á l’énegie atomique et aux énergies alternatives (CEA), Agence National de la Recherche (ANR), Commission Européenne (FEDER fund and Marie Curie Program), Région Alsace (contrat CPER), Région Provence-Alpes-Côte d’Azur, Département du Var and Ville de La Seyne-sur-Mer, France; Bundesministerium für Bildung und Forschung (BMBF), Germany; Istituto Nazionale di Fisica Nucleare (INFN), Italy; Stichting voor Fundamenteel Onderzoek der Materie (FOM), Nederlandse organisatie voor Wetenschappelijk Onderzoek (NWO), the Netherlands; Council of the President of the Russian Federation for young scientists and leading scientific schools supporting grants, Russia; National Authority for Scientific Research (ANCS), Romania; Ministerio de Ciencia e Innovación (MICINN), Prometeo of Generalitat Valenciana and MultiDark, Spain. We also acknowledge the technical support of Ifremer, AIM and Foselev Marine for the sea operation and the CC-IN2P3 for the computing facilities.
References
- [1] J. A. Aguilar et al., Measurement of the atmospheric muon flux with a 4 GeV threshold in the ANTARES neutrino telescope, Astropart. Phys. 33, 86–90 (2010).
- [2] J. A. Aguilar et al., Zenith distribution and flux of atmospheric muons measured with the 5-line ANTARES detector, Astropart. Phys. 34, 179–184 (2010).
- [3] P. Coyle, The ANTARES Deep-Sea Neutrino Telescope: Status and First Results, (2010), arXiv:1002.0754.
- [4] K. Nakamura et al., The review of particle physics, J. Phys. G 37, 075021 (2010).
- [5] D. E. Groom, N. V. Mokhov, and S. I. Striganov, Muon stopping power and range tables 10-MeV to 100-TeV, Atom. Data Nucl. Data Tabl. 78, 183–356 (2001).
- [6] S. I. Klimushin, E. V. Bugaev, and I. A. Sokalski, Precise parametrizations of muon energy losses in water, (2001), hep-ph/0106010.
- [7] T. Gaisser, Cosmic Rays and Particle Physics, Cambridge University Press , 75 (1990).
- [8] R. Kokoulin and A. Petrukhin, Theory of the Pair Meter for High-Energy Muon Measurements, Nucl. Instrum. Meth. A263, 468–479 (1988).
- [9] R. Gandhi and S. Panda, Probing the cosmic ray ’knee’ and very high energy prompt muon and neutrino fluxes via underground muons, JCAP 0607, 011 (2006).
- [10] J. A. Aguilar et al., Search for a diffuse flux of high-energy with the ANTARES neutrino telescope, Phys. Lett. B696, 16–22 (2011).
- [11] S. Desai et al., Study of TeV Neutrinos with Upward Showering Muons in Super-Kamiokande, Astropart. Phys. 29, 42–54 (2008).
- [12] J. A. Aguilar et al., Time Calibration of the ANTARES Neutrino Telescope, Astropart. Phys. 34, 539–549 (2011).
- [13] J. A. Aguilar et al., Performance of the front-end electronics of the ANTARES neutrino telescope, Nucl. Instrum. Meth. A622, 59–73 (2010).
- [14] J. Aguilar et al., The data acquisition system for the ANTARES neutrino telescope, Nucl. Instrum. Methods A 570, 107–116 (2007).
- [15] P. Amram et al., The ANTARES optical module, Nucl. Instrum. Meth. A484, 369–383 (2002).
- [16] D. Heck, G. Schatz, T. Thouw, J. Knapp, and J. N. Capdevielle, CORSIKA: A Monte Carlo code to simulate extensive air showers, (1998), FZKA-6019.
- [17] J. R. Hoerandel, On the knee in the energy spectrum of cosmic rays, Astropart. Phys. 19, 193–220 (2003).
- [18] S. Ostapchenko, Status of QGSJET, AIP Conf. Proc. 928, 118–125 (2007).
- [19] D. J. L. Bailey, Ph.D. Thesis, Oxford University, Monte Carlo tools and analysis methods for understanding the ANTARES experiment and predicting its sensitivity to Dark Matter, (2002), see also http://antares.in2p3.fr/Publications/index.html#thesis.
- [20] J. Brunner, Antares simulation tools, Proceedings of the VLVnT Workshop, Amsterdam , 109–113 (2003), see also http://www.vlvnt.nl/.
- [21] P. Antonioli, C. Ghetti, E. V. Korolkova, V. A. Kudryavtsev, and G. Sartorelli, A three-dimensional code for muon propagation through the rock: MUSIC, Astropart. Phys. 7, 357–368 (1997).
- [22] GEANT, Detector Description and Simulation Tool, CERN Program Library Long Writeup W5013 (1993).
- [23] S. Escoffier, The ANTARES detector: background sources and effects on detector performance, (2007), arXiv:0710.0527.
- [24] M. Ageron et al., Performance of the First ANTARES Detector Line, Astropart. Phys. 31, 277–283 (2009).
- [25] R. Bruijn, Ph.D. Thesis, Amsterdam University, The ANTARES Neutrino Telescope: Performance studies and analysis of first data, (2008), see also http://antares.in2p3.fr/Publications/index.html#thesis.
- [26] J. A. Aguilar et al., Study of Large Hemispherical Photomultiplier Tubes for the ANTARES Neutrino Telescope, Nucl. Instrum. Meth. A555, 132–141 (2005).
- [27] M. Morhac, J. Kliman, V. Matousek, M. Veselsky, and I. Turzo, Background elimination methods for multidimensional coincidence gamma-ray spectra, Nucl. Instrum. Meth. A401, 113–132 (1997).
- [28] J. A. Aguilar et al., Transmission of light in deep sea water at the site of the ANTARES neutrino telescope, Astropart. Phys. 23, 131–155 (2005).