CoRoT 102699796, the first metal-poor Herbig Ae pulsator: a hybrid Sct- Dor variable?††thanks: The CoRoT space mission, launched on December 27th 2006, has been developed and is operated by CNES, with the contribution of Austria, Belgium, Brazil , ESA (RSSD and Science Programme), Germany and Spain.††thanks: Based on observations collected at the European Southern Observatory, Paranal, Chile. Proposal n. 082.D-0839A
Abstract
We present the analysis of the time series observations of CoRoT 102699796 obtained by the CoRoT satellite that show the presence of five independent oscillation frequencies in the range 3.6-5 c/d. Using spectra acquired with FLAMES@VLT, we derive the following stellar parameters: spectral type F1V, Teff=7000200 K, log(g)=, [M/H]=1.1, sin= km/s, L/L⊙=21. Thus, for the first time we report the existence of a metal poor, intermediate-mass PMS pulsating star. Ground-based and satellite data are used to derive the spectral energy distribution of CoRoT 102699796 extending from the optical to mid-infrared wavelengths. The SED shows a significant IR excess at wavelengths greater than . We conclude that CoRoT 102699796 is a young Herbig Ae (F1Ve) star with a transitional disk, likely associated to the HII region [FT96]213.1-2.2.
The pulsation frequencies have been interpreted in the light of the non-radial pulsation theory, using the LOSC code in conjunction with static and rotational evolutionary tracks. A minimization algorithm was used to find the best-fit model with M=1.84 M⊙, Teff=6900 K which imply an isochronal age of t2.5 Myr. This result is based on the interpretation of the detected frequencies as -modes of low-moderate -value. To our knowledge, this is the first time that such modes are identified in a intermediate-mass PMS pulsating star. Since CoRoT 102699796 lies in the region of the HR diagram where the Sct and Dor instability strips intersect, we argue that the observed pulsation characteristics are intermediate between these classes of variables, i.e. CoRoT 102699796 is likely the first PMS hybrid Dor- Sct pulsator ever studied.
keywords:
stars: pre-main-sequence – stars: variables: T Tauri, Herbig Ae/Be – stars: variables: Scuti – stars: fundamental parameters – stars: abundances – infrared: stars.1 Introduction
Asteroseismology of Herbig Ae stars offers a unique means to probe their interior structure and to compare to evolutionary models. It is now well established that these stars during contraction towards the main sequence cross the instability strip of more evolved stars. These young, pulsating intermediate-mass stars are collectively called PMS Sct and their variability is characterized by short periods (30m5 h) and small amplitudes (from less than a millimag to a few hundredths of magnitude, see, e.g. Kurtz & Marang, 1995; Catala, 2003; Ripepi et al., 2006; Zwintz, 2008).
The first theoretical investigation of the PMS instability strip based on nonlinear convective hydrodynamical models was carried out by Marconi & Palla (1998), who calculated its topology for the first three radial modes. These authors also found that the interior structure of PMS stars crossing the instability strip is significantly different from that of more evolved Main Sequence stars (with the same mass and temperature), even though the envelope structures are similar. The subsequent theoretical work by Suran et al. (2001) made a comparative study of the seismology of a 1.8 PMS and post-MS star. They found that the unstable frequency range is roughly the same for PMS and post-MS stars, but that some non-radial () modes are very sensitive to the deep internal structure. More recently, Grigahcène et al. (2006) produced a theoretical instability strip for PMS stars for the first seven radial modes; Ruoppo et al. (2007) derived a model based relation between the large frequency separation and the stellar luminosity and effective temperature and developed a tool to compare theory and observations in the echelle diagram. Finally Di Criscienzo et al. (2008) applied the ATON evolutionary code to the computation of detailed grids of standard (non-rotating) and rotating pre-main sequence (PMS) models and computed their adiabatic oscillation spectra.
From the observational point of view, multi-site campaigns (e.g., Ripepi et al., 2003; Bernabei et al., 2009) and space observations with MOST (e.g., Zwintz et al., 2009, for NGC2264) provided us with good sets of frequencies to be compared with the models. In addition, spectroscopic studies (see, e.g. Fumel & Böhm, 2008; Böhm et al., 2009, for the cases of HD104237 and RS Cha, respectively) demonstrated to be very valuable for line profile analysis and direct mode determination using tools like F2D (Kennelly, 1994; Kennelly & Walker, 1996) or FAMIAS (Zima, 2008). However, the full exploitation of the PMS Sct instability strip is still far from being realized. Dedicated observations of a large sample of PMS stars covering the whole instability strip are needed to accomplish this goal.
In this context, a fundamental contribution can be provided by the data coming from the space telescope CoRoT (Convection, Rotation and planetary Transits; Baglin et al., 2007). This satellite took images of the same region of the sky for about five consecutive months reaching relatively faint stars (up to V15 mag) in its“exo field”, with good precision and very high duty cycle. Particularly interesting was the first long-term pointing of CoRoT, the so-called “Long Run a1” () which imaged a region of the sky in the galactic anti-center where a few distant Star Forming Regions (SFR) are present.
With the aim of searching for possible PMS Sct variables present in the CoRoT data, we have studied all the stars identified as Sct from the CoRoT variable star classification group (Debosscher et al., 2009), looking at near infrared (NIR) excess and emission in the Balmer lines, i.e. typical features of PMS objects. We mainly used the 2MASS photometry (Skrutskie et al., 2006) and the yet unpublished FLAMES@VLT spectroscopic survey of CoRoT variables in performed by C. Neiner and collaborators (ESO proposal 082.D-0839A). Among the about 76 stars classified as Sct with available spectrum observed by CoRoT during , the only candidate PMS Sct variable was CoRoT 102699796, a relatively faint star with V=15.51 mag, located in the direction of Monoceros (RA,DEC 06:43:38.46 01:07:46.7, J2000). This paper is devoted to a complete characterization of this star on the basis of time-series CoRoT observations and a variety of additional data, such as VLT mid-resolution spectroscopy and optical-NIR ground-based, as well as space infrared photometry.
In sections 2 and 3 we present the CoRoT photometry and the VLT spectroscopy, respectively. In section 4 we discuss the evolutionary status of CoRoT 102699796 and its possible membership to the Star Forming Region [FT96]213.1-2.2. In section 6 we interpret the observed oscillation frequencies to the light of non-radial pulsation theory; a summary of the major findings of present work closes this paper.
2 Photometric observations with CoRoT
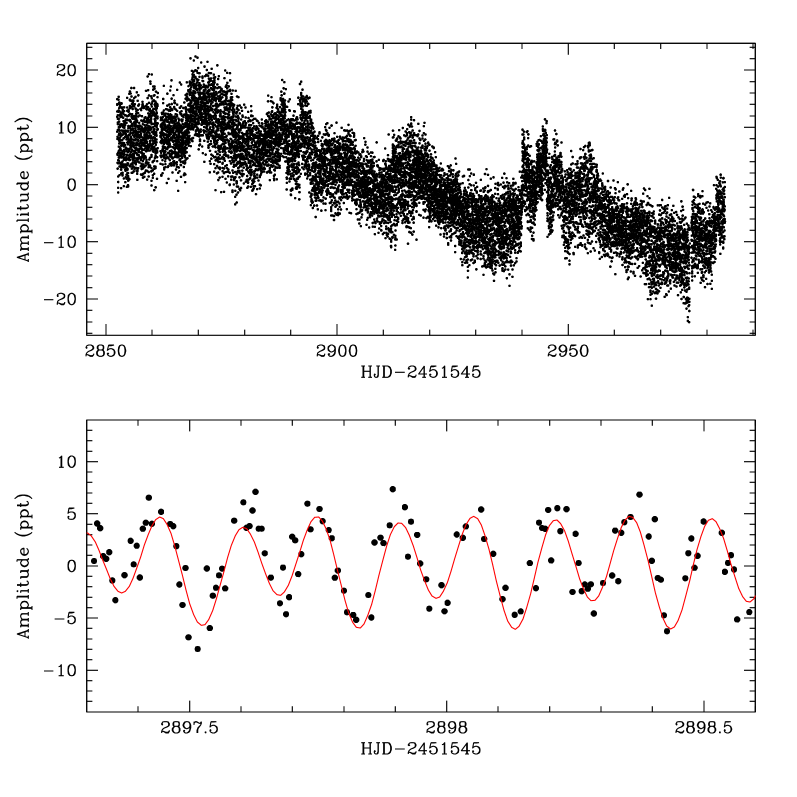
CoRoT 102699796 was observed by the CoRoT satellite in its “exo field” during the Galactic anti-centre run, between October 27, 2007 and March 3, 2008. The data span about 131.5 consecutive days. The exposure time was of 512 seconds. We used the data corrected to the N2 level (the processing steps are described in Auvergne et al., 2009), which contains 22036 flux measurements. The first step of data processing consisted in removing all the points with non-0 flag (Auvergne et al., 2009), i.e. mainly removing those measurements heavily affected by the transit through the South Atlantic Anomaly (SAA). A few obvious outliers were rejected, too. The resulting light curve was transformed in part-per-thousand (ppt hereafter) using the formula 1000[(flux/-1], where is the mean over the whole light curve. This procedure left us with 14997 useful data points which are shown in Fig. 1 (upper panel). The light curve clearly shows a monotonic dimming probably due to the ageing of the CCD and/or optics of CoRoT, as well as shorter time scale variability, of the order of 15-30 d and 3-5 d. The former “periodicity” could be ascribed to variable dust obscuration due to the passing of circumstellar material in front of the star (see, e.g. van den Ancker et al., 1998), whereas the latter could be due to rotational modulation related to coronal activity (see, e.g. Catala, 2003). However, given that the observed amplitudes are of only 1-2 hundredths of magnitudes for both types of variability, we cannot exclude that all these long term variation are due to instrumental effects. Moreover, the light curve also appears affected by small“steps”, i.e. sudden jumps in brightness of instrumental origin, common among the CoRoT light curves in the “exo field” field (see, e.g. Mislis et al., 2010). This occurrence makes it difficult to understand whether a feature is intrinsic or due to instrumental problems. To get rid of this effect, we decided to apply a high-pass filter to the light curve, removing all the long-term variability by filtering out all the frequencies lower than 0.50 c/d (all the periods larger than 2 days). This very simple approach is effective in removing also the quoted “steps” because they are not particularly strong in our case, and no specific treatment is needed. We emphasize that the above procedures modify the variability features of the star at frequencies much lower than those typical of the expected Sct pulsation, therefore, they do not affect at all the frequency analysis which is presented in the next section.
2.1 Frequency analysis
The pulsation frequency analysis was carried out with the package (Lenz & Breger, 2005), which adopts both Fourier and least squares algorithms, and permits the simultaneous fitting of multiple sinusoidal variations, and thus does not rely on sequential prewhitening. We have also used, for comparison purposes, the SigSpec package, which follows a different approach (Reegen, 2007).
First, we calculated the spectral window (SW) of the data up to the Nyquist frequency (84 c/d), as shown in panel a) of Fig. 2. The SW shows several features due to the satellite’s orbital period of about 7000 s (variable up to four seconds), and its multiples. This is due to the removal of data points during the passage through the SAA. Moreover, since the scattered light falling on the detector varies during the orbit of the satellite, the periodogram of the star is expected to present the orbital period (13.96 c/d) with the relative aliases and harmonics. Frequencies close to these values will be rejected in the following analysis.
The Fourier transform of the data is shown in panel b) of Fig. 2. It can be seen that there is a dominant frequency at about 6.55 c/d and other signal up to the Nyquist frequency. Most of the signal is represented by the aliases of the dominant frequency and is removed by the prewhitening procedure. We extracted frequencies with using as a limit for the last significant frequencies the widely used empirical criteria of S/N=4 (Breger et al., 1993). To estimate the noise, following well established procedures (see, e.g. Rodríguez et al., 2006; García Hernández et al., 2009), we calculated the average amplitude of the residuals (after prewhitening all the significant peaks) in a frequency interval of width=5 c/d centred on the corresponding peak. Quantitatively the noise resulted to be quite flat beyond 1 (c/d) with an average value 0.03 (ppt). In this way we were able to extract 15 significant frequencies. Among these, four (at 27.9416, 41.91337 27.9379, and 13.9617 c/d) are related to the orbital period of the satellite and will be ignored in the analysis. The remaining eleven frequencies are listed in the first three columns of Table 1 together with the amplitude and S/N. The same procedure was carried out with , obtaining the same results, as shown in Table 1 where represent the spectral significance (see Reegen, 2007, for an explanation). Following Reegen (2007); Kallinger, Reegen, & Weiss (2008), a value of =5.46 should be approximately equivalent to S/N=4.0. However, as shown in Tab 1, in our case this S/N value corresponds to a 6.6. The origin of such a discrepancy, which was already found by other Authors in the literature, is not clear. A detailed discussion about this occurrence is beyond the scope of present paper, indeed our results are not affected at all, since our main discriminant for the significant frequencies remains the S/N=4.0 criterion. However, the interested reader can consult e.g. García Hernández et al. (2009) for a discussion on this subject.
As a further check on the reliability of the frequency extraction, we analysed separately selected portions of the time-series, with a size of about 10-15 d, and dealing with both “detrended” and raw data (in this case avoiding portions including “steps”). All the relevant frequencies were found in all the cases, reinforcing our confidence about the reliability of the results presented here.
The precision on the single frequencies is also given in Table 1. It has been estimated adopting the definition by Kallinger, Reegen, & Weiss (2008) : , where is the duration of the time-series and is the significance of the frequency with amplitude as calculated by .We also report the uncertainty on the frequencies on the basis of the Rayleigh criterion (1/4T)111see Kallinger, Reegen, & Weiss (2008) and references therein for a discussion about this definition=0.002 c/d. This more conservative estimate (at 3- level) is the value used for the comparison to the theoretical models.
2.2 Combination of frequencies
Linear combinations of the terms having the highest amplitudes have been observed in low-amplitude Sct stars both from the ground and from space (see, e.g. Breger et al., 2005; Poretti et al., 2009). To search for possible combinations among the frequencies observed in CoRoT 102699796, we decided to use the Combine package, an ad hoc computer program written by P. Reegen. This program checks one frequency after the other for being a linear combination of previously examined frequencies. If this attempt fails, the corresponding frequency is considered “genuine”. Only genuine frequencies are used to form linear combinations subsequently (see Reegen, 2010, for a detailed description). Applying this package to the investigated star, we find only five genuine frequencies. All the other frequencies can be explained as simple linear combination of these terms. We varied the input parameters of Combine to verify the robustness of the combination calculation. The genuine and the combination frequencies are identified in the last column of Table 1 and in the periodograms of panels c) to f) of Fig. 2.
| FP04 | FP04 | AP04 | S/NP04 | FSigSpec | ASigSpec | SigSigSpec | Identification | |
|---|---|---|---|---|---|---|---|---|
| (c/d) | Hz | (ppt) | (c/d) | (ppt) | (c/d) | |||
| (1) | (2) | (3) | (4) | (5) | (6) | (7) | (8) | (9) |
| 6.5584 | 75.91 | 3.47 | 116.5 | 6.5584 | 3.47 | 1585.4 | 0.0002 | f1 |
| 3.3180 | 38.40 | 1.40 | 37.9 | 3.3180 | 1.40 | 497.5 | 0.0003 | f2 |
| 6.5069 | 75.31 | 0.96 | 32.1 | 6.5069 | 0.96 | 273.4 | 0.0005 | f3 |
| 6.7929 | 78.62 | 0.76 | 25.2 | 6.7929 | 0.76 | 186.6 | 0.0006 | f4 |
| 3.2405 | 37.51 | 0.66 | 17.6 | 3.2406 | 0.66 | 147.1 | 0.0006 | f1f2 |
| 3.5822 | 41.46 | 0.23 | 6.5 | 3.5822 | 0.23 | 19.2 | 0.0017 | f5 |
| 3.6603 | 42.36 | 0.18 | 5.2 | 3.6603 | 0.18 | 12.4 | 0.0022 | 2f2f1 |
| 13.1164 | 151.81 | 0.15 | 4.9 | 13.1162 | 0.16 | 8.8 | 0.0026 | 2f1 |
| 13.0645 | 151.21 | 0.14 | 4.7 | 13.0646 | 0.14 | 7.7 | 0.0027 | f1f3 |
| 6.6361 | 76.81 | 0.13 | 4.3 | 6.6366 | 0.13 | 7.0 | 0.0029 | 2f2 |
| 9.8762 | 114.31 | 0.13 | 4.1 | 9.8761 | 0.13 | 6.6 | 0.0030 | f1f2 |

3 Spectroscopic observations
Intermediate-resolution spectroscopy of CoRoT 102699796 was carried out with Fibre Large Area Multi-Element Spectrograph (FLAMES), (Pasquini et al., 2002) mounted at the Nasmyth A platform of the VLT 8.2-m unit telescope 2. The low-resolution gratings LR02 and LR06 were used, leading to a resolving power of and , respectively. The spectral range coverage is about 600 Å ( Å) for the blue grating and about 700 Å ( Å) for the red grating.
We acquired four exposures with the LR02 grating, two during the night of 2009, February 09 and two others during the night 2009, March 22. In order to increase the signal-to-noise ratio of the final spectrum, we corrected each single spectrum to the velocity restframe, we verified that no residual lines shift is present at our resolution (i. e., due to a hidden companion), and finally we combined all of them in one spectrum with a total exposure time of 2160 sec, and a SNR of 60.
Only one exposure has been obtained using the LR06 grating, precisely during the night 2009, February 09, with an exposure time of 2400 sec and with a SNR of 40.
For the following analysis we used the 1-D, wavelength-calibrated spectra as reduced by the dedicated Giraffe pipeline222BLDRS v0.5.3, written at the Geneva Observatory, see http://girbldrs.sourceforge.net.
| El | El | El | ||||||
|---|---|---|---|---|---|---|---|---|
| 4001.661 | -1.880 | FeI | 4143.415 | -0.204 | FeI | 4250.119 | -0.405 | FeI |
| 4002.083 | -3.471 | FeII | 4143.868 | -0.450 | FeI | 4250.787 | -0.710 | FeI |
| 4005.242 | -0.610 | FeI | 4147.669 | -2.104 | FeI | 4258.154 | -3.400 | FeII |
| 4007.272 | -1.300 | FeI | 4153.900 | -0.270 | FeI | 4260.474 | -0.020 | FeI |
| 4009.713 | -1.200 | FeI | 4154.499 | -0.688 | FeI | 4271.153 | -0.349 | FeI |
| 4014.531 | -0.200 | FeI | 4154.805 | -0.370 | FeI | 4271.760 | -0.164 | FeI |
| 4017.148 | -0.920 | FeI | 4156.799 | -0.620 | FeI | 4273.326 | -3.258 | FeII |
| 4021.866 | -0.660 | FeI | 4157.780 | -0.403 | FeI | 4278.159 | -3.816 | FeII |
| 4024.725 | -0.710 | FeI | 4158.792 | -0.670 | FeI | 4282.403 | -0.810 | FeI |
| 4030.488 | -0.555 | FeI | 4170.901 | -1.100 | FeI | 4294.125 | -1.110 | FeI |
| 4032.627 | -2.440 | FeI | 4173.461 | -2.180 | FeII | 4296.572 | -3.010 | FeII |
| 4043.897 | -0.826 | FeI | 4174.913 | -2.969 | FeI | 4299.234 | -0.430 | FeI |
| 4044.609 | -1.080 | FeI | 4175.636 | -0.670 | FeI | 4303.176 | -2.490 | FeII |
| 4045.594 | -0.896 | FeI | 4176.566 | -0.620 | FeI | 4307.902 | -0.070 | FeI |
| 4045.812 | 0.280 | FeI | 4177.692 | -3.753 | FeII | 4314.310 | -3.477 | FeII |
| 4062.441 | -0.780 | FeI | 4178.862 | -2.480 | FeII | 4315.085 | -0.970 | FeI |
| 4063.276 | -0.748 | FeI | 4180.981 | -1.840 | FeII | 4325.762 | -0.010 | FeI |
| 4063.594 | 0.070 | FeI | 4181.755 | -0.180 | FeI | 4351.769 | -2.100 | FeII |
| 4066.974 | -0.856 | FeI | 4184.891 | -0.860 | FeI | 4352.735 | -1.260 | FeI |
| 4067.271 | -1.419 | FeI | 4187.039 | -0.548 | FeI | 4369.411 | -3.670 | FeII |
| 4067.978 | -0.430 | FeI | 4187.795 | -0.554 | FeI | 4369.772 | -0.730 | FeI |
| 4070.770 | -0.790 | FeI | 4191.430 | -0.666 | FeI | 4375.930 | -3.031 | FeI |
| 4071.738 | -0.022 | FeI | 4195.329 | -0.492 | FeI | 4383.545 | 0.200 | FeI |
| 4073.762 | -0.920 | FeI | 4198.247 | -0.456 | FeI | 4384.319 | -3.500 | FeII |
| 4074.786 | -0.970 | FeI | 4198.304 | -0.719 | FeI | 4385.387 | -2.570 | FeII |
| 4075.954 | -3.380 | FeII | 4199.095 | 0.250 | FeI | 4404.750 | -0.142 | FeI |
| 4076.629 | -0.360 | FeI | 4202.029 | -0.708 | FeI | 4413.601 | -3.870 | FeII |
| 4078.354 | -1.500 | FeI | 4203.938 | -0.350 | FeI | 4415.122 | -0.615 | FeI |
| 4081.567 | -0.200 | FeI | 4210.343 | -0.870 | FeI | 4416.830 | -2.600 | FeII |
| 4084.492 | -0.590 | FeI | 4216.183 | -3.356 | FeI | 4427.310 | -3.044 | FeI |
| 4085.004 | -1.280 | FeI | 4217.546 | -0.510 | FeI | 4442.339 | -1.255 | FeI |
| 4085.303 | -0.710 | FeI | 4219.360 | 0.120 | FeI | 4447.717 | -1.342 | FeI |
| 4114.445 | -1.220 | FeI | 4222.213 | -0.967 | FeI | 4459.117 | -1.279 | FeI |
| 4118.545 | 0.280 | FeI | 4224.171 | -0.410 | FeI | 4461.653 | -3.210 | FeI |
| 4121.802 | -1.300 | FeI | 4225.454 | -0.500 | FeI | 4466.551 | -0.590 | FeI |
| 4122.668 | -3.380 | FeII | 4227.427 | 0.230 | FeI | 4472.929 | -3.430 | FeII |
| 4127.608 | -0.990 | FeI | 4233.172 | -2.000 | FeII | 4476.019 | -0.570 | FeI |
| 4128.748 | -3.760 | FeII | 4233.602 | -0.604 | FeI | 4482.170 | -3.501 | FeI |
| 4132.058 | -0.650 | FeI | 4235.936 | -0.341 | FeI | 4482.253 | -1.482 | FeI |
| 4132.899 | -0.920 | FeI | 4238.810 | -0.280 | FeI | 4489.183 | -2.970 | FeII |
| 4134.677 | -0.490 | FeI | 4245.258 | -1.170 | FeI | 4491.405 | -2.700 | FeII |
| 4136.998 | -0.540 | FeI | 4247.425 | -0.230 | FeI | 4494.563 | -1.136 | FeI |
3.1 Spectral type and atmospheric parameters
3.1.1 Determination of effective temperature
Any attempt devoted to a detailed characterization of the chemical abundance pattern in stellar atmospheres relies on the accuracy of effective temperature and surface gravity determination.
In this study, we derived the effective temperature by using the ionization equilibrium criterion. In practice, we adopted as Teff the value that give the same iron abundance as computed from a sample of spectral lines (both neutral and first ionization stage) present in the spectral range between 4000 Å and 4500 Å (see Tab. 2).
We used the method of the spectral synthesis in order to overpass the strong blending due to relatively high rotational velocity (see below). To perform these calculations we used ATLAS9 (Kurucz, 1993) to compute LTE atmospheric models and SYNTHE (Kurucz & Avrett, 1981) to reproduce the observed spectrum. Line lists and atomic parameters used in our modeling are from Kurucz & Bell (1995) and the subsequent update by Castelli & Hubrig (2004). From the first steps of our iterative procedure, it appeared that the star has a low metal content. Thus, we decided to use Opacity Distribution Functions [ODF] computed for sub-solar metallicity. At the end we estimated Teff = 7000 200 K, computed for ODF = 1. The error on the temperature was estimated to be the the variation in the parameter that increases the by unity.
As a by-product, we obtained an estimate of the projected rotational velocity = 50 5 km/s and an iron abundance = 1.1 0.2. Unfortunately, we were able to obtain only an upper limit for the magnesium abundance 2.
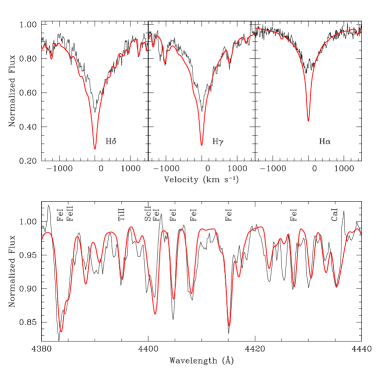
In Figs. 3, we show two portions of our spectral range: one including the Balmer lines and the other covering the spectral range 4380 - 4440 Å, respectively, with the synthetic spectra superimposed.
It is worth mentioning that the metallicity measured for CoRoT 102699796 is rather low with respect to that expected on the basis of recent estimates of the Galactic metallicity gradient (see, e.g. Pedicelli et al., 2009, and references therein), i.e. [Fe/H]-0.5. However, as discussed in Sect.5, it is possible that the region where CoRoT 102699796 formed, is associated with the young open cluster Dolidze 25 and with the star forming complex that include other HII regions (such as Sh 2-284/5), which is known to host stars as metal poor as [Fe/H]-0.8 (Lennon et al., 1990), a value close to that measured for our target star. The reason of such a low metallicity is not clear, and of course needs to be investigated in detail, however this is beyond the scope of the present paper.
3.1.2 Determination of surface gravity and luminosity
For early F-type stars, one of the method commonly used in the literature for the determination of the luminosity class of stars is through the strength of the ratios between the spectral blend at 4172-4179 Å, mostly Feii and Tiii lines, and that at 4271 Å, mostly composed of Fei lines (Gray & Garrison, 1989).
We computed the 4172-4179/4271 ratio which resulted in 1.60 0.15, roughly corresponding to a luminosity class of V (Gray & Garrison, 1989).
To derive the surface gravity of our target, we computed the theoretical behavior of the above ratio as a function of . After having fixed Teff to the value found in Sect. 3.1.1, we computed a grid of ATLAS9 atmospheric models with gravities spanning the range between 3.0 and 4.5 dex. The theoretical equivalent widths and consequently the ratio 4172-4179/4271, have been evaluated using the code XLINOP (Kurucz & Avrett, 1981). By using this curve, we converted our measured ratio and its associated error in a measurement of gravity and of its uncertainty, obtaining: = 3.8 0.4.
Using the above results, we conclude that CoRoT 102699796 has spectral type F1 V.
The atmospheric parameters derived here can be used to estimate the stellar luminosity. To this aim, we use the approach by Balona et al. (2011). Starting from the Stefan-Boltzmann law L=L(Teff,R) where R is the radius and all the quantities are in solar units, we can eliminate the radius from the definition of gravity g=g(R,M), where M is the mass, obtaining a relation L=L(Teff,M,g). Finally, the mass can be eliminated using the empirical mass-luminosity relation by Malkov (2007): =, thus deriving the desired L=L(Teff,g) relation.
By using this relation we obtain log(L/L=1.330.3 for CoRoT 102699796. The relevant stellar parameters for this star are shown in Table 3.
In Figs. 3, we show two portions of our spectral range: one including the Balmer lines and the other covering the spectral range 4380 - 4440 Å, respectively. The synthetic spectra superposed has been calculated using the atmospheric parameters derived as described before and summarized in Tab. 3.
| SpT | Teff | log(g) | [M/H] | sin | L |
|---|---|---|---|---|---|
| (K) | (km/s) | (L⊙) | |||
| F1V | 7000200 | 1.1 | 21 |
4 The evolutionary status of CoRoT 102699796
In this section we deal with the evolutionary status of our target: is it indeed a young intermediate-mass star (Herbig Ae type), as we suspect? We have seen in the previous section that the Balmer lines in the spectrum appear to be filled. This is the first necessary clue. The next steps are to investigate if 1) the star shows infrared excess, and 2) it is possible to associate it with a known star forming region.
4.1 The SED of CoRoT 102699796
We start by building the Spectral Energy Distribution (SED) for CoRoT 102699796. A set of photometric data was collected from the literature. Observations in the and Johnson bands are present in the CoRoT EXO-dat catalogue (Deleuil et al., 2009). The NIR data in the and bands were taken from the 2MASS catalog (Skrutskie et al., 2006; Cutri et al., 2003). Four measurements in the mid- and far-infrared were collected from the AKARI Infrared Astronomical Satellite catalogues IRC (mid-IR all-sky Survey, Ishihara et al., 2010) and FIS (Far-IR all-sky Survey, Yamamura et al., 2010). The data were acquired by the Akari-satellite in four bands centered on 9, 18, 65 and 90 m. The position accuracy in the first two bands is estimated to be better than 2. At larger wavelengths the pixel size is of 26.8 and the average position disagreement between the AKARI-FIS catalogue and the Simbad catalogue is of 6.5 arcsec. The source identified in the AKARI-FIS catalogue is at a distance of 23 arcsec from the coordinates given in the CoRoT catalogue for CoRoT 102699796. Given the pixel sizes of the AKARI camera and the absence of bright sources in a radius of 23 arcsec around CoRoT 102699796, we can state that the observed FIR flux comes from this star. Additional data in the mid-IR can be retrieved from the database of the mission Midcourse Space Experiment (MSX) (Egan et al., 2003). In particular, the target star was detected in the band of the satellite (centered at 8.28 ), which is close in wavelength to the AKARI band. Note that these two independent measures are in perfect agreement one each other (see Fig. 4).
The magnitudes of the star were dereddened by using the relations given in Cardelli et al. (1989) between the Av and the other photometric bands. In order to estimate Av, we compared the , and colours with the ones obtained using the stellar models of Castelli et al. (2004) for the temperature and the metallicity of the star. The E(B-V), E(V-R) and E(V-I) so far derived were then converted to using the transformations of Cardelli et al. (1989) and averaged. The estimated extinction is mag.
The dereddened SED was compared to theoretical
models of star+disk computed using the software ,
a modeling program, written by C.P. Dullemond,
for dusty circumstellar disks, based on the models
of (Chiang & Goldreich, 1997) and (Dullemond et al., 2001).
The basic idea is to model the disk around Herbig Ae/Be stars
with a passive, irradiated disk with an inner hole.
In our case the model which best fit the SED is the one with the parameters
reported in Table 4. The SED with the model fit is shown
in Fig. 4. We note that the luminosity obtained from
the integration of the star’s SED is in excellent agreement with
that estimated from the spectroscopy, as reported in
Tab. 3 (see next section for a discussion about
the distance of the target).
The shape of the SED is typical of transitional circumstellar disks (Calvet et al., 2005).
These usually have an inner region which is depleted of gas and dust and an outer region
which is optically thick. The strong flux rise around 10 m is presumably due to the frontal
illumination of the wall of the optically thick outer disk. Following the classification scheme
of Sartori et al. (2010) for Herbig Ae/Be stars,
CoRoT 102699796 can be identified as a group 2 object, intermediate
between embedded objects and stars with more evolved dusty disks.
These group 2 objects can show a doubly peaked SED
related to a visible central star (first peak)
surrounded by a significant amount of
circumstellar cold matter responsible for the second peak in the mid-
to far-IR band.
In the group 2 objects
of Sartori et al. (2010) the second peak
is similar to the first, like in the case of CoRoT 102699796 (see Fig. 4).

| Parameter | value |
|---|---|
| Distance | 4000 pc |
| Inclination | 60.0o |
| Star mass | 2.0 M⊙ |
| Star luminosity | 20.0 L⊙ |
| Inner disk-radius | 4.0 AU |
| Outer disk-radius | 400 AU |
| Disk mass | 0.06 M⊙ |
| Inner disk-temperature | 450 K |
| Surface density exponent | 2.0 |
5 Membership
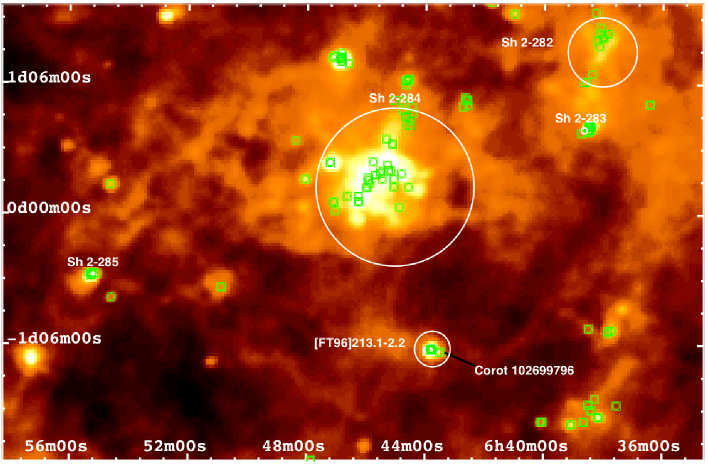
CoRoT 102699796 is placed at an angular distance of 1.65 arcmin from the center of the HII region [FT96]213.1-2.2 (Fich & Terebey, 1996) which extends over 9 arcmin in the Monoceros constellation. Moreover Avedisova (2002) lists 7 young objects close ( 4 arcmin) to CoRoT 102699796. We believe, indeed, that the CoRoT object, together with the 7 young objects, belongs to the [FT96]213.1-2.2 HII region, which is in turn associated with a big star formation structure composed by several HII regions, such as Sh 2-284, Sh 2-283 and Sh 2-285 (Russeil et al., 2007). The distance estimate of this structure is still controversial. Russeil et al. (2007) derived, using also data from literature, a distance of 7.89 kpc. Nonetheless one of the biggest part of the star formation structure, the HII region Sh 2-284, was found to be at a distance of 4 kpc by Cusano et al. (2011), in agreement within the errors with the distance of 3.6 kpc given by Delgado, Djupvik & Alfaro (2010). Furthermore, Rolleston et al. (1994) also found that two B0V stars in Sh 2-285 are at a distance of 4.3 kpc. These results combined together, place the star formation region at a distance of 4-4.5 kpc, closer then the estimate of Russeil et al. (2007). The luminosity of CoRoT 102699796 derived by the frequency analysis (as estimated in Sect 6.2), by the spectroscopic observations and by the SED fitting (see Section 4.1), is also compatible with a distance of the object of 4 kpc. The three colour image shown in Figure 5, obtained by combining IRAS images at 25, 60 and 100 m, illustrates the different components of this large star forming complex. The white open circles are HII regions from the Sharpless (1959) catalogue, while the green circle-square symbols show young stellar objects from Avedisova (2002). CoRoT 102699796 is inside the circle of [FT96]213.1-2.2.
In the spectroscopic analysis, CoRoT 102699796 was found to have a metallicity very similar to that of Sh 2-284, supporting the assumption of a common origin of the [FT96]213.1-2.2 and Sh 2-284 HII regions. If confirmed, this complex has one of the lowest metallicity galactic known SFRs.
6 Interpretation of the observed oscillation frequencies
6.1 Calculation of asteroseismic models
The model analysis performed in this paper is described in detail in Di Criscienzo et al. (2008), and was originally suggested by Guenther & Brown (2004). In summary, given the observed N frequencies of the investigated star, we look for models having 21 within our grid of oscillation spectra, with the following definition of 2
| (1) |
where and are the observed and
the model frequency for the ith mode, respectively, characterized by an
observational and a theoretical
uncertainty. In general, the search for the best-fitting model
(corresponding to the oscillation spectrum that minimizes the
2 value) is concentrated in the subgrid of models with
Teff and L/L⊙ within the error box in Teff and L/L⊙ of
the star. If the program does not find any model matching all the
frequencies with 21, it discards one by one the
non-matched frequencies, computes the 2 for the
remaining frequencies and searches again for models with
21. Among the resulting models satisfying the condition
21, the model with the lowest value of the 2
is the best-fitting one.
The grid of PMS models where constructed
using the ATON code for stellar evolution (Ventura et al., 1998) in the
standard version for asteroseismic applications
(D’Antona et al., 2005). The physics of the models are up-to-date and
described in detail in Di Criscienzo et al. (2008). The ATON code also
allows to include the effects of rotation, according to the
formulation by Endal & Sofia (1976), as described in
Mendes et al. (1999); Landin et al. (2006). The possibility of accounting for the
rotation effects proves to be extremely useful for this analysis,
since PMS stars have on average high rotational velocities
(Böhm & Catala, 1995). In general, what we may determine is the projected
velocity vi, but in this particular case we can derive the true
rotational velocity (60km/s) from the inclination of the disk,
assuming the disk is in the stellar rotation plane,
and this can be used to further fix the best fit model.
We stress here that the approach by Endal & Sofia (1976) accounts only
for the hydrostatic effects of rotation, neglecting the internal
angular momentum redistribution; in this work we use a rigid body
rotation. The initial angular momentum of the star is provided as a
physical input, and chosen to reproduce the observed
surface angular velocity of the star at a given position in the HR diagram.
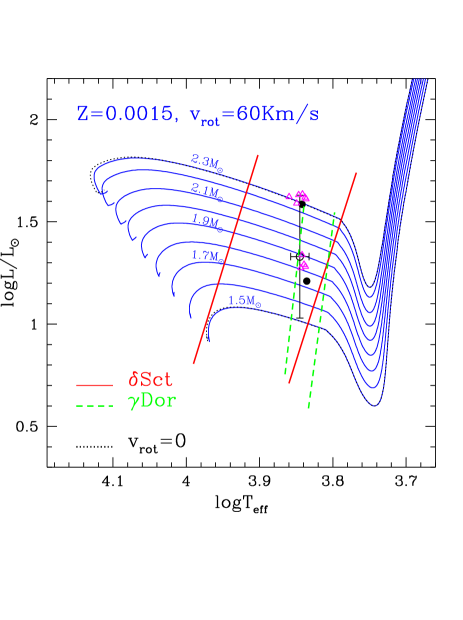
Models were computed from 1.5 to 2.3 M⊙, because these are
the masses that enter in the empirical box in the HR diagram (see
Fig. 6), with a step of M=0.01 M⊙. The
evolution begins on the Hayashi track, and the calculation ends when
the star has reached the MS. We note that neglecting the protostellar
evolution and its effect on the inner structure and pulsation
properties does not change the conclusions of the paper because the
investigated star lie on the horizontal portion of the PMS
evolutionary tracks, subsequent to the thermal relaxing phase
undergone by stars around 2 in the earliest phases of the
PMS evolution. The step in effective temperature between consecutive
models of
the grid is 50K.
We use the LOSC oscillation code by Scuflaire et al. (2008) to calculate
the frequencies of radial and non radial oscillation modes for each
evolutionary structure of the grid. We limit the spherical
degree to l4 and contrary to previous works on PMS pulsating
stars we extend our pulsational analysis also to gravity modes since
the oscillation spectra of this star has an anomalous extension to low
frequencies suggesting that at least the lowest ones could be low
order -modes.
6.2 Comparing observed and predicted frequencies
Among the observed frequencies reported in Table 1 we try to
fit those which are not consistent with a linear combination of the
others, namely f1 to f5, in the order adopted in Table 1.
We also start excluding from the analysis which is too similar to
1 and we suggest that these two frequencies are an example
of frequency pairs (separations lower than 0.7Hz or 0.06 c/d)
present in the power spectra of the majority of the well-studied
Sct stars, as noted by Breger & Bischof (2002). Since the actual
cause for this
phenomenon is still unknown we prefer to remove from our fitting procedure.
In this way we have four observed frequencies to be fitted with
computed ones in order to find the best fit model through the
2 analysis.
We assume as uncertainties on observed frequencies in
eq. 1 values which are 3- the observational errors
given in Section 2.1 and consider conservatively theoretical errors
of the same order of magnitude of the observational ones, taking into
account all the intrinsic numerical uncertainties of models
(see Moya, 2007, for a detailed quantitative description).
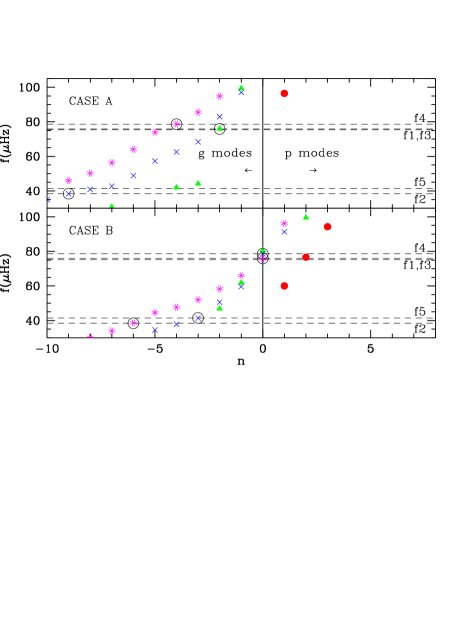
As a result we find that the best fit model corresponds to a very young star (t3 Myr, with no convective core yet) with M=1.74 M⊙, Tteff=6850K (CASE A in Table 5). We note that the 2 reported in table is calculated on the basis of the first three frequencies because unfortunately this model does not match frequency f5, which however is the one with the lowest S/N ratio (see Tab. 1). Moreover, if we allow 2 to be , we find that a much more massive model (described in Table 5 as CASE B) minimizes 2. According to this model, only two frequencies are pure g-mode of low order.
We remark that in the analysis described above the rotation of the star (see Sect. 3) was considered only in the computation of the evolutionary model. For completeness we recall that if denotes the frequency in the absence of rotation, a slow solid rotation with angular velocity slightly alters the frequency with l0 in the following way:
| (2) |
where is a quantity described in detail in Di Criscienzo et al. (2008) and calculated by the adiabatic oscillation code for each pair (l,n). We then relaxed the previous constraint used to find the best fit model by adding the multiplet (triplet and quintuplet, etc. according to eq. 2) frequencies to our predictions, and we compared again theory and observations using the same technique as above (but this time trying to fit also ). As a result, the number of best-fitting models grows in number, as shown in Tab. 6, where we list all the models between and (i.e. within 1 ). However, when we report these models in the HR diagram (empty triangles in Fig. 6), we find out the very interesting result that these models cluster around or close to the two best fit models previously found, namely CASE A and B. This occurrence suggests that models consistently predict two possible solutions for the position of the star in the HR diagram: a) with LogL/L 1.21.3 and M/M 1.8; b) with LogL/L 1.6 and M/M 2.3. To decide which “class” of models has to be preferred, we note that the “class a)” are the favoured models because: i) they produce the lowest values for the 2 and ii) their luminosities are in better agreement with the values inferred from spectroscopy and from the integration of the SED (although at least formally also the luminosity of class b) models are in agreement with the spectroscopic value at 1 ). On the basis of the above considerations, our best-fit model is the one that minimize the 2 (model a1 in Tab. 6), with mass, effective temperature and luminosity of 1.84 M/M⊙, 6900 K, and 1.29 LogL/L⊙, respectively. Similarly to CASE A, it is a young model (2.5 Myr) still without a convective core. It is important to note that the observed frequency spectrum can be interpreted in terms of -modes with low-moderate n-value for class a) models, whereas class b) models are characterized by both - and -modes.
| obs,1 | obs,2 | obs,4 | obs,5 | |||||
| 75.91 | 38.40 | 78.62 | 41.46 | |||||
| (Hz) | (Hz) | Hz) | (Hz) | |||||
| CASE | 2 | M/M⊙ | Teff(K) | LogL/L⊙ | th,1(l,n) | th,2(l,n) | th,4(l,n) | th,5(l,n) |
| A | 0.83 | 1.74 | 6850 | 1.21 | 75.89(1,-2) | 38.36(2,-9) | 78.67(3,-4) | 41.98333This frequency is not considered in the computation of 2 (see text)(1,-4) |
| B | 4.92 | 2.29 | 6950 | 1.59 | 75.66(3,0) | 38.57(3,-6) | 78.59(2,0) | 41.33(2,-3) |
These results, if confirmed, would be of crucial importance because it
would be the first time that -modes are detected in a Herbig Ae
pulsating star. An even more complicate picture emerges if we
consider that CoRoT 102699796 lies (see Fig. 6) in the region
of the HR diagram where Sct and Dor instability
strips intersect (at least for solar metallicity, see
e.g. Handler & Shobbrook, 2002). We recall that the frequency spectrum of
Dor stars is interpreted in terms of high radial order -modes. Our
findings suggest that CoRoT 102699796 shows a frequency spectrum with
intermediate properties between Sct and Dor,
characterized by frequencies lower and higher than those typical of
Sct and Dor variables, respectively. In fact,
according to our interpretation this star is a pre-main sequence
pulsator which shows -modes of low-moderate radial number and order in its
frequency spectrum (or both - and -modes, see above). In this context, it is worth noticing that hybrid
Sct- Dor pulsators were already found among more
evolved stars by several authors(see,
e.g. Henry & Fekel, 2005; King et al., 2006; Rowe et al., 2006; Handler, 2008). Moreover, the recent data
obtained with the KEPLER satellite seem to show that the hybrid
phenomenon is more
common than expected (Grigahcène et al., 2010; Catanzaro et al., 2010).
However, prior to arrive to firm conclusions concerning the nature of
CoRoT 102699796, a more detailed theoretical study is necessary by
using a non-adiabatic oscillation code for a stability analysis of the
selected modes.
Furthermore the main feature of non-adiabatic codes as
MAD (Dupret et al., 2003) is their ability to determine accurately
the amplitudes and phases of variation of different physical
quantities in the very outer layers of the stars. In particular the
normalized amplitude and phase of effective temperature variations
can be determined, significantly improving the accuracy of the mode
identification methods through multi-band photometric approaches.
An important point is that the non-adiabatic predictions are very
sensitive to the modelling of the thin convective envelope of these
stars and to the treatment of its interaction with pulsation, thus only
time dependent convective versions of these codes would be able
to reproduce both the blue and the red edge of the instability
region of each mode.
| 75.91 | 38.40 | 75.61 | 78.62 | 41.46 | |||||
| (Hz) | (Hz) | (Hz) | Hz) | (Hz) | |||||
| MODEL | 2 | M/M⊙ | Teff(K) | LogL/L⊙ | l,m,n | l,m,n | l,m,n | l,m,n | l,m,n |
| a1 | 0.28 | 1.84 | 6900 | 1.29 | 3, 1,-3 | 3,1,-8 | 3,2,-5 | 3,-2,-2 | 3,-1,-8 |
| b1 | 0.37 | 2.28 | 7050 | 1.59 | 3,-1,0 | 3,1,-7 | 2,-2,0 | 2,-2,0 | 2,2,-5 |
| b2 | 0.46 | 2.36 | 7000 | 1.63 | 3,-2,1 | 3,2,-7 | 2,0,0 | 2,1,0 | 2,2,3 |
| a2 | 0.84 | 1.90 | 6950 | 1.34 | 3,3,-5 | 1,0,-3 | 2,1,-2 | 3,-1,-2 | 3,2,-4 |
| b3 | 0.86 | 2.32 | 7250 | 1.62 | 2,1,0 | 2,0,-3 | 3,2,0 | 2,2,0 | 3,-1,-3 |
| a3 | 0.88 | 1.83 | 6875 | 1.28 | 3,1,-3 | 1,-1,-3 | 2,0,-2 | 3,-2,-2 | 3,2,-15 |
| b4 | 0.90 | 2.35 | 6850 | 1.61 | 2,1,0 | 2,0,-3 | 3,2,0 | 2,2,0 | 3,2,-6 |
| b5 | 0.90 | 2.38 | 6950 | 1.64 | 3,-1,1 | 2,0,-3 | 3,2,0 | 2,2,0 | 2,2,-6 |
| b6 | 1.00 | 2.36 | 6900 | 1.61 | 3,-1,1 | 2,0,-3 | 3,2,0 | 2,2,0 | 2,2,-6 |
| a4 | 1.14 | 1.81 | 6975 | 1.27 | 2,-1,-2 | 1,-1,-4 | 3,-3,-5 | 3,-3,- 2 | 3,3,-19 |
7 Discussion and conclusions
In this paper we presented a comprehensive study of CoRoT 102699796, a star observed by the CoRoT satellite during its first Long Run in the anticenter direction. The star was classified as Sct and shows anomalous Balmer lines at a first analysis of mid-resolution spectra obtained with GIRAFFE@VLT, thus being a likely candidate of the PMS Sct class.
We analysed the time-series photometry observed by the satellite CoRoT, detecting the presence of five independent oscillation frequencies in the range 3-6.5 c/d. These low values are somewhat atypical for PMS and “normal” Sct variables, whose peaks are usually placed around 10-30 c/d.
The star’s physical parameters were estimated on the basis of the quoted GIRAFFE@VLT mid-resolution spectra, finding that the star has spectral type F1V, Teff=7000200 K, log(g)=, [M/H]=-1.1, sin= km/s, L/L⊙=21. Therefore CoRoT 102699796 is the first intermediate-mass PMS pulsating star for which poor metallicity has been reported.
The evolutionary status of the target star has been explored in detail by constructing the SED, extending from the optical to the mid-infrared, using ground-based and satellite data. As a result, we find that the shape of the SED is typical of transitional circumstellar disks. Following the classification scheme of Sartori et al. (2010) for Herbig Ae/Be stars, CoRoT 102699796 can be identified as a group 2 object, i.e. between embedded objects and stars with more evolved dusty disks. Its PMS nature is reinforced by the possible association with the HII region [FT96]213.1-2.2 (Fich & Terebey, 1996).
The pulsation frequencies have been interpreted in the light of the non-radial pulsation theory, using the LOSC program (Scuflaire et al., 2008) in conjunction with static and rotational evolutionary tracks calculated by means of the ATON code for stellar evolution (Ventura et al., 1998) in the standard version for asteroseismic applications with low metallicity (D’Antona et al., 2005). A minimization algorithm was used to find the model that matches the observed frequencies. As a result, either including or not the rotation, we find two possible solutions for the position of the star in the HR diagram: a) with LogL/L 1.21.3 and M/M 1.8; b) with LogL/L 1.6 and M/M 2.3. Models with lower mass and luminosity are preferred because: i) they minimize the 2 and ii) their luminosities are in better agreement with the values inferred from the spectroscopically estimated logg and from the integration of the star’s SED. Finally, the model named a1 in Tab. 6 is our best-fit model (minimum 2 using all the five significant frequencies), having mass, effective temperature, and luminosity equal to 1.84 M/M⊙, 6900 K, and 1.29 LogL/L⊙, respectively. The position in the HR diagram of this model is in excellent agreement with the spectroscopic one. The model is very young (age2.5Myr) without a convective core, in agreement with the shape of the SED that shows a significant FIR excess. The theory-observation match is based on the interpretation of frequencies as -modes of low-moderate n-value. To our knowledge, this is a new result and the first time that such modes are observed in PMS intermediate-mass pulsating stars. However, this is not completely surprising since it is also the first time that a so low frequency range is observed in a pulsating Herbig Ae star. In this context, it is also remarkable that CoRoT 102699796 lies in the region of HR diagram where Sct and Dor instability strips intersect. Hence we are probably dealing with a star showing intermediate (hybrid) characteristics in between the two variability classes. However, we note that if the solution predicted by class a) models applied, the star could not properly be defined as an hybrid because only -modes would be present. In this case it would be better defined as a PMS anomalous Dor star.
Acknowledgments
We warmly thank our referee, Torsten Böhm, for his pertinent and
useful comments that helped us to improve the manuscript.
It is a pleasure to thank Ennio Poretti for many helpful
discussions.
This work was supported by the Italian ESS project, contract ASI/INAF
I/015/07/0, WP 03170 and by the European Helio- and Asteroseismology
Network (HELAS), a major international collaboration funded by the European
Commission’s Sixth Framework Programme.
This research has made use of the SIMBAD database, operated at CDS, Strasbourg,
France. This publication makes use of data products from the Two Micron All Sky
Survey, which is a joint project of the University of Massachusetts and the
Infrared Processing and Analysis Center/California Institute of Technology, funded
by the National Aeronautics and Space Administration and the National Science
Foundation.
Piet Reegen, author of several
analysis packages used in this work, has passed away a few months
ago. We wish to give our deepest sympathy to his relatives and
friends.
References
- Auvergne et al. ( 2009) Auvergne, M., Bodin, P., Boisnard, L., et al. 2009, A&A, 506, 411
- Avedisova (2002) Avedisova V.S. 2002, ARep, 46, 193
- Baglin et al. ( 2007) Baglin, A., Auvergne, M., Barge, P., et al. 2007, AIPC, 895, 201
- Balona et al. ( 2011) Balona, L., Ripepi, V., Catanzaro, G., Kurtz, D.W., Smalley, B., et al. 2011, MNRAS, in press
- Bernabei et al. (2009) Bernabei, S., Ripepi, V., Ruoppo, A., et al. 2009, A&A, 501, 279
- Böhm et al. (2009) Böhm, T., Zima, W., Catala, C., Alecian, E., Pollard, K., Wright, D. 2009, A&A, 497, 183
- Böhm & Catala ( 1995) Böhm & Catala, 1995, A&A, 301, 155
- Breger & Bischof (2002) Breger, M. & Bischof, K. M., A&A,2002, 385, 537
- Breger et al. (2005) Breger, M., Lenz, P., Antoci, V., et al. 2005, A&A, 435, 955
- Breger & Pamyatnykh (1998) Breger, M., Pamyatnykh, A. A., 1998, A&A, 332, 958
- Breger et al. (1993) Breger M., Stich J., Garrido R., et al. 1993, A&A, 271, 482
- Calvet et al. (2005) Calvet, N., D’Alessio, P., Watson, D. M. 2005, ApJ, 630L, 185
- Cardelli et al. (1989) Cardelli Jason A., Clayton Geoffrey C., Mathis John S. 1989, ApJ, 345, 245
- Castelli & Hubrig (2004) Castelli F., Hubrig S., 2004, A&A, 425, 263
- Castelli et al. (2004) Castelli, F., Kurucz, R. L. 2004, IAU Symp. No 210, Modelling of Stellar Atmospheres, eds. N. Piskunov et al. 2003, poster A20, also astro-ph, 045087
- Catala (2003) Catala, C. 2003, Ap&SS, 284, 53
- Catanzaro et al. (2010) Catanzaro G., Ripepi V., Bernabei S., et al. 2010, MNRAS, 411, 1167
- Chiang & Goldreich (1997) Chiang, E. I., Goldreich, P. 1997, ApJ, 490, 368
- Cusano et al. (2011) Cusano, F., Ripepi, V., Alcalá, J. M., et al. 2011, MNRAS, 410, 227
- Cutri et al. (2003) Cutri R. M., Skrutskie M. F., van Dyk S. et al , 2003, tmc book
- D’Antona et al. (2005) D’Antona, F., Cardini, D., Di Mauro, M. P., Maceroni, C., Mazzitelli, I., & Montalban, J. 2005, MNRAS, 363, 847
- Daszynska-Daszkiewicz et al. (2002) Daszynska-Daszkiewicz, J., Dziembowski, W. A., Pamyatnykh, A. A., Goupil, M.-J., 2002, A&A, 392, 151
- Debosscher et al. (2009) Debosscher J., Sarro L. M., López M., Deleuil M., Aerts, C. et al. 2009, A&A, 506, 519
- Deleuil et al. (2009) Deleuil, M., Meunier, J. C., Moutou, C. et al. 2009, AJ, 138, 64
- Delgado, Djupvik & Alfaro (2010) Delgado, A. J., Djupvik, A. A., Alfaro, E. J., 2010, A&A, 509, 104
- Di Criscienzo et al. (2008) Di Criscienzo, M.; Ventura, P.; D’Antona, F.; Marconi, M.; Ruoppo, A.; Ripepi, V., 2008, MNRAS, 389, 325
- Dullemond et al. (2001) Dullemond, C. P., Dominik, C., Natta, A 2001, ApJ, 560, 957
- Dupret et al. (2003) Dupret, M.-A., De Ridder, J., De Cat, P., Aerts, C., Scuflaire, R., Noels, A., Thoul, A. 2003, A&A, 398, 677
- Egan et al. (2003) Egan, M. P., Price, S. D., Kraemer, K. E., Mizuno, D. R., Carey, S. J., Wright, C. O., Engelke, C. W., Cohen, M., Gugliotti, M. G.: “MSX6C Infrared Point Source Catalog. The Midcourse Space Experiment Point Source Catalog Version 2.3 (October 2003)”. Air Force Research Laboratory Technical Report AFRL-VS-TR-2003-1589 (2003)
- Endal & Sofia (1976) Endal, A. S., & Sofia, S. 1976, ApJ, 210, 184
- Fich & Terebey (1996) Fich, M., Terebey, S. 1996, ApJ, 472, 624
- Fumel & Böhm (2008) Fumel, A, & Böhm, T. 2008, CoAst, 157, 309
- García Hernández et al. (2009) García Hernández, A., Moya, A., Michel, E., et al. 2009, A&A, 506, 79
- Gray & Garrison (1989) Gray R. O., Garrison R. F., 1989, ApJS, 69, 301
- Grigahcène et al. (2006) Grigahcène, A., Dupret, M.-A., Garrido, R., Gabriel, M., Scuflaire, R. 2006, CoAst, 147, 69
- Grigahcène et al. (2010) Grigahcène A., Antoci V., Balona L., et al. 2010, ApJ, 713, L192
- Guenther & Brown (2004) Guenther, D. B. & Brown, K. I. T. 2004, ApJ, 600, 419
- Guzik et al. (2000) Guzik J.A., Kaye A.B., Bradley P.A., Cox A.N., & Neuforge C., 2000, ApJ, 542, L57
- Handler & Shobbrook (2002) Handler G., Shobbrook R. R., 2002, MNRAS, 333, 2, 251
- Handler (2008) Handler G., 2008, CoAst, 159, 42
- Henry & Fekel (2005) Henry G. W., Fekel F. C. 2005, AJ, 129, 2026
- Ishihara et al. (2010) Ishihara D., Onaka T., Kataza H. et al. 2010, A&A, 514A, 1
- Kallinger, Reegen, & Weiss (2008) Kallinger, T., Reegen, P., Weiss, W. W. 2008, A&A, 481, 571
- Kennelly (1994) Kennelly, E. J. 1994 PhD thesis
- Kennelly & Walker (1996) Kennelly, E. J., and Walker, G. A. H. 1996, PASP, 108, 327
- King et al. (2006) King H., Matthews J. M., Rowe J. F., et al. 2006, CoAst, 148, 28
- Kurtz & Marang (1995) Kurtz, D. W., & Marang, F. 1995, MNRAS, 276, 191
- Kurucz & Bell (1995) Kurucz R. L., Bell B., 1995, Kurucz CD-ROM No. 23. Cambridge, Mass.: Smithsonian Astrophysical Observatory.
- Kurucz (1993) Kurucz R.L., 1993, A new opacity-sampling model atmosphere program for arbitrary abundances. In: Peculiar versus normal phenomena in A-type and related stars, IAU Colloquium 138, M.M. Dworetsky, F. Castelli, R. Faraggiana (eds.), A.S.P Conferences Series Vol. 44, p.87
- Kurucz & Avrett (1981) Kurucz R.L., Avrett E.H., 1981, SAO Special Rep., 391
- Landin et al. (2006) Landin N.R., Ventura P., D’ Antona F., Mendes L.T.S., Vaz L.P.R. 2006, 456, 269
- Lennon et al. (1990) Lennon D. J., Dufton P. L., Fitzsimmons A., Gehren T., Nissen P. E. 1990, A&A, 240, 349
- Lenz & Breger (2005) Lenz, P. & Breger, M. 2005, CoAst, 146, 53
- Malkov (2007) Malkov, O. Y., 2007, MNRAS, 382, 1073
- Marconi & Palla (1998) Marconi, M., & Palla, F. 1998, ApJ, 507, L141
- Mendes et al. (1999) Mendes, L. T. S., D’Antona, F., & Mazzitelli, I. 1999, A&A, 341, 174
- Mislis et al. (2010) Mislis, D., Schmitt, J. H. M. M., Carone, L., Guenther, E. W., Pätzold, M. 2010, A&A, 522, 86
- Moya (2007) Moya, A. 2007, EAS, 6, 187
- Pasquini et al. (2002) Pasquini L., Avila G., Blecha A., et al. 2002, Msngr, 110, 1
- Pedicelli et al. (2009) Pedicelli S., Bono G., Lemasle B. et al. 2009, A&A, 504, 81
- Poretti et al. (2009) Poretti, E., Michel, E., Garrido, R., et al. 2009, A&A, 506, 85
- Reegen (2007) Reegen, P. 2007, A&A, 467, 1353
- Reegen (2010) Reegen, P. 2010, CoAst, in press, astro-ph1006.5083
- Ripepi et al. (2003) Ripepi, V., Marconi, M., Bernabei, S., et al. 2003, A&A, 408, 1047
- Ripepi et al. (2006) Ripepi, V., Marconi, M., Palla, F. et al. 2006, Mem. Soc. Astron. It., 77, 317
- Rodríguez et al. (2006) Rodríguez, E., Amado, P. J., Suárez, J. C., Moya, A., Dupret, M. A., Poretti, E., Grigahcène, A., Costa, V., López-González, M. J., 2006, A&A, 450, 715
- Rolleston et al. (1994) Rolleston, W.R.J., Dufton, P.L., Fitzsimmons A. 1994, A&A, 284,72
- Rowe et al. (2006) Rowe J. F., Matthews J. M., Cameron C. et al. 2006, CoAst, 148, 34
- Ruoppo et al. (2007) Ruoppo, V., Marconi, M., Marques, J.P. et al. 2007, A&A, 466, 261
- Russeil et al. (2007) Russeil, D., Adami, C., Georgelin, Y. M. et al. 2007, A&A, 470, 161
- Sartori et al. (2010) Sartori, M. J., Gregorio-Hetem, J., Rodrigues, C. V., Hetem, A., Batalha, C. 2010, AJ, 139, 27
- Scuflaire et al. (2008) Scuflaire, R., Montalbán, J., Théado, S., Bourge, P.-O., Miglio, A., Godart, M., Thoul, A., Noels, A. 2008, Ap&SS, 316, 149
- Sharpless (1959) Sharpless S. 1959, ApJS, 4, 257
- Skrutskie et al. (2006) Skrutskie, M. F., Cutri, R.M., Stiening, R., Weinberg, M.D., Schneider, S. et al., 2006, AJ, 131, 1163
- Suran et al. (2001) Suran, M., Goupil, M., Baglin, A., Lebreton, Y., Catala, C. 2001, A&A, 372, 233
- van den Ancker et al. (1998) van den Ancker, M.E., de Winter, D., Tjin, A., and Djie, H.R.E., 1998, A&A, 330, 145
- Ventura et al. (1998) Ventura, P., Zeppieri, A., Mazzitelli, I., D’Antona, F. 1998, A&A, 334, 953
- Yamamura et al. (2010) Yamamura, I., Makiuti, S., Ikeda, N. et al. 2010, yCat, 2298, 0
- Zima (2008) Zima, W. 2008, CoAst, 155, 17
- Zwintz (2008) Zwintz K. 2008, ApJ, 673, 1088
- Zwintz et al. (2009) Zwintz, K., Hareter, M., Kuschnig, R., et al. 2009, A&A, 502, 239