Uncovering the Spectral Energy Distribution in Active Galaxies Using High Ionization Mid-infrared Emission Lines
Abstract
The shape of the spectral energy distribution of active galaxies in the EUV–soft X-ray band (13.6 eV to 1 keV) is uncertain because obscuration by dust and gas can hamper our view of the continuum. To investigate the shape of the spectral energy distribution in this energy band, we have generated a set of photoionization models which reproduce the small dispersion found in correlations between high-ionization mid-infrared emission lines in a sample of hard X-ray selected AGN. Our calculations show that a broken power-law continuum model is sufficient to reproduce the [Ne V]14.32µm/[Ne III], [Ne V]24.32µm/[O IV]25.89µm and [O IV]25.89µm/[Ne III] ratios, and does not require the addition of a “big bump” EUV model component. We constrain the EUV–soft X-ray slope, , to be between 1.5 – 2.0 and derive a best fit of for Seyfert 1 galaxies, consistent with previous studies of intermediate redshift quasars. If we assume a blue bump model, most sources in our sample have derived temperatures between K to K, suggesting that the peak of this component spans a large range of energies extending from Å to Å. In this case, the best fitting peak energy that matches the mid-infrared line ratios of Seyfert 1 galaxies occurs between – Å. Despite the fact that our results do not rule out the presence of an EUV bump, we conclude that our power-law model produces enough photons with energies 4 Ry to generate the observed amount of mid-infrared emission in our sample of BAT AGN.
1 Introduction
Active galactic nuclei (AGN) produce an extraordinary amount of energy which is thought to be primarily thermal emission from an optically thick accretion disk fueling a supermassive black hole (e.g., Peterson et al., 2004). Accretion can produce a characteristic feature in the ultraviolet continuum of most AGN known as the “big blue bump” (bbb, Shields, 1978; Malkan & Sargent, 1982) and it has been argued that its energy peak lies around the Lyman limit (e.g., Zheng et al., 1997; Telfer et al., 2002; Shang et al., 2005). The problem is that in AGN the soft X-ray–extreme-ultraviolet spectral energy distribution (SED) can be hidden because of dust and gas, thus making a direct view of the full energy distribution impossible. A common approach is to study high redshift quasars where the rest-frame extreme-ultraviolet (EUV, 100–912 Å) can be observed from the ground. However, for the local universe at z 0.05 we need to rely on space-borne telescopes and/or other indirect methods to uncover the shape of the SED in this particular range of energies.
Within the paradigm of the unified model of AGN (e.g., Antonucci, 1993) both Type 1 and Type II AGN are intrinsically the same, with their observed difference being due to the visibility of the central engine. An optically-thick toroidal structure surrounds the central source, located at distances just beyond the broad line region (BLR). Emission that arises further out in the narrow line region (NLR), hundreds of parsecs in extent, is expected to be fairly unobstructed and isotropic, i.e., independent of our viewing angle. However, absorption, dust extinction and star formation may hamper the use of soft X-ray, optical and infrared observables on these larger-than-torus scales (e.g., Mulchaey et al., 1994; Kraemer et al., 2010).
One way to bypass the above limitations is to focus on high-ionization (), mid-infrared emission lines. To be produced, they require photons with energies between 40-100eV (EUV–Soft X-ray), and so we can assume that they are primarily associated with the AGN, in other words, they are less contaminated by star formation processes. Also, they are less sensitive to dust extinction than optical lines. In this regard, it is possible to fit these observed lines via photoionization models in order to constrain the AGN continuum in this energy band (e.g., Alexander et al., 1999, 2000). Among the mid-infrared properties of Seyfert galaxies, the correlations between high-ionization emission lines, [Ne III] 15.56 µm, [O IV] 25.89 µm and [Ne V] 14.32/24.32 µm, are strikingly tight, with a dispersion of less than dex, both in flux and luminosity (see Gorjian et al., 2007; Dudik et al., 2009; Goulding & Alexander, 2009; Meléndez et al., 2008b; Weaver et al., 2010; Pereira-Santaella et al., 2010). The [Ne V] emission, given the high energy require to be produce (98.9 eV), has been unambiguously identified with the presence of an AGN (see Satyapal et al., 2007; Abel & Satyapal, 2008; Bernard-Salas et al., 2009; Weaver et al., 2010), therefore, the strong correlation between this emission and the lines produced from transitions of [Ne III] ( 41.0 eV) and [O IV] ( 54.9 eV) suggest that these lines are produced primarily by the AGN. Moreover, Meléndez et al. (2008a) probed the utility of high-ionization mid-infrared lines as an indicator of AGN power. They found a tight correlation, with a dispersion of , in Seyfert 1 galaxies, between the [O IV] and the X-ray 14-195 keV continuum luminosities. A weaker correlation was found for Seyfert 2 galaxies, which we believe is due to the effect of Compton Scattering in the 14-195 keV band in some Seyfert 2 galaxies. This result has since been confirmed in similar studies (e.g., Rigby et al., 2009; Diamond-Stanic et al., 2009; Weaver et al., 2010).
Our aim is to recover the hidden portion of the spectral energy distribution of AGN between the EUV and the soft X-ray (13.6 eV to 1 keV). To do this we have performed extensive photoionization calculations to characterize the small dispersion found in the correlations between high-ionization, mid-infrared emission-line ratios. We compare our calculations with emission line ratios from Spitzer/IRS spectra of the Swift Burst Alert Telescope (BAT) AGN sample111The Swift/BAT covers the whole sky at (1–3) and represents a complete sample of active galaxies including Compton-thin AGN that were missed from previous X-ray surveys in the 2-10 keV band because of their high column densities ( ). of the local universe, presented in Weaver et al. (2010). All of our calculations have been carried-out by the photoionization code CLOUDY, version 08.00, last described by Ferland et al. (1998).
2 The Models
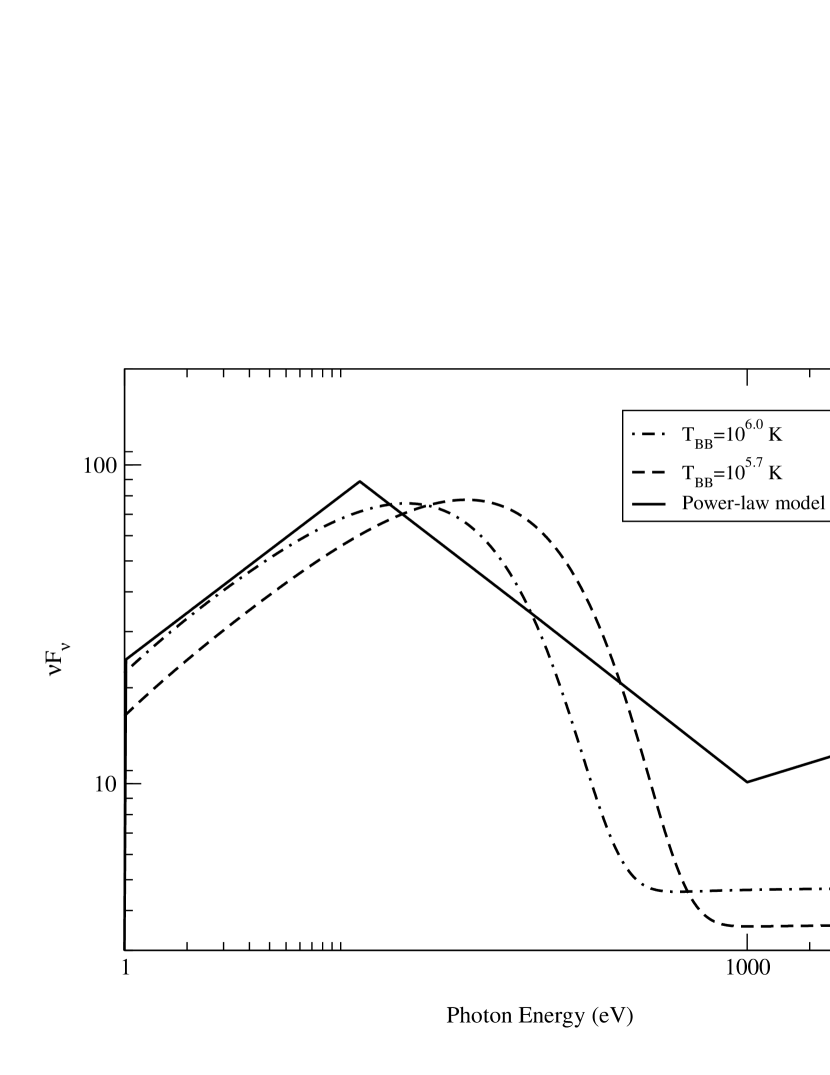
We have generated two sets of photoionization models to study the intrinsic SED of the ionizing continuum. The first assumes a broken power law, as used by Meléndez et al. (2008a) and similar to that suggested for NGC 5548 and NGC 4151 (Kraemer et al., 1998, 2000), of the form , with below 13.6 eV, from 13.6 eV to 1 keV and 0.8 at higher energies. To examine specifically the EUV/soft X-ray band, we varied from 1.0 to 2.5. Our second model is a parametrization of the AGN continuum that combines an X-ray power law and a “blue bump” component, in the form:
| (1) |
where is the low-energy slope of the Big Blue Bump continuum, is the UV bump cut-off temperature and is the infrared cut-off temperature of the big bump, corresponding to 9.1 . For the X-ray power-law, is the slope of the X-ray component and the coefficient is adjusted to produce the correct UV to X-ray slope (Tananbaum et al., 1979), , as defined by
| (2) |
For the “big bump” model we adopted a value for the UV to X-ray spectral slope of (Zamorani et al., 1981), in good agreement with recent studies of Type I AGN (Lusso et al., 2010). We fixed the low-energy slope of the big blue bump continuum to (e.g., Francis et al., 1993). For the X-ray power-law, we adopted a value of . This parametrization is similar to that of Mathews & Ferland (1987) and Korista et al. (1997). Finally, for this model we considered five values for the UV bump cutoff temperature, from K to K. Figure 1 compares the SED for our different photoionization models.
To investigate the physical conditions in the emission line regions for the [O IV], [Ne III] and [Ne V] lines, we started with a simple, single-zone, constant density model. The logs of abundances of Oxygen and Neon relative to H by number are -3.31 and -4.0, respectively, where the O abundance is from Allende Prieto et al. (2001) and the Ne abundance is from Holweger (2001). We considered hydrogen column densities of and . Despite the fact that dust is likely mixed in with the emission-line gas in the NLRs of Seyfert galaxies (e.g., Kraemer & Harrington, 1986; Netzer & Laor, 1993), the tightness of the mid-infrared correlation suggest that extinction in the mid-infrared, on average, is not an important bias in our sample of X-ray selected AGN (Weaver et al., 2010).
We generated a grid of photoionization models varying the total hydrogen number density, (), and the ionization parameter, , where the ionization parameter is defined as (see Osterbrock & Ferland, 2006):
| (3) |
where R is the distance to the cloud, c is the speed of light and is the flux of ionizing photons. In the next section we will compare these models with the line ratios observed from the BAT AGN sample.
3 Comparison with Observations
3.1 Density in the Emission Line Regions
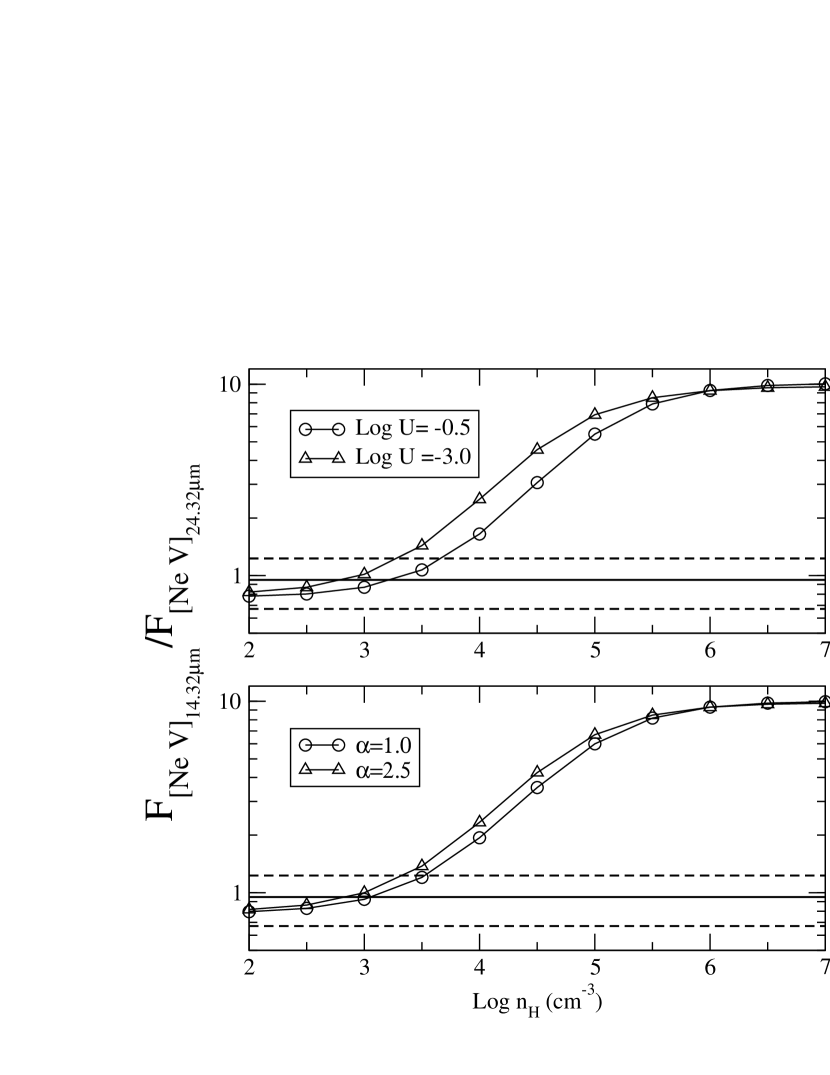
The use of emission lines that are close in ionization potential but different critical densities can be used as a density diagnostic of photoionized plasmas (e.g., Osterbrock & Ferland, 2006). In particular, the mid-infrared [Ne V] ratio, [Ne V]14.32µm/[Ne V]24.32µm, has been used as a density diagnostic in active galaxies (e.g., Dudik et al., 2007; Tommasin et al., 2010) with the caveat that a wavelength-dependent mid-infrared extinction can affect this ratio, as suggested by the number of Seyfert galaxies that have [Ne V] ratios below the theoretical low density limit (e.g., Tommasin et al., 2010; Weaver et al., 2010; Pereira-Santaella et al., 2010). However, the mid-infrared extinction curve derived by Weingartner & Draine (2001) and Li & Draine (2001) (e.g, see Figure 16 in Li & Draine, 2001) fails to predict the required dust extinction at and to explain the observed [Ne V] ratios that fall below the low density limit in the BAT sample (Weaver et al., 2010). Therefore, since the relation between the [Ne V] ratio and extinction is not fully understood, we minimized the possible effect of reddening toward the NLR by focusing on the [Ne V] ratio observed in Seyfert 1 galaxies as detailed multi-wavelength studies on Seyfert galaxies suggest more extinction of emission from the NLR in Seyfert 2 galaxies than in Seyfert 1s (e.g., Meléndez et al., 2008a; Kraemer et al., 2011). Following the work on the mid-infrared properties of the BAT sample of AGN (Weaver et al., 2010) we found an average neon ratio observed in Seyfert 1 galaxies of [Ne V]14.32µm/[Ne V] (see Table LABEL:mean).
We used the optimize222For a full description on the optimization methods see CLOUDY documentation, Hazy 1, at http://www.nublado.org/ command in CLOUDY to vary and to reproduce the observed neon ratio. From this, and by using our “power-law” model with for a total hydrogen column density of , we obtained a value of and . For our “blue bump” model, assuming a cutoff temperature of K such that the energy of the UV bump peaked at eV (e.g., Korista et al., 1997), we obtained a value of and . For a total hydrogen column density of we obtained a value of and for our power-law models and, from our “blue bump” model, assuming a cutoff temperature of K, we obtained a value of and . In Figure 2 we present the neon ratio versus the total hydrogen number density for these models for a range of ionization parameters and EUV/Soft X-ray slopes. Figure 2 shows that, close to the observed values, the neon ratio is not strongly sensitive to the SED of the ionizing radiation.
From the different models and continuum approximations we obtained a total hydrogen number density of . One must note that this value represents the density only of the [Ne V] emission-line gas. However, this density is in agreement with the values found from the photoionization modeling of the [O IV] emitting region presented in Meléndez et al. (2008a), suggesting that the [Ne V] and [O IV] emitting regions are essentially co-located. On the other hand, this density is smaller than that found by Baskin & Laor (2005) for the [O III] emitting region in their single-zone approximation, i.e., . However, they found that the observed [O III] 5007, [O III] 4363 and H lines can also be fitted using two-zone model comprised of a a dense () inner zone, dominated by the [O III] 4363 emission, and a low density, more extended zone (), where most of the [O III] 5007 arises. Our density value is similar to that used in their low-density zone, although the densities in their two-zone approximation are based on fixed assumed values, whereas our density is derived from the fit to the observed [Ne V] ratio.
3.2 The EUV–Soft X-ray slope
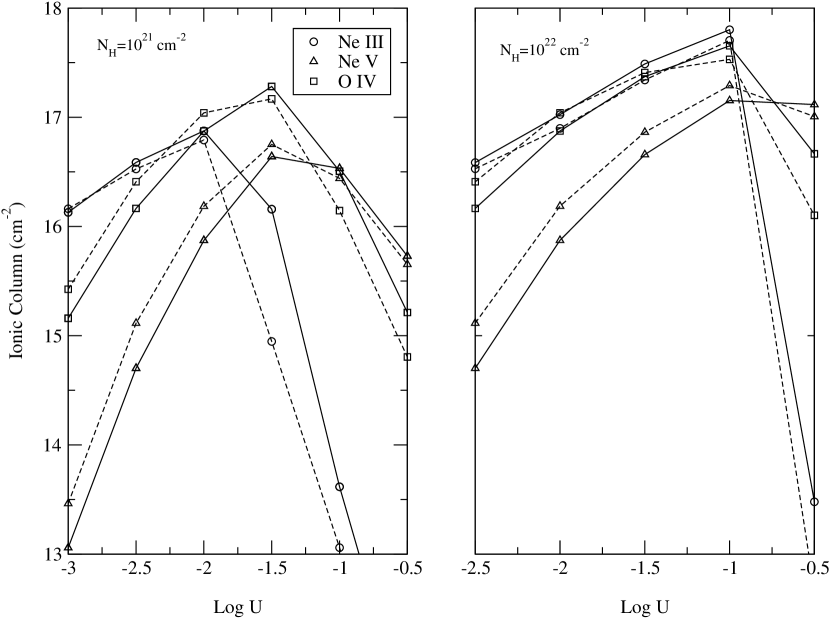
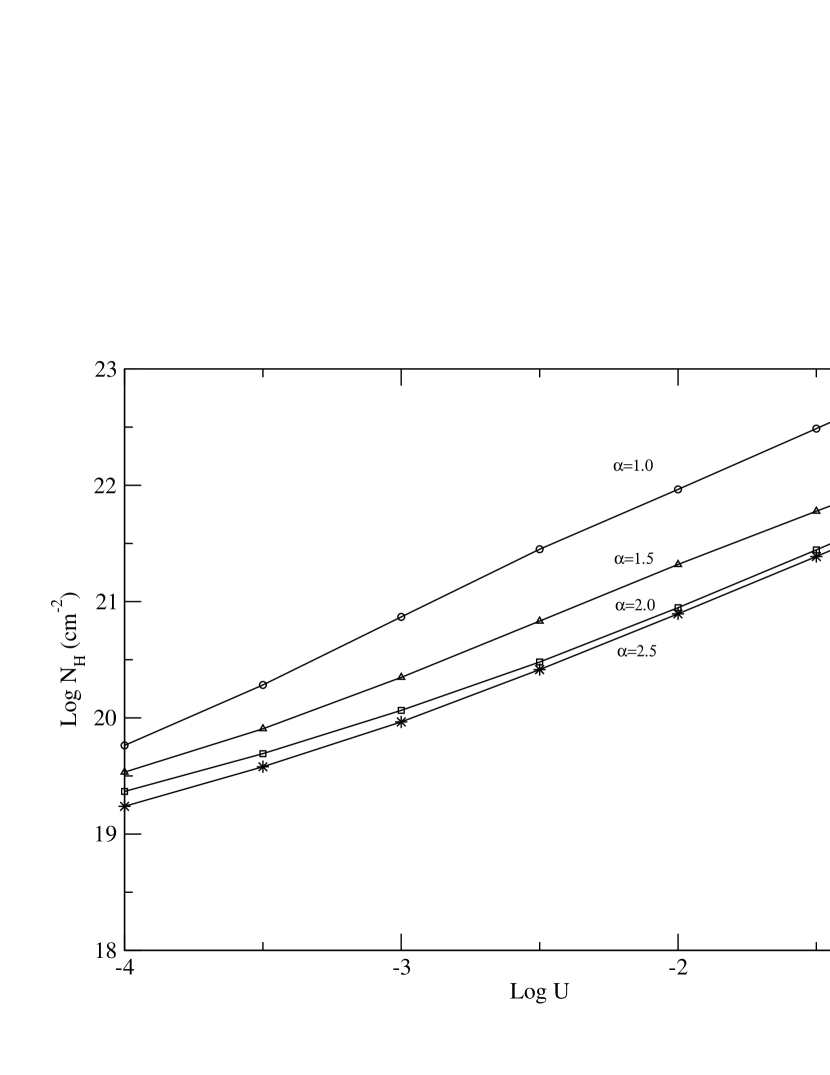
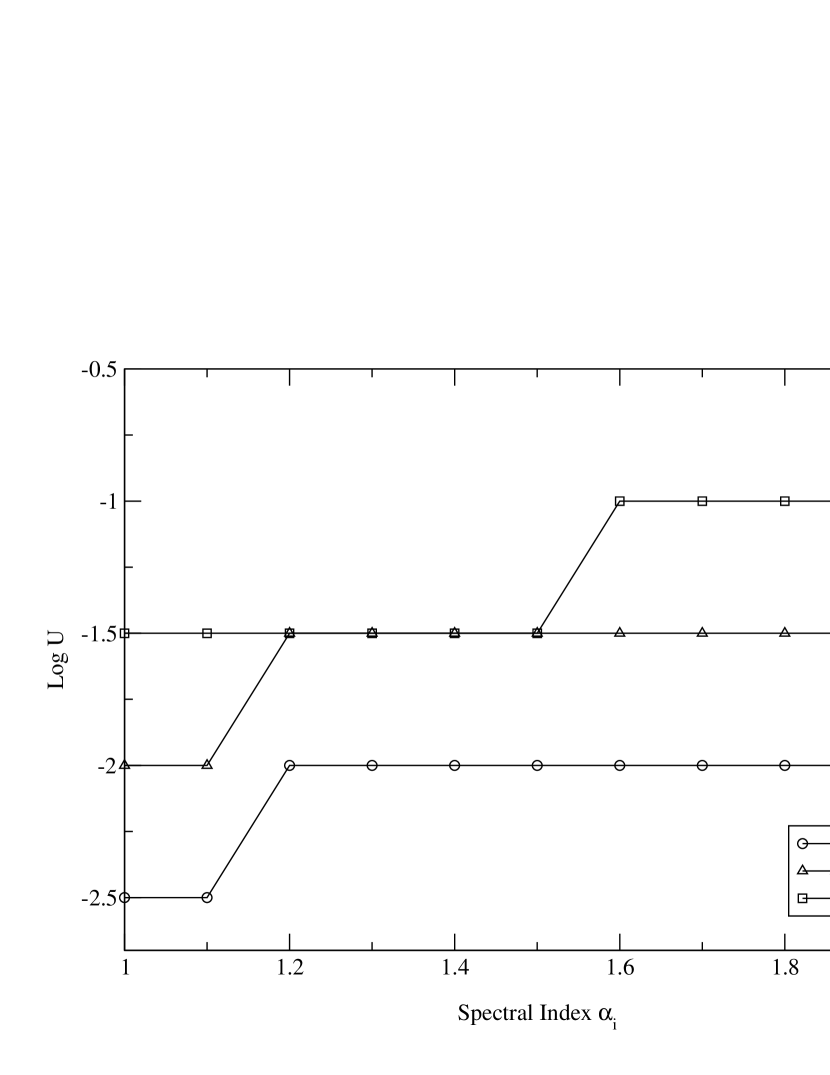
Following the results from the previous section, and in order to keep the number of free parameters to a minimum, we used the observed [Ne V] ratios to fix the hydrogen density in our photoionization models to . Next, in order to maximize each of the mid-infrared emission lines, we proceeded to find the range in ionization parameter where the predicted ionic column densities for the Ne III, Ne V and O IV peak (see Figure 3). Results show that the ionization parameter falls in the range for , while it is in a higher ionization range, , for . One must note that the peak of the ionic column density depends on the SED (see Figure 5). Also, because we are interested in the shape of the ionizing continuum, we expect to achieve the clearest constraints from radiation-bounded models 333Specifically, in a radiation-bounded model, all of the incident radiation has been absorbed inside the cloud, i.e., the cloud is optically thick to the ionizing radiation.. The set of radiation-bounded models was obtained by initially assuming a hydrogen column density of . In Figure 4 we compared the total Hydrogen density as a function of ionization parameter and UV slope for our radiation bounded, “power-law” models. It is clear that a column density of is enough to generate an optically thick, radiation-bounded cloud for the set of ionization parameters and hydrogen density derived from the previous considerations, except for where we had to extend the column density to . Using this set of ionization parameters, and , we compared our model predictions with the observed [Ne V]14.32µm/[Ne III], [Ne V]24.32µm/[O IV] and [O IV]/[Ne III] ratios from the BAT sample. Overall, these results suggest that the [O IV] and [Ne V] come from a higher ionization state and lower density regions than that suggested by the optical [O III] lines (Baskin & Laor, 2005; Meléndez et al., 2008a).
3.3 The Power-Law model
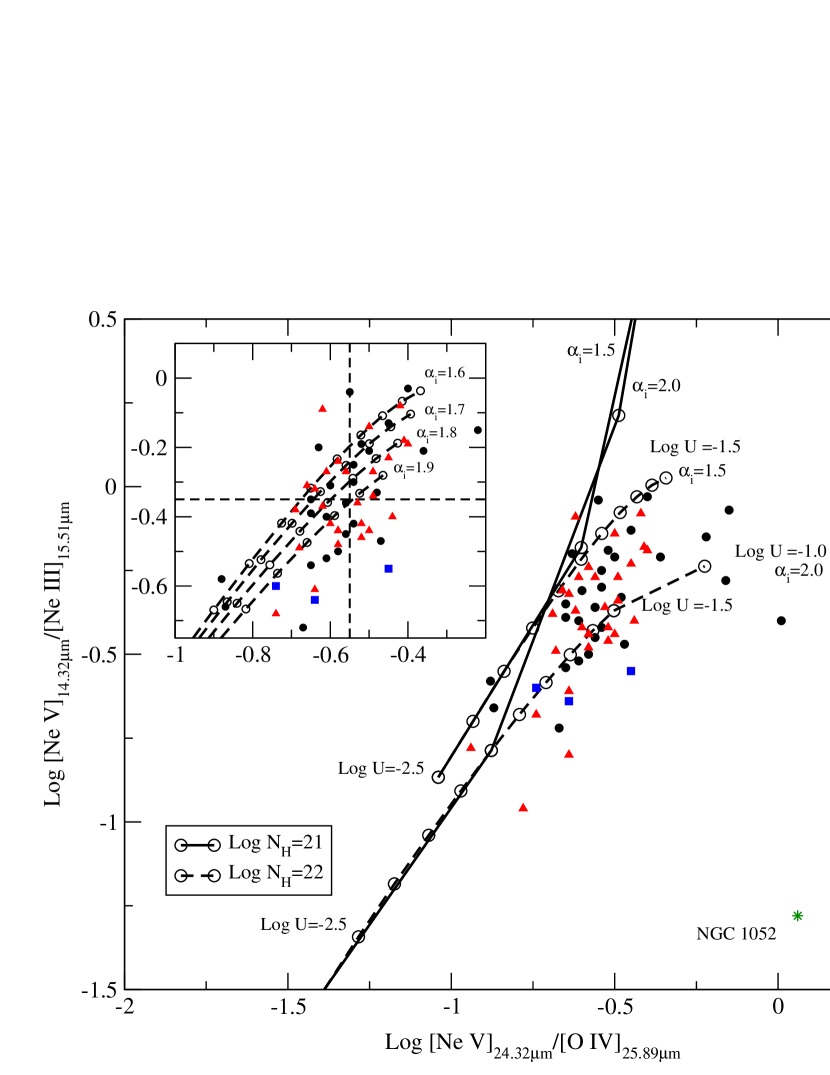
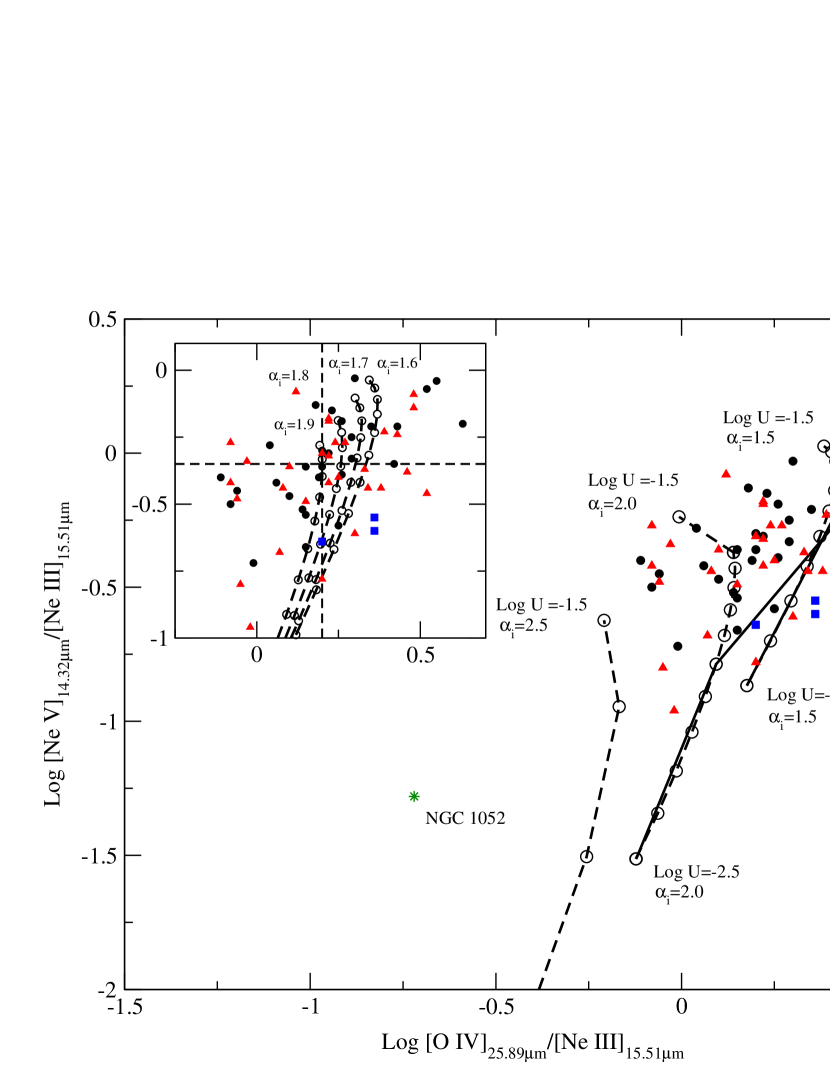
As we mentioned before, high-ionization mid-infrared ratios can be used to investigate different excitation mechanisms, thus different shapes of the ionizing continuum. They provide information about the relative flux density of ionizing photons with energies between 40–100 eV. In Figure 6 we compared the observed [Ne V]14.32µm/[Ne III] and [Ne V]24.32µm/[O IV] ratios found in the BAT sample (see Table LABEL:mean) against those predicted by our photoionization calculations. Because of the proximity of wavelengths and equal aperture extraction for the emission lines in each ratio444The [Ne V]14.32µm and [Ne III] fluxes were extracted from the Spitzer/IRS in the short-high order (SH, 4.7′′ 11.3′′). On the other hand, the [Ne V]24.32µm and [O IV] emission were extracted from the Spitzer/IRS in the long-high order (LH, 11.1′′ 22.3′′), this comparison is unaffected by dust extinction and aperture effects. Figure 6 shows two sets of “power-law” models, corresponding to and , for a range of the EUV/soft X-ray from . We show that, for a column density of , the cloud is optically thin to the ionizing radiation, as the models underpredict the amount of [Ne III] emission. Specifically, this result describes a matter-bounded component, in which some fraction of the ionizing radiation passes through the gas unabsorbed. Overall, a softer ionizing continuum will result in a lower [Ne V]/[Ne III] ratio, because there are fewer photons capable of ionizing Ne+3.
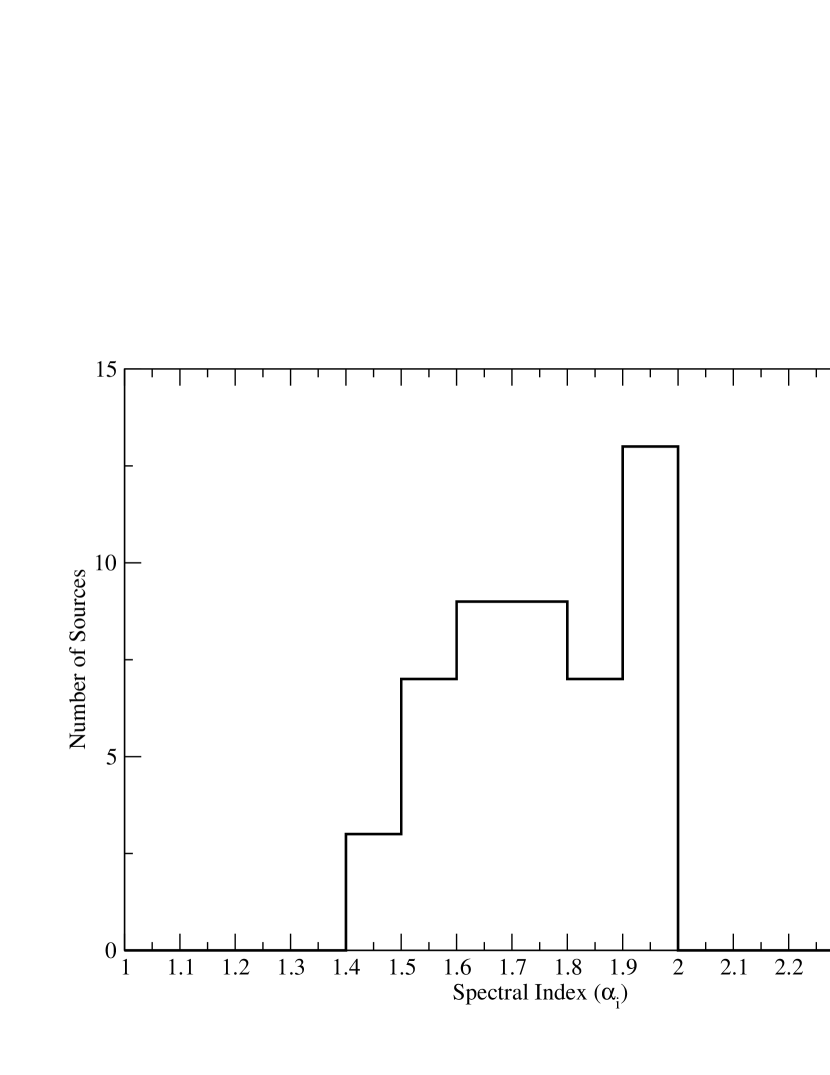
Figure 6 shows that, independent of the ionization parameter, most of the observed ratios are matched by models with EUV/Soft X-ray spectral indices of . Using the 95 confidence interval for the actual mean for the [Ne V]14.32µm/[Ne III] and [Ne V]24.32µm/[O IV] ratios observed in Seyfert 1 galaxies in our sample, we found a smaller range of spectral indices, i.e., , with providing the best fit for the median observed values. A histogram of the EUV/Soft X-ray spectral indices, derived empirically from the position of each source in Figure 6, is presented in Figure 7. From their analysis of Hubble Space Telescope (HST) Faint Object Spectrograph (FOS) observations of a sample of 101 quasars at z 0.33, Zheng et al. (1997) found that the power-law index in the EUV between 350 and 1050 Å is . They also found that, for a sub-sample of 60 radio-loud sources, the EUV spectral index is , while for a sub-sample of 41 radio-quiet it is . As shown in Figure 6, most of the BAT AGN can be fitted with an EUV/Soft X-ray spectral index of , consistent with the radio-quiet nature of most Seyfert galaxies.
From their analysis of HST spectra of a sample of 184 quasars at z 0.33, Telfer et al. (2002) found a slightly harder EUV continuum than Zheng et al. (1997). This sample included observations with the HST FOS, Goddard High Resolution Spectrograph and available Space Telescope Imaging Spectrograph (STIS) data. For their complete sample, they found a spectral index of between 500 and 1200 Å . For a subsample of radio-loud objects, they found , while for a radio-quiet subset, they found . These values are roughly consistent with our range of EUV/Soft X-ray indices and the spectral index associated with the median values for the Seyfert 1 galaxies found in our sample, . Again, this supports the idea that a single power-law can represent the EUV/soft X-ray continuum in our sample of BAT AGN. One must note that star formation contamination in the [Ne III] emission can bias the EUV/Soft X-ray slope towards a steeper power-law index. In other words, star formation contamination in the [Ne III] emission will result in a lower [Ne V]14.32µm/[Ne III] ratio, which could be wrongly associated with a softer EUV continuum. However, the tight correlation found in the [Ne III]–BAT relationship suggests that, on average, there is no strong enhancement due to star formation in the [Ne III] emission in our sample, although we cannot rule out relatively minor effects in individual objects. Despite the fact that our spectral index has been determined over a relatively small range of energy (40–100 eV), these results support the validity of our method, given the agreement with values derived from different spectral analyses, covering a wider range of energies.
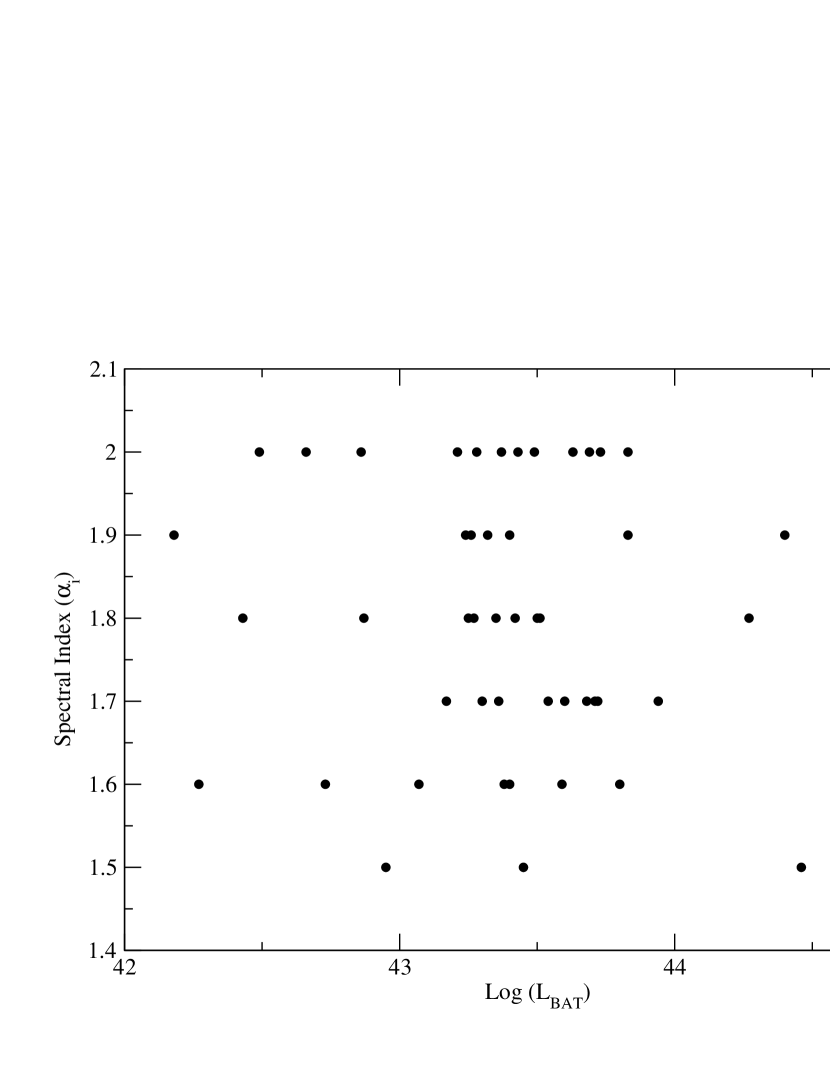
On the other hand, analysis of the Far Ultraviolet Spectroscopic Explorer (FUSE) archival data by Scott et al. (2004) revels a significantly harder composite spectral energy distribution, , than the spectral indices discussed above and no evidence of a UV spectral index break. One must note that, in their sample, some individual sources do show a spectral break in the far-ultraviolet ( 910–2000 Å). It should be noted that this is an heterogeneous sample of AGN, which were observed with FUSE because they were known to be bright in the UV. The authors reported a correlation between the spectral slope and AGN luminosity; in other words, low-luminosity AGN tend to show a harder ionizing continua. They suggested that the harder spectral index they derived is due to the relatively large fraction of low luminosity AGN in the FUSE sample555The median value for their FUSE sample is versus for the HST sample of active galaxies presented by Telfer et al. (2002). In contrast, we found no evidence of such flatter indices in our sample. Specifically, in Figure 8 we compare our derived values for the spectral index and the 14–195 keV luminosities, from which it can be seen that there is no dependence between the EUV/Soft X-ray slope and luminosity in the BAT sample. Furthermore, Shang et al. (2005) found that most objects in their FUSE sample exhibit a spectral break around Å , in agreement with previous HST results (Zheng et al., 1997; Telfer et al., 2002). Their analysis is based on a heterogeneous sample of 17 low-redshift AGN (z), with quasi-simultaneous spectrophotometry including FUSE, HST and Kitt Peak National Observatory observations covering a rest wavelength from Å. Given the fact that Scott et al. (2004) looked for possible systematic errors that could bias their results, the source of this discrepancy is unclear. While it is possible that the spectral break is luminosity dependent, another possible explanation is that intrinsic reddening, if not fully corrected for, may lead to an incorrect determination of the spectral break and continuum shape (Shang et al., 2005).
Figure 9 shows the predicted and observed [Ne V]14.32µm/[Ne III] and [O IV]/[Ne III] ratios. Contrary to the ratios presented in Figure 6, the [O IV]/[Ne III] ratio could be susceptible to reddening and aperture effects. In this regard, these effects will have different manifestations in the observed [O IV]/[Ne III] ratios. For example, the [O IV]/[Ne III] ratio will have larger values if extinction is stronger for the shorter-wavelength line. On the other hand, aperture effects will tend to decrease the observed ratio. As seen in Figure 9, when using the [O IV]/[Ne III] ratio, we recovered the same range for the EUV/soft X-ray slope as those derived from the [Ne V]14.32µm/[Ne III] and [Ne V]24.32µm/[O IV] ratios (see Figure 6). In other words, the [O IV]/[Ne III] ratios are fit by the range of spectral indices found from the other ratios, suggesting that reddening and aperture effects are not dominant (or, perhaps, cancel each other out) in the BAT sample of AGN, in agreement with the discussion presented in Weaver et al. (2010).
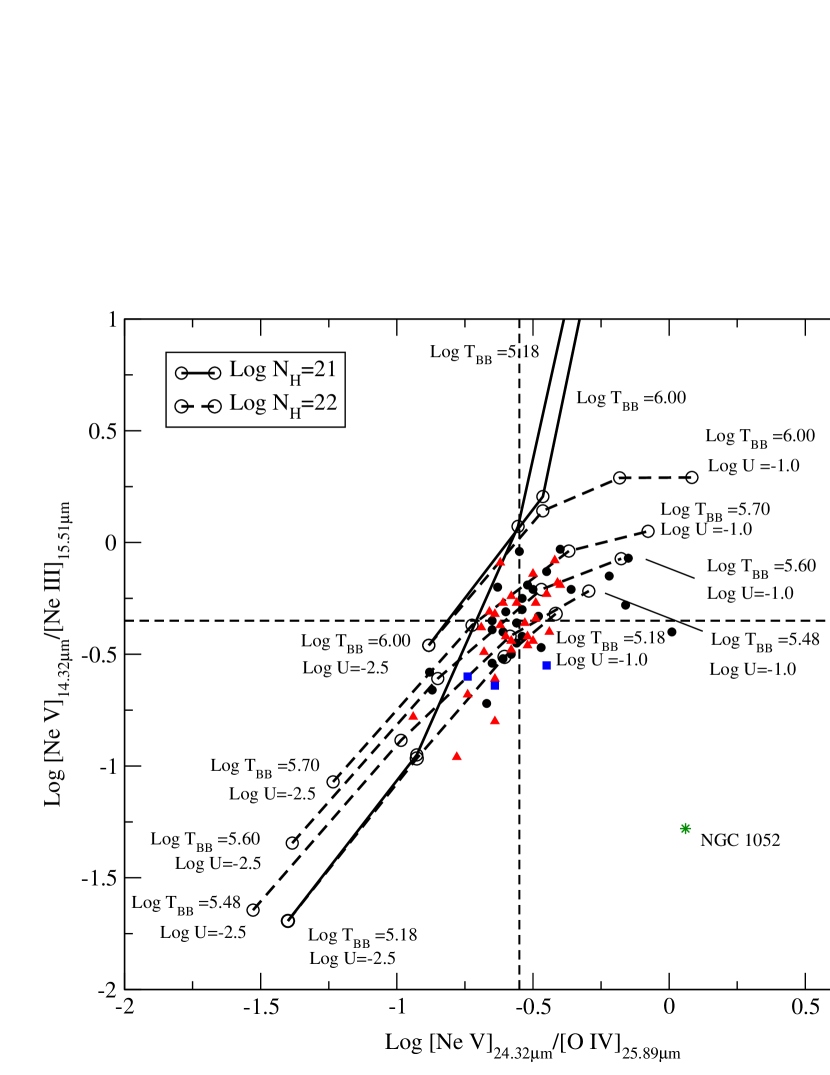
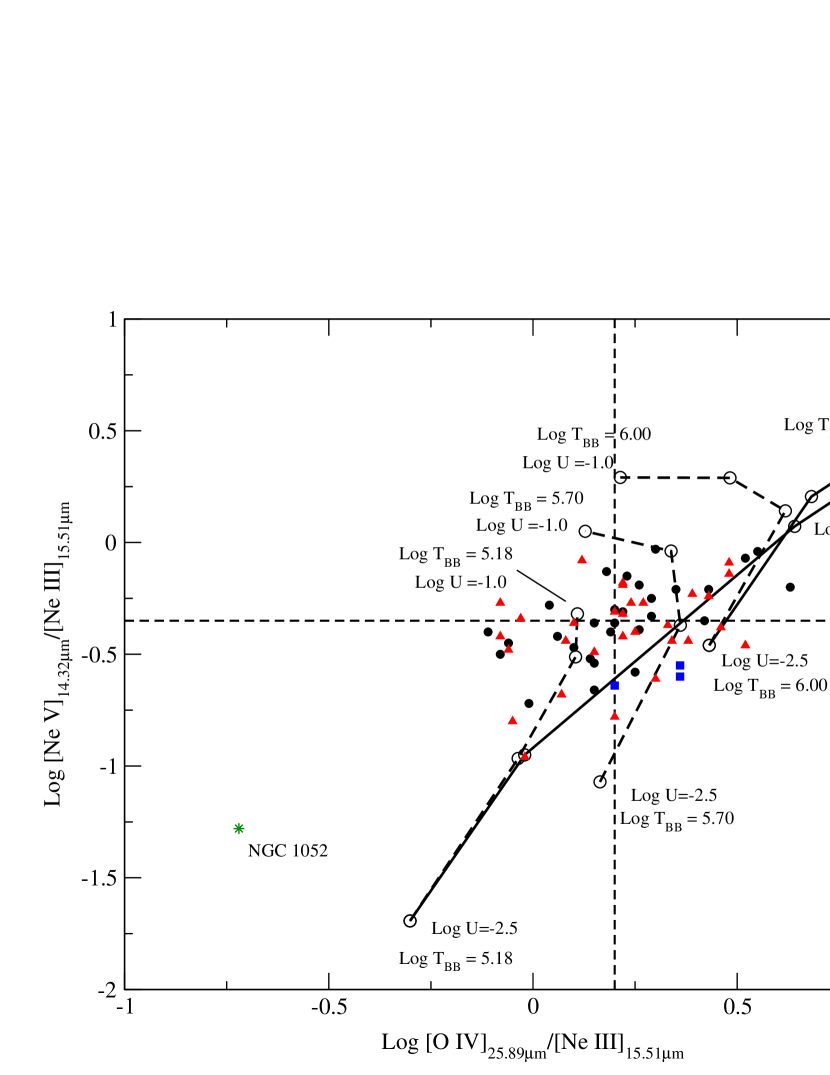
3.4 The AGN Parametrization
Figures 10–11 show predictions for the [Ne V]14.32µm/[Ne III], [Ne V]24.32µm/[O IV] and [O IV]/[Ne III] ratios from a set of models generated with the parametrization of the AGN continuum including a UV bump, with cutoff temperatures from K to K, and column densities of and . Once again, at the cloud is optically thin to the ionizing radiation, thus underpredicts the [Ne III] emission. It is clear that the AGN parametrization with a UV “bump” temperature higher than K fails to predict most of the observed ratios, even in our radiation-bounded models. We find that the emission-line ratios for a majority of sources can be fit by models with UV bump temperatures of K to K, or, alternatively, peaks at Å. The best fit for the 95 confidence interval for the actual mean occurs between Å. These results are in agreement with the FUV break observed in the composite spectra of AGN, in the range of 1000–1100 Å (e.g., Zheng et al., 1997; Telfer et al., 2002; Shang et al., 2005).
This range of temperature is slightly lower than the typical temperatures used to characterize an average quasars continuum when modeling the BLR (Korista et al., 1997). However, the chosen form for the parametrization of the AGN continuum presented in Korista et al. (1997) focused on luminous quasars while our sample is dominated by lower luminosity sources. If the ionizing continuum is from an accretion disk, one would expect more luminous objects to be hotter for the same black hole mass, and, therefore, the lower range of temperature found in our sample is not unexpected. However, these results may also argue in favor of a different, intrinsic SED photoionizing the BLR. This intrinsic SED may be characterize by a bbb with a higher “blue bump” temperature, e.g., K, than that found from our modeling of the NLR emission. In this interpretation, material located between the BLR and the NLR may absorb the intrinsic UV component. However, from our calculations, we do not find any clear evidence of a modification of the SED by an intervening medium.
4 Conclusions
In order to investigate the shape of the spectral energy distribution in the range 13.6 eV to 1 keV, we have generated photoionization models to characterize the small dispersion found in correlations between high-ionization mid-infrared emission-line ratios in AGN This is the band where dust extinction and the line of sight absorber can make it virtually impossible to have a direct view of the continuum generated by the nuclear engine. Our set of radiation bounded models show that a broken power-law continuum model is sufficient to reproduce the observed mid-infrared [Ne V]14.32µm/[Ne III], [Ne V]24.32µm/[O IV]25.89µm and [O IV]25.89µm/[Ne III] ratios. From this we constrained the EUV/Soft X-ray spectral index, , to be between 1.5 – 2.0, with corresponding to the median value observed in Seyfert 1 galaxies. Our result agrees with previous studies (e.g., Zheng et al., 1997; Telfer et al., 2002; Shang et al., 2005) and holds for the wide range of BAT luminosities and type I and II objects in the local universe, whereas previous studies of SED tend to focus on UV selected objects at a different redshift range. Despite the fact that our spectral index has been estimated for a relatively small range of energy (40–100 eV), these results probe the validity of our method to uncover the AGN continuum in this energy band. From the comparison between the photoionization models and observations we derived empirical values for the EUV/Soft X-ray slope for each source and found no dependence between the EUV/Soft X-ray slope and the 14–195 keV luminosity in our sample.
We also find that our power-law model can produce enough photons at energies 4 Ry to generate the amount of mid-infrared line emission observed in the BAT AGN sample. However, this result does not rule out the presence of a bbb. When we do add a “big bump” in the UV to an X-ray power-law, the majority of sources required “blue bump” temperatures of K to K, suggesting that the peak of this component lies in a wide range of energies that can extend from Å to Å. The best fit for the 95 confidence interval for the actual mean occurs between, – Å, in agreement with previous estimates of the spectral index break (e.g., Zheng et al., 1997; Telfer et al., 2002; Shang et al., 2005). This range in temperatures is lower than the typical UV bump peak assumed to characterize an average quasar continuum when modeling the BLR (Korista et al., 1997). However, if the ionizing continuum is from an accretion disk, one expects more luminous objects to be hotter for the same black hole mass. Therefore, the lower range of temperature found in our sample is not unexpected.
References
- Abel & Satyapal (2008) Abel, N. P., & Satyapal, S. 2008, ApJ, 678, 686
- Alexander et al. (2000) Alexander, T., Lutz, D., Sturm, E., Genzel, R., Sternberg, A., & Netzer, H. 2000, ApJ, 536, 710
- Alexander et al. (1999) Alexander, T., Sturm, E., Lutz, D., Sternberg, A., Netzer, H., & Genzel, R. 1999, ApJ, 512, 204
- Allende Prieto et al. (2001) Allende Prieto, C., Lambert, D. L., & Asplund, M. 2001, ApJ, 556, L63
- Antonucci (1993) Antonucci, R. 1993, ARA&A, 31, 473
- Baskin & Laor (2005) Baskin, A., & Laor, A. 2005, MNRAS, 358, 1043
- Bernard-Salas et al. (2009) Bernard-Salas, J., Spoon, H. W. W., Charmandaris, V., Lebouteiller, V., Farrah, D., Devost, D., Brandl, B. R., Wu, Y., Armus, L., Hao, L., Sloan, G. C., Weedman, D., & Houck, J. R. 2009, ApJS, 184, 230
- Diamond-Stanic et al. (2009) Diamond-Stanic, A. M., Rieke, G. H., & Rigby, J. R. 2009, ApJ, 698, 623
- Dudik et al. (2009) Dudik, R. P., Satyapal, S., & Marcu, D. 2009, ApJ, 691, 1501
- Dudik et al. (2007) Dudik, R. P., Weingartner, J. C., Satyapal, S., Fischer, J., Dudley, C. C., & O’Halloran, B. 2007, ApJ, 664, 71
- Ferland et al. (1998) Ferland, G. J., Korista, K. T., Verner, D. A., Ferguson, J. W., Kingdon, J. B., & Verner, E. M. 1998, PASP, 110, 761
- Francis et al. (1993) Francis, P. J., Hooper, E. J., & Impey, C. D. 1993, AJ, 106, 417
- Gorjian et al. (2007) Gorjian, V., Cleary, K., Werner, M. W., & Lawrence, C. R. 2007, ApJ, 655, L73
- Goulding & Alexander (2009) Goulding, A. D., & Alexander, D. M. 2009, MNRAS, 398, 1165
- Holweger (2001) Holweger, H. 2001, in American Institute of Physics Conference Series, Vol. 598, Joint SOHO/ACE workshop ”Solar and Galactic Composition”, ed. R. F. Wimmer-Schweingruber, 23–30
- Korista et al. (1997) Korista, K., Baldwin, J., Ferland, G., & Verner, D. 1997, ApJS, 108, 401
- Kraemer et al. (1998) Kraemer, S. B., Crenshaw, D. M., Filippenko, A. V., & Peterson, B. M. 1998, ApJ, 499, 719
- Kraemer et al. (2000) Kraemer, S. B., Crenshaw, D. M., Hutchings, J. B., Gull, T. R., Kaiser, M. E., Nelson, C. H., & Weistrop, D. 2000, ApJ, 531, 278
- Kraemer & Harrington (1986) Kraemer, S. B., & Harrington, J. P. 1986, ApJ, 307, 478
- Kraemer et al. (2010) Kraemer, S. B., Schmitt, H. R., Crenshaw, D. M., Melendez, M., Turner, T. J., Guainazzi., M., & Mushotzky, R. F. 2010, ArXiv e-prints
- Kraemer et al. (2011) Kraemer, S. B., Schmitt, H. R., Crenshaw, D. M., Meléndez, M., Turner, T. J., Guainazzi, M., & Mushotzky, R. F. 2011, ApJ, 727, 130
- Li & Draine (2001) Li, A., & Draine, B. T. 2001, ApJ, 554, 778
- Lusso et al. (2010) Lusso, E., Comastri, A., Vignali, C., Zamorani, G., Brusa, M., Gilli, R., Iwasawa, K., Salvato, M., Civano, F., Elvis, M., Merloni, A., Bongiorno, A., Trump, J. R., Koekemoer, A. M., Schinnerer, E., Le Floc’h, E., Cappelluti, N., Jahnke, K., Sargent, M., Silverman, J., Mainieri, V., Fiore, F., Bolzonella, M., Le Fèvre, O., Garilli, B., Iovino, A., Kneib, J. P., Lamareille, F., Lilly, S., Mignoli, M., Scodeggio, M., & Vergani, D. 2010, A&A, 512, A34+
- Malkan & Sargent (1982) Malkan, M. A., & Sargent, W. L. W. 1982, ApJ, 254, 22
- Mathews & Ferland (1987) Mathews, W. G., & Ferland, G. J. 1987, ApJ, 323, 456
- Meléndez et al. (2008a) Meléndez, M., Kraemer, S. B., Armentrout, B. K., Deo, R. P., Crenshaw, D. M., Schmitt, H. R., Mushotzky, R. F., Tueller, J., Markwardt, C. B., & Winter, L. 2008a, ApJ, 682, 94
- Meléndez et al. (2008b) Meléndez, M., Kraemer, S. B., Schmitt, H. R., Crenshaw, D. M., Deo, R. P., Mushotzky, R. F., & Bruhweiler, F. C. 2008b, ApJ, 689, 95
- Mulchaey et al. (1994) Mulchaey, J. S., Koratkar, A., Ward, M. J., Wilson, A. S., Whittle, M., Antonucci, R. R. J., Kinney, A. L., & Hurt, T. 1994, ApJ, 436, 586
- Netzer & Laor (1993) Netzer, H., & Laor, A. 1993, ApJ, 404, L51
- Osterbrock & Ferland (2006) Osterbrock, D. E., & Ferland, G. J. 2006, Astrophysics of gaseous nebulae and active galactic nuclei, ed. Osterbrock, D. E. & Ferland, G. J.
- Pereira-Santaella et al. (2010) Pereira-Santaella, M., Diamond-Stanic, A. M., Alonso-Herrero, A., & Rieke, G. H. 2010, ApJ, 725, 2270
- Peterson et al. (2004) Peterson, B. M., Ferrarese, L., Gilbert, K. M., Kaspi, S., Malkan, M. A., Maoz, D., Merritt, D., Netzer, H., Onken, C. A., Pogge, R. W., Vestergaard, M., & Wandel, A. 2004, ApJ, 613, 682
- Rigby et al. (2009) Rigby, J. R., Diamond-Stanic, A. M., & Aniano, G. 2009, ApJ, 700, 1878
- Satyapal et al. (2007) Satyapal, S., Vega, D., Heckman, T., O’Halloran, B., & Dudik, R. 2007, ApJ, 663, L9
- Scott et al. (2004) Scott, J. E., Kriss, G. A., Brotherton, M., Green, R. F., Hutchings, J., Shull, J. M., & Zheng, W. 2004, ApJ, 615, 135
- Shang et al. (2005) Shang, Z., Brotherton, M. S., Green, R. F., Kriss, G. A., Scott, J., Quijano, J. K., Blaes, O., Hubeny, I., Hutchings, J., Kaiser, M. E., Koratkar, A., Oegerle, W., & Zheng, W. 2005, ApJ, 619, 41
- Shields (1978) Shields, G. A. 1978, Nature, 272, 706
- Tananbaum et al. (1979) Tananbaum, H., Avni, Y., Branduardi, G., Elvis, M., Fabbiano, G., Feigelson, E., Giacconi, R., Henry, J. P., Pye, J. P., Soltan, A., & Zamorani, G. 1979, ApJ, 234, L9
- Telfer et al. (2002) Telfer, R. C., Zheng, W., Kriss, G. A., & Davidsen, A. F. 2002, ApJ, 565, 773
- Tommasin et al. (2010) Tommasin, S., Spinoglio, L., Malkan, M. A., & Fazio, G. 2010, ApJ, 709, 1257
- Weaver et al. (2010) Weaver, K. A., Meléndez, M., Mushotzky, R. F., Kraemer, S., Engle, K., Malumuth, E., Tueller, J., Markwardt, C., Berghea, C. T., Dudik, R. P., Winter, L. M., & Armus, L. 2010, ApJ, 716, 1151
- Weingartner & Draine (2001) Weingartner, J. C., & Draine, B. T. 2001, ApJ, 548, 296
- Zamorani et al. (1981) Zamorani, G., Henry, J. P., Maccacaro, T., Tananbaum, H., Soltan, A., Avni, Y., Liebert, J., Stocke, J., Strittmatter, P. A., Weymann, R. J., Smith, M. G., & Condon, J. J. 1981, ApJ, 245, 357
- Zheng et al. (1997) Zheng, W., Kriss, G. A., Telfer, R. C., Grimes, J. P., & Davidsen, A. F. 1997, ApJ, 475, 469
| Seyfert 1 | Seyfert 2 | ||||||
|---|---|---|---|---|---|---|---|
| Measurements | Standard | Measurements | Standard | ||||
| Available | Mean | Deviation | Available | Mean | Deviation | (%) | |
| 29 | 0.95 | 0.28 | 30 | 1.00 | 0.38 | 87.8 | |
| 32 | 0.47 | 0.22 | 33 | 0.41 | 0.20 | 79.8 | |
| 31 | 0.34 | 0.19 | 30 | 0.28 | 0.06 | 57.0 | |
| 38 | 1.58 | 0.87 | 33 | 1.65 | 0.77 | 91.4 | |
Note. — The last column, , represents the Kolmogorov-Smirnov (K-S) test null probability. Upper limits for the [Ne V] fluxes are not included. This table also includes information about the numbers of Seyfert 1 and Seyfert 2 galaxies, mean values and standard deviations of the mean for the measured quantities. For the ratios the 95 confidence interval for the actual mean is 0.3904 – 0.5465 for Seyfert 1 galaxies, and 0.3417 thru 0.4831 for Seyfert 2’s. For the ratios the 95 confidence interval for the actual mean is 0.2717 thru 0.4089 for Seyfert 1 galaxies and 0.2469 thru 0.2964 for Seyfert 2’s. Finally, for the ratios the 95 confidence interval for the actual mean is 1.295 thru 1.867 for Seyfert 1 galaxies, and 1.375 thru 1.924 or Seyfert 2’s.