The central point source in G76.9+1.0
Abstract
We describe the serendipitous discovery of a radio point source in a 618 MHz image of the supernova remnant(SNR) G76.9+1.0. The SNR has a bipolar structure and the point source is located near a faint bridge of emission joining the two lobes of emission. The point source was also detected in follow-up higher frequency (1170 MHz) observations. The spectral index for the point source obtained from the GMRT observations is = -2.1. The steep spectrum, as well as the location of the point source near the centre of the SNR establish the fact that it is indeed the pulsar J2022+3842 associated with this SNR. The weighted-mean radio position of this point source is . Consistent with this, subsequent analysis of archival Chandra X-ray data shows a point source coincident with the radio point source, as well as diffuse extended X-ray emission surrounding the unresolved source. However, no pulsed emission was detected despite deep searches at both 610 MHz and 1160 MHz although pulsed emission has been seen at 2 GHz with the GBT. It appears that the most likely reason for not detecting the pulsed signal at the GMRT is temporal broadening: for the estimated DM towards this SNR, the pulse broadening time could be as large as tens of milliseconds. The diffuse X-ray emission is elongated along the same direction as the bipolar structure seen in the radio. We interpret the radio lobes as having been formed from an equatorial wind. Although direct detection of pulsed signal has not been possible, we show convincingly that sensitive, high-resolution, radio imaging at multiple frequencies is a useful method to search for pulsar candidates.
keywords:
ISM: supernova remnants, supernovae: individual, stars: neutron, pulsars: general, pulsars: individual, radiation mechanisms: general1 introduction
The source G76.9+1.0 was first identified by Wendker, Higgs & Landecker (1991) in a DRAO survey of the Cygnus-X region. Those authors tentatively identified it as a Galactic supernova remnant but, because of the limited resolution of their survey, were unable to come to a firm conclusion. From follow-up VLA multi-frequency observations Landecker, Higgs & Wendker (1993) showed it to have a two-lobed structure, with the lobes themselves joined by a bridge of emission, i.e. morphologically very similar to the pulsar wind nebula (PWNe) DA495 (see e.g. Kothes et al. (2008) for a detailed discussion on DA495). From the observed rotation measure Landecker et al. (1993) conclude that it is further than 7 kpc. The spectral index they measured for the source was (where ). This is somewhat steep for a filled-center remnant. Nonetheless, based on its morphological similarity to DA495, both Landecker et al. (1993) and Kothes et al. (2006) suggest that G76.9+1.0 is also a PWNe. For G76.9+1.0 the integrated flux density at the lowest available frequency (327 MHz) is substantially discrepant: Landecker et al. (1993) suggest that this might be because extended emission was resolved out in the 327 MHz image. Here we present a GMRT 618 MHz image of this source. This image was obtained as part of a test observation whose original aim was to test a scheme for online system temperature correction of the visibility data. The target was selected from Green (2009a, b) for two reasons: (i) it is located in the Galactic plane, where it would be useful to test our experimental scheme, and (ii) the GMRT, being sensitive to both large- and small-scale emission, could settle questions on its unclear morphological type. The GMRT has a hybrid configuration which allows imaging of both the smooth extended emission as well as of fine scale structure with data taken in a single observing run. The observations and results presented in this paper however provide strong support for the interpretation that G76.9+1.0 is a pulsar wind nebula (PWNe).
The rest of this paper is organised as follows: in Section 2, we describe our 610 MHz GMRT observations and results, which led to the serendipitous detection of the radio point source. In Section 3 we describe a susequent search for pulsed emission at 610 MHz, unaware that a search had already been carried out (Arzoumanian et al., 2010). Since no pulsed emission was detected, we followed up the 610 MHz observations with 1170 MHz observations, with the aim of both mapping the point source as well as searching for pulsed emission; the reasons behind this renewed search, the details and results are described in Section 4. In order to better understand the source, we also analysed archival Chandra data for this region. We present in Section 5 the analysis and modelling of Chandra X-ray data. A discussion of the results can be found in Section 6.
2 GMRT 610 MHz Observations
2.1 Observing and analysis details
The supernova remnant G76.9+1.0 was observed on 24 Jun 2009 using the GMRT hardware correlator. Flux and band pass calibration were based on scans of the standard calibrators 3C286, 3C48 and 3C147; the VLA calibrator 2052+365 was used for phase calibration. Although the GMRT correlator produces 128 spectral channels across each of two 16-MHz wide sidebands, only the upper sideband data were used for analysis because of problems with the data in the lower sideband. The centre frequency of the resulting image is hence 618 MHz. Throughout the observation, the Automatic Level Control (ALC) was kept switched off. Data reduction was done using AIPS. Bad data were flagged, data calibrated on a single channel and solutions applied to all channels by bandpass calibration. The strong source 4C39.61 at the edge of the field of view was first imaged and subtracted out. The rest of the field was then imaged (and self-calibrated) using 37 facets.
2.2 Results
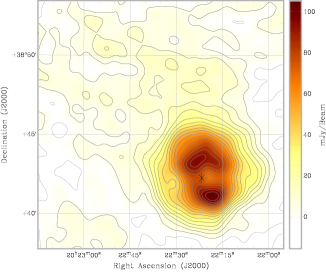
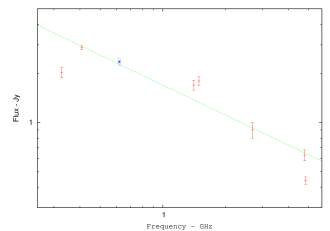
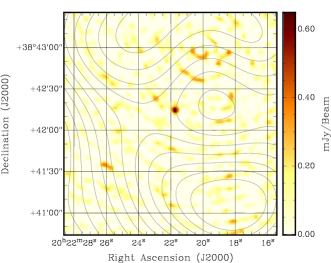
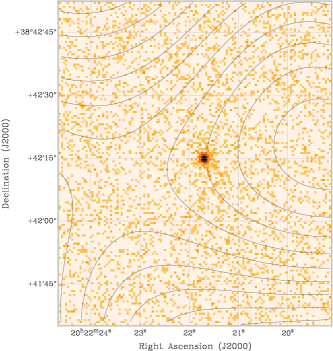
The low resolution 618 MHz continuum map is shown in Fig. 1. The GMRT has a hybrid configuration (Swarup et al., 1991) with roughly half the antennas in a central region approximately km2 across. The remaining antennas are spread along three -km long arms, giving a maximum baseline length km. This image is made using essentially only the data from antennas in the central square of the GMRT (i.e. using a Gaussian UV taper with the 30 level at 2.5 k) and has a resolution of . The morphology matches well with the double lobed structure joined by a diffuse bridge of emission noted in earlier studies (Landecker et al., 1993; Kothes et al., 2006). The total integrated flux density from the remnant, uncorrected for foreground contribution or absorption, is 2.36 Jy 0.28 Jy. The RMS noise on the integrated flux is 45 mJy; however we have folded in a 10% error(0.236 Jy) to account for possible systematics(for this observing mode with the GMRT, from similar observations in the past) in the calibration. The GMRT 618-MHz flux measurement is plotted along with other previous measurements (from Landecker et al. 1993) in Fig. 2. The earlier spectral index measurement obtained by Landecker et al. (1993) excluded certain measurements. Their reasons included possible under-representation of large-scale emission due to poor uv-coverage in the measurements they excluded for spectral fitting. Including the new GMRT flux measurement, but following Landecker et al. (1993) in excluding the discrepant measurements at 327 MHz, 1408 MHz, 1490 MHz and 4850 MHz, the spectral index we measure is in excellent agreement with the earlier measurement of . We used the same 618 MHz data to search for compact sources by making an image after excluding all baselines shorter than 10k. A point source with a peak flux density of 680 Jy 58 Jy at near the bridge of emission joining the two lobes is clearly detected. This is shown in Fig. 3, with the 618-MHz contours of Fig. 1 overlaid. Its location makes it a very promising candidate for the central pulsar associated with this PWNe. The error on the position is half of the synthesised beam - in this case . The error on the position as returned by a gaussian fit to the synthesised beam is minuscule, and as such makes little sense as the positional uncertainty due to systematics is of the order of the synthesised beam itself.
3 The search for a pulsar at 610 MHz
Subsequent to the discovery of the point source in the 610-MHz map, and, as of yet unaware of the detection of pulsar J2022+3842, we decided to search for pulsed emission from the same object. A pulsar search observation using the pulsar backend of the GMRT was carried out on 3 March 2010, with 13 antennas of the GMRT central square phased towards the unresolved source discussed in Sec. 2.2. The total integration on the source was about 6 hours, with interspersed phasing scans of 5 minutes once every 45 minutes to an hour. The data were recorded with 256 channels for each of the two sidebands. In the image made from the simultaneously recorded inteferometric data (i.e. using the GMRT hardware correlator and all available antennas) the point source was clearly detected. The flux density measured at this epoch was 660 Jy 80 Jy, consistent with the earlier measurement. For the assumed distance of 7 kpc the range of DMs given by the Galactic Free Electron Density Model (Cordes & Lazio, 2003) is . Since the true DM could differ from this estimate by as much as a factor of 2, a search was made over a DM range in steps of . The pulsar search pipeline at the GMRT uses a customised set of programs from both SIGPROC and PRESTO (Ransom, 2001). The bad channels and sections of the pulsar search data corresponding to the phasing scans were blanked out by applying suitable time- and frequency-masks using the program rfifind. Subsequently the data were dedispersed using prespsubband through the DM range mentioned above. The dedispersed data were Fourier-transformed using optimised FFT routines. Finally an acceleration search using the program accelsearch (Ransom, Eikenberry & Middleditch, 2002) was done to search for candidates. The limit of detectability attained as per calculations was 100 Jy per sideband. Although the phase-averaged flux density of the unresolved source is significantly higher than the detectable limit, no pulsed emission was detected.
4 GMRT L-band observations
The lack of pulsation was puzzling, since the location of this source made it highly likely to be the central pulsar in this supernova remnant. The fact that radio continuum emission was detected, also ensures that this putative pulsar is beamed towards us. Possible causes for this include (i) the rotation and magnetic axes of the pulsar are aligned, (ii) the pulse is significantly broadened at low frequencies, and (iii) the pulse period is near 20 ms where there is signficiant powerline-generated RFI. Since the second of these seems apriori the most likely, a follow-up higher frequency GMRT pulsar search was made at 1170 MHz.
4.1 Observing and analysis details
G76.9+1.0 was observed at 1170 MHz with the GMRT on 16 June 2010. Data were recorded simultaneously in the interferometric and phased array modes. All the available antennas were used to obtain visibilities in the interferometric mode, whereas only the central square and the first arm antennas were added in phase to obtain the pulsar search data. The visibilities as well as the pulsar search data were recorded separately as 256-channel, 33-MHz baseband data with the GMRT Software Backend (GSB; Roy et al. 2010). 3C147 and 3C286 were used as primary calibrators for interferometric observations. 2052+365 was observed every 45 minutes for interferometric observations to enable phase calibration and interpolation, which simultaneously also served as phasing scans for the pulsar search observation. The data reduction and analysis were very similar to that of the earlier 610-MHz observations. Regrettably, the upper half of the 33-MHz bandwidth was not usable due to the presence of intermittent RFI. Therefore, the centre frequency of the resulting image is MHz.
4.2 Results
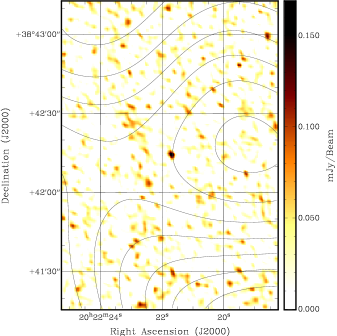
G76.9+1.0 is in size, and much of its flux is expected to be resolved out at the GMRT at 1160 MHz. Hence no attempt was made to measure its total flux at 1160 MHz. The full resolution image (Fig. 4) however shows a clear detection of the point source seen earlier at 618 MHz. The position measured from the 1160-MHz data () is in excellent agreement with that measured at 618 MHz. Here again, the positional uncertainty is . The measured flux density at 1160 MHz is 171 Jy 22 Jy, giving a spectral index of = -2.1. To cross-check the calibration, we re-reduced archival 1465-MHz VLA data for this field. A comparison of the flux densities measured by the VLA and the GMRT for the four brightest sources is shown in Table 1. As can be seen, they are in good agreement.
The pulsar search attained a detectability limit of 100 Jy, similar to the 610-MHz figure. Given that the time-averaged flux density of the source at this same epoch is Jy, one would have expected the pulsed emission to have been easily detected. However, no pulsed emission was detected despite searching through a DM range of (using the same procedure as used earlier at 610 MHz). We discuss this further in Sec. 6.1.
Given the lack of detection of pulsed emission, it is difficult to assert with certainty that the point source that we see is indeed the central pulsar in this SNR. X-ray observations could however provide support to this interpretation. A search of the Chandra archival data revealed that this source had indeed been observed and that data was available in the public domain. We discuss next archival Chandra X-ray data for this source.
| RA,Dec | GMRT | VLA |
| (J2000) | 1160 MHz | 1465 MHz |
| 3833′59″ | 2.00.05 mJy | 4.980.91 mJy |
| 38°38′23″ | 6.10.05 mJy | 5.260.57 mJy |
| 38°42′27″ | 5.170.05 mJy | 6.30.6 mJy |
| 38°47′18″ | 2.22 0.06 mJy | 1.7 0.5 mJy |
5 Chandra X-ray data and analysis
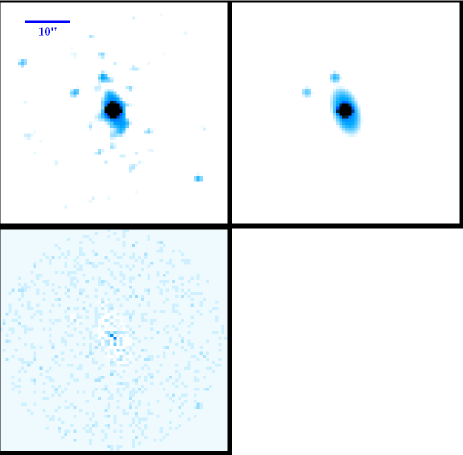
ACIS-S detector data from the 01 Aug 2005 Chandra observation of G79.6+1.0 (exposure time ) was downloaded from the archive. The unprocessed Chandra X-ray image in the band is shown in Fig. 5. An unresolved source is detected at , establishing unambiguously that the radio counterparts at 618 MHz and 1160 MHz are the same object. The overall 90% uncertainty circle of Chandra X-ray absolute position has a radius of . We reprocessed the Level-1 event files from the observation using the latest version of the Chandra Interactive Analysis of Observations software (CIAO 4.2) and calibration database (CALDB 4.2), and filtered them using the good time interval files to obtain the Level-2 event files. We extracted the ACIS-S image in the band and smoothed by convolving with a Gaussian of FWHM. The smoothed image is shown in Fig. 6. A point source coincident with the unresolved radio source is seen. In addition, the ACIS-S image also showed weak extended emission around the point source.
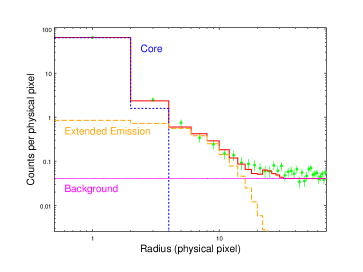
The extended emission can be identified as a synchrotron nebula around the neutron star. In order to find the relative contribution of the unresolved X-ray source and the surrounding nebula, we carried out spatial modeling of the observed ACIS-S image using CIAO’s modeling and fitting package, Sherpa 4.2. We modelled the unresolved core as a narrow, two-dimensional Gaussian and the nebula with a broad, two-dimensional Gaussian. We also used a constant component to account for the background. Additionally, we used two narrow Gaussians to account for two nearby point sources seen in Fig. 6. We carried out the fitting using the C-statistics appropriate for low-count data. The best-fitting model resulted in a strong unresolved core and an elongated extended emission with ellipticity of and the ellipticity angle ; all errors are . The best-fitting model image (top right panel) and the residual image (bottom left panel) are also shown in Fig. 6. The extended emission contributes only to the total X-ray emission from G79.6+1.0 in the band. We have also plotted the radial profiles of the central core and the extended emission in Fig. 7. Clearly, the X-ray nebula extends upto , while the core is confined to within .
The source spectrum was extracted from the Level-2 events using a circular region of radius 20 pixels = . We also extracted a background spectrum from four circles of radii in the nearby source-free regions. Instrumental responses were generated (the redistribution matrix and the ancillary response files) using the tasks mkacisrmf and mkarf. The spectral data were grouped to a minimum counts of 20 per bin and spectral analysis performed with the XSPEC (version 12.6) package, using the statistics. The source spectral extraction region includes both the unresolved core and the extended synchrotron nebula. For an energetic pulsar like G76.9+1.0 with extedned emission, X-ray emission should be dominated by magnetospheric emission. Therefore, we used a simple power-law model, modified by the Galactic absorption, to describe the X-ray emission from G79.6+1.0. The best-fitting model resulted in the absorption column and power-law photon index with minimum for 61 degrees of freedom. Here the errors are quoted at the confidence level. The unfolded Chandra spectrum, the best fit spectral model and the deviations of the observed data from the model are shown in Fig. 8. The observed flux is and the corresponding unabsorbed flux is . Addition of a blackbody component does not improve the fit ( for two additional parameters). Similarly, an additional power-law component is not required by the data.
6 The nature of the central point source
One can compute the approximate age of the remnant and therefore of the neutron star. We invoke equipartition between the magnetic field and the particles to obtain the equipartition pressure. An unbroken power-law with in the range 10 MHz-10 GHz gives a radio synchrotron luminosity of . The pressure obtained from the equipartition magnetic field - - is P . The mean expansion velocity, , gives an estimate of the age of the neutron star as , where is the particle number density. For a mean particle density of , the approximate age of the remnant is 5 kyr.
6.1 Non-detectability of the radio pulsar
The location, steep radio spectrum as well as the X-ray counterpart of the the point source make a strong case for assuming that it arises from the central pulsar associated with this SNR. The lack of detection of pulsed emission is however puzzling. Lorimer, Lyne & Camilo (1998) had also failed to detect pulsed emission from G76.9+1.0, however their limits are substantially weaker than those presented here. In Sec. 4 we had advanced three possibilities for the lack of pulsed emission. Out of the three, the most likely cause for the lack of pulsed emission appears to be temporal broadening. The expected temporal broadening using equation (7) from Bhat et al. (2004) is
| (1) |
where and = 3.86. Here, the temporal broadening is in ms and observing frequency is in GHz. For the DM range of the expected pulse broadening at 618 MHz and 1170 MHz are ms and ms respectively. Clearly if the DM lies in the upper end of the likely range and the pulsar has a period in the ms range, the pulse broadening will be comparable to the pulse period, making it very difficult to detect the pulsar. We note in this context that during the pulsar search candidates were identified by summing up to 16 harmonics, and hence even if only the fundamental alone was statistically significant the pulsar should have shown up as a candidate in our search. Accounting temporal broadening alone as being responsible for non-detection of the pulse, we considered sensitive higher frequency follow-up observations, perhaps with the GBT. However, going through the GBT data archives we learnt that this object had already been observed and a pulsar has been detected. The period of the pulsar(J2022+3842) is ms, and the DM is (Z. Arzoumanian and S. M. Ransom, private communication), consistent with our non-detections at lower frequencies. Their 2-GHz flux of Jy agrees well with the spectral index measured with the GMRT. This establishes beyond any ambiguity that the pulsar non-detections at the GMRT were not sensitivity-limited, but because of the large DM and the lower observing frequencies, the pulsed signal would be appreciably broadened. It seems a reasonable conclusion, therefore, that the radio emission seen in the GMRT images as the unresolved source comes from the pulsar, but that only because of temporal broadening we do not detect any pulsed emission. We turn now to the discussion of the diffuse emission seen in the X-ray image.

6.2 The geometry of the wind nebula
The X-ray image in Fig. 6 shows diffuse emission, whose major axis is approximately aligned to the bipolar structure seen in the radio images. No radio counterpart to this diffuse X-ray emission is obvious in our data: this may partly be due to the difficulties in disentangling it from the more extended emission in the SNR.
The pulsar is located at the center of the diffuse X-ray emission, but offset from the central depression in the radio image. In the case of the PWNe DA495 there is a similar offset between the location of the pulsar and the central depression in the bipolar emission, although the alignment with the diffuse X-ray emission is not clear (Kothes et al., 2008; Arzoumanian et al., 2008). Kothes et al. (2008) interpret the maxima in the radio bipolar structure as lying along the rotation axis. They also suggest that the minima in the radio image correspond to dense gas emitted earlier by an equatorial wind of the parent star. Since synchrotron particles cannot penetrate this dense material this leads to a minimum in the radio emission. Guided by the ellipticity of the diffuse component of the X-ray emission in G76.9+1.0 we suggest a different interpretation for this PWNe. We assume that the diffuse elliptical component of the X-ray emission traces the equatorially-flowing wind from the pulsar, and this wind continues to produce a radio synchrotron torus at large radii, which we see as a “limb brightened” bipolar structure (see Fig. 9). The minimum in the radio emission would then be perpendicular to the equatorial wind, i.e. along the rotation axis of the pulsar as projected on the sky. In this context it is interesting to note that in the radio image there is a smaller secondary minimum diametrically opposite the central one (i.e. at ), similar to the situation in DA495. In our model this would arise because in the equatorial wind one would expect a minimum in the emission along the rotation axis(or its projection on the sky). Interestingly, in the X-ray image (Fig. 6) there is a jet-like feature perpendicular to the diffuse emission, i.e. aligned with the minima which we posit to lie along the rotation axis. Narrow, jet-like features in PWNe are generally posited to lie along the rotation axis of the pulsar (Lai, Chernoff & Cordes, 2001). It has also been suggested that the feature lies along the projection of the magnetic axis on to the rotation axis (Radhakrishnan & Deshpande, 2001), in which case particle beams emanating from the magetic poles, offset from the rotation axis, trace out a pair of arcs, as seen in the Vela, and the wind eventually settles down on the equatorial plane at large radii. In either case one would expect the observed perpendicularity of the jet and the equatorial plane. In our picture, the polarization seen in G76.9+1.0 by Landecker et al. (1993) would be caused by the magnetic field becoming approximately radial at large distances from the pulsar.

7 Conclusions
We report the serendipitous discovery of an unresolved, steep spectrum radio source in the SNR G76.9+1.0. The mean measured radio position of this point source is . Analysis of archival Chandra X-ray data shows this to be coincident with an unresolved X-ray source. Despite a deep search no pulsed emission was detected at 610 MHz and 1160 MHz with the GMRT. However the pulsar has been seen with the GBT at 2 GHz. This has been understood as the consequence of the temporal broadening of the pulse due to the large dispersion measure along the line of sight to the pulsar and the low radio frequencies with which it was observed at the GMRT. The X-ray emission also shows a diffuse elliptical structure aligned along the bipolar structure seen in the radio. We suggest that these structures arise because of an equatorial wind from the pulsar. We underline the usefulness of a high-resolution radio imaging study in locating and prospecting for pulsar candidates in supernova remnants, which could otherwise be missed in a time-series pulsar search observation.
8 Acknowledgements
We thank the GMRT staff for having made possible the observations used for the research reported in this paper. The GMRT is run by the National Centre for Radio Astrophysics of the Tata Institute of Fundamental Research. We are grateful to Z. Arzoumanian and S. Ransom for communicating the results of their GBT pulsar search prior to publication. We thank the referee for pointing us to Arzoumanian et al. (2010). VRM thanks various colleagues for several fruitful discussions during the course of this research. He also thanks the Raman Research Institute, Bangalore, India for their hospitality while writing part of this paper. Stimulating conversations on this project with A. A. Deshpande are also gratefully acknowledged.
References
- Arzoumanian et al. (2008) Arzoumanian Z., Safi-Harb S., Landecker T. L., Kothes R. and Camilo F., 2008, ApJ, 687, 505
- Arzoumanian et al. (2010) Arzoumanian Z., Safi-Harb S., Ransom S., Kothes R., Landecker T., 2010, https://www.cospar-assembly.org/abstractcd/COSPAR-10/abstracts/data/pdf/abstracts/E19-0086-10.pdf
- Bhat et al. (2004) Bhat N. D. R., Cordes J. M., Camilo F., Nice D. J. and Lorimer D. C., 2004, ApJ, 605, 759
- Cordes & Lazio (2003) Cordes, J. M. and Lazio, T. J. W. 2003a, ”NE2001. II. Using Radio Propagation Data to Construct a Model for the Galactic Distribution of Free Electrons”; astro-ph/0301598
- Gaensler & Slane (2006) Gaensler B. M. and Slane P. O., 2006, Annu. Rev. Astron. Astrophys., 44, 1, 17
- Green (2009a) Green D. A., 2009a, Bull. Astr. Soc. India, 37, 45
- Green (2009b) Green D. A., 2009b, A Catalogue of Galactic Supernova Remnants, Cavendish Laboratory, Cambridge, UK(available at ”http://www.mrao.cam.ac.uk/surveys/snrs/”).
- Kothes et al. (2006) Kothes R., Fedotov K., Foster T. J. and Uyaniker B., 2006 A&A, 457, 1081
- Kothes et al. (2008) Kothes R., Landecker T. L., Reich W., Safi-Harb S. and Arzoumanian Z., 2008, ApJ, 687, 516
- Lai et al. (2001) Lai D., Chernoff D. F., Cordes J. M., 2001, ApJ, 549, 1111
- Landecker et al. (1993) Landecker T. L., Higgs L. A and Wendker H. J, 1993, A&A, 276, 522
- Landecker et al. (1997) Landecker T. L., Zheng Y., Zhang X. and Higgs L. A. 1997, A&AS, 123, 190
- Lorimer et al. (1998) Lorimer D. R., Lyne A. G., Camilo F., 1998, A&A, 331, 1002
- Radhakrishnan & Deshpande (2001) Radhakrishnan V., Deshpande A. A., 2001, A&A, 379, 551
- Ransom (2001) Ransom S. M., 2001, PhD Thesis, New Search Techniques for Binary Pulsars
- Ransom et al. (2002) Ransom S. M., Eikenberry S. S. and Middleditch J., 2002, AJ, 124, 1788
- Roy et al. (2010) Roy J., Gupta Y., Pen Ue-Li, Peterson J. B., Kudale S., Kodilkar J., 2010, Exp. Astron.,28, 25
- Swarup et al. (1991) Swarup G., Ananthakrishnan S., Kapahi V. K., Rao A. P., Subrahmanya C. R., Kulkarni V. K., 1991, Cur. Sci., 60, 95
- Wendker et al. (1991) Wendker H. J., Higgs L. A., Landecker T. L., 1991, A&A, 241, 551