High-energy emission from NGC 5506, the brightest hard X-ray Narrow Line Seyfert 1 galaxy
Abstract:
We present results on the hard X-ray emission of NGC 5506, the brightest narrow line Seyfert 1 galaxy above 20 keV. All the recent observations by INTEGRAL, Swift and Suzaku have been analysed and spectral analysis during nine separated time periods has been performed. While flux variations by a factor of 2 were detected during the last 7 years, only moderate spectral variations have been observed, with the hint of a hardening of the X-ray spectrum and a decrease of the intrinsic absorption with time. Using Suzaku observations it is possible to constrain the amount of Compton reflection to , in agreement with previous results on the source. The signature of Comptonisation processes can also be found in the detection of a high-energy cut-off during part of the observations, at energies . When a Comptonisation model is applied to the Suzaku data, the temperature and the optical depth of the Comptonising electron plasma are measured at and , respectively. The properties inferred for NGC 5506 in this study agree with those based on other data sets for the same AGN, and fit the picture of NLS1 having in general lower high-energy cut-offs at hard X-rays than their broad line equivalent.
1 Introduction
In the X-rays below 10 keV, narrow line Seyfert 1 galaxies (NLS1) have characteristics that distinguish them from the broad line objects: they present a soft-excess, strong X-ray variability, a steep X-ray continuum () and a sharp decrease at about 7 keV, interpreted as due to partial covering or to reflection and light bending effects [1]. On the other hand, the hard X-ray properties of NLS1 are not yet well defined, as only a handful of objects has been studied in detail up to now. A work on a small sample of NLS1 observed with INTEGRAL suggested the presence of a relatively low temperature of the electron plasma responsible for the Comptonisation at the origin of the X-ray emission [2]. This lower temperature (when compared to broad line Seyfert 1) is an indication of a more efficient cooling of the emitting plasma that could be related to the higher accretion rates of NLS1 and, therefore, to a higher density of their accretion flow. This would fit the scenario of NLS1 representing a class of AGN that are in rapid evolution and have not yet accreted enough mass to have black holes [3, 4].
The nearby AGN NGC 5506 () is one of the most luminous and brightest Seyfert galaxies in the hard X-rays and turned out to be the brightest NLS1 in this energy band. Due to its brightness, it has been observed by several satellites since the beginning of X-ray astronomy. Even though the flux below 10 keV changed by a factor of 3.5 over the time of BeppoSAX observations, only little or no variations of the hard X-ray flux nor of the X-ray spectral shape were detected [5]. Similarly, a study of the variability of NGC 5506 with RXTE data indicates little energy dependence of the variability in the X-ray band below 15 keV [6] and a variability rather on time scales of several months in the hard X-ray domain [7].
2 Recent hard X-ray observations
Since 2002, INTEGRAL has collected a total of 515 ks and 135 ks of effective exposure time on NGC 5506 with its high-energy instruments IBIS/ISGRI [11] and JEM-X [12], respectively. All these data have been analysed using version 9.0 of the Offline Scientific Analysis Software (OSA) and the spectra have been extracted using the standard OSA spectral extraction.
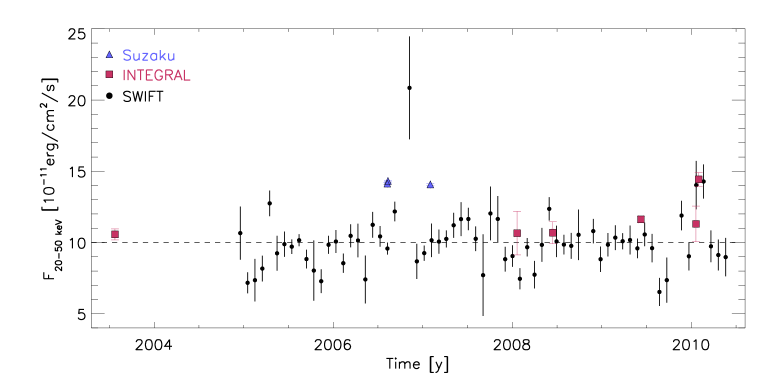
Thanks to its large field of view and to the observing strategy focused on GRB follow-ups, Swift/BAT has monitored NGC 5506 regularly for more than 5 years. The hard X-ray light curve of this source reported in Fig. 1 is provided by the BAT 58-month survey111http://swift.gsfc.nasa.gov/docs/swift/results/bs58mon/ [13]. Four Swift pointed observations of the source have been performed in May–June 2009 and January 2010, for a total of 13 ks of dead-time corrected XRT exposure. These data have been analysed with the Swift software version 3.4 distributed with the HEAsoft 6.7.0 package and the latest available calibration files.
Suzaku observed NGC 5506 during three pointed observations in August 2006 and January 2007, for a total of about 150 ks effective exposure. The XIS spectra have been extracted using the HEAsoft 6.8.0 package and the calibration files released in March 2010. 33 and 55 modes events were reprocessed with the recent software and merged before the spectral extraction. The spectra of the front-illuminated CCDs (XIS0, XIS2 and XIS3) have been added together. The HXD/PIN data have been reprocessed with standard cuts using the HEAsoft 6.7.0 package.
3 Spectral analysis
IBIS/ISGRI observations close in time (within maximum 3 weeks) have been grouped to obtain a sufficient S/N for the spectral analysis. Only periods where a quasi-simultaneous coverage in the soft ( with JEM-X, XRT or XIS) and hard ( with ISGRI or PIN) X-ray band was available have been considered for the spectral analysis (Table 1). The spectra have been fitted with a simple absorbed power law model, modified by a high-energy cut-off and a Compton reflection component (pexrav model), when statistically required. The disc inclination angle has been fixed to [14] and the iron abundances to solar values.
The high S/N ratio spectra obtained with Suzaku/XIS show a much higher complexity than the JEM-X and XRT spectra. Two or three iron lines, an Fe edge and a strong soft excess are present in these spectra (see also [15]). As the main focus of our work is the hard X-ray emission of NGC 5506, we restricted the fit to the data above 1.5 keV, in order to avoid the soft excess component, we fixed the energy of the lines and edge (, , , , in the source rest frame; Fig. 2) and we do not further discuss here the properties of these features. Beside the pexrav model, the Suzaku data have been also fitted with a more physical Comptonisation model (compPS). In this case, we used a slab geometry and seed photons from a multicolor disc with a temperature fixed to .
A cross-calibration factor has been added to all fitting models. The normalization of PIN data relative to XIS data was fixed to (observations
at the XIS nominal position222http://heasarc.nasa.gov/docs/suzaku/analysis/abc/node8.html). The cross-calibration factor of JEM-X relative to ISGRI
has been fitted for the strictly simultaneous, on-axis observation (July 2003), resulting in , and then it was fixed to this value for
all other observation periods.
The ISGRI cross-calibration factor relative to XRT was left free to vary and assumed the values
, for the May-June 2009, Jan 29–30, 2010, and the total XRT+ISGRI observations,
respectively.
Errors quoted in this work are at the 90% confidence level.
3.1 Comptonisation features and spectral variability
| Instr. | Obs. | model | / | / | R | ||
|---|---|---|---|---|---|---|---|
| [keV] | |||||||
| J2+ISGRI | July 2003 | pexrav | 3.52.5 | 2.3 0.2 | - | 2.3 | 0.9/11 |
| XIS+PIN | Aug 8–10, 2006 | pexrav | 3.280.07 | 2.01 0.04 | - | 1.0 0.2 | 1.04/271 |
| compPS | 3.120.07 | 0.6 0.2 | 81 14 | 1.4 | 1.09/270 | ||
| XIS+PIN | Aug 11–12, 2006 | pexrav | 3.350.07 | 2.03 0.04 | - | 0.9 0.2 | 0.91/270 |
| compPS | 3.20 | 0.7 0.2 | 70 12 | 1.3 0.2 | 1.02/269 | ||
| XIS+PIN | Jan 2007 | pexrav | 3.170.07 | 1.93 0.04 | - | 0.6 | 1.06/270 |
| compPS | 3.060.07 | 1.0 | 0.9 0.2 | 1.11/269 | |||
| J1+ISGRI | Jan 2008 | pexrav | 3 | 1.8 | - | 1 | 0.8/7 |
| J1+ISGRI | June 2008 | pexrav | 3 | 2.1 0.2 | - | 1 | 0.61/13 |
| pexrav | 3 | 2.1 0.2 | - | 0.65/12 | |||
| XRT+ISGRI | May–June 2009 | pexrav | 2.60.2 | 1.67 | - | 1 | 0.84/202 |
| J2+ISGRI | Jan 14–25, 2010 | pexrav | 3 | 2.1 | - | 1 | 0.5/8 |
| XRT+ISGRI | Jan 29–30, 2010 | pexrav | 2.5 | 1.4 0.2 | 1.16/79 |
At hard X-rays, NGC 5506 shows flux variations up to a factor of 2 on time scales of years (Fig. 1). In order to investigate the variability of the source parameters across the 7 years of observations, and to have comparable results in the different time periods, we fitted all the spectra with a pexrav model modified by intrinsic absorption (fixed to where not constrained). During none of the nine observational periods it is possible to simultaneously constrain both the high-energy cut-off and the reflection fraction 333 is defined here as the relative amount of reflection compared to the directly viewed primary continuum. For all but one period (Jan 29–30, 2010), the best fit is achieved when assuming no high-energy cut-off and a reflection component either free to vary () or fixed to the average value of . For the Jan 29–30, 2010 spectrum, a cut-off at and an upper limit at for the reflection fraction provide the best fit. For the June 2008 spectrum, a slightly worse fit, but still with , is obtained with no reflection and a lower limit at for the high-energy turnover. Only when fitting the total XRTISGRI spectra, the high-energy cut-off and the reflection fraction can be simultaneously measured, resulting in , .
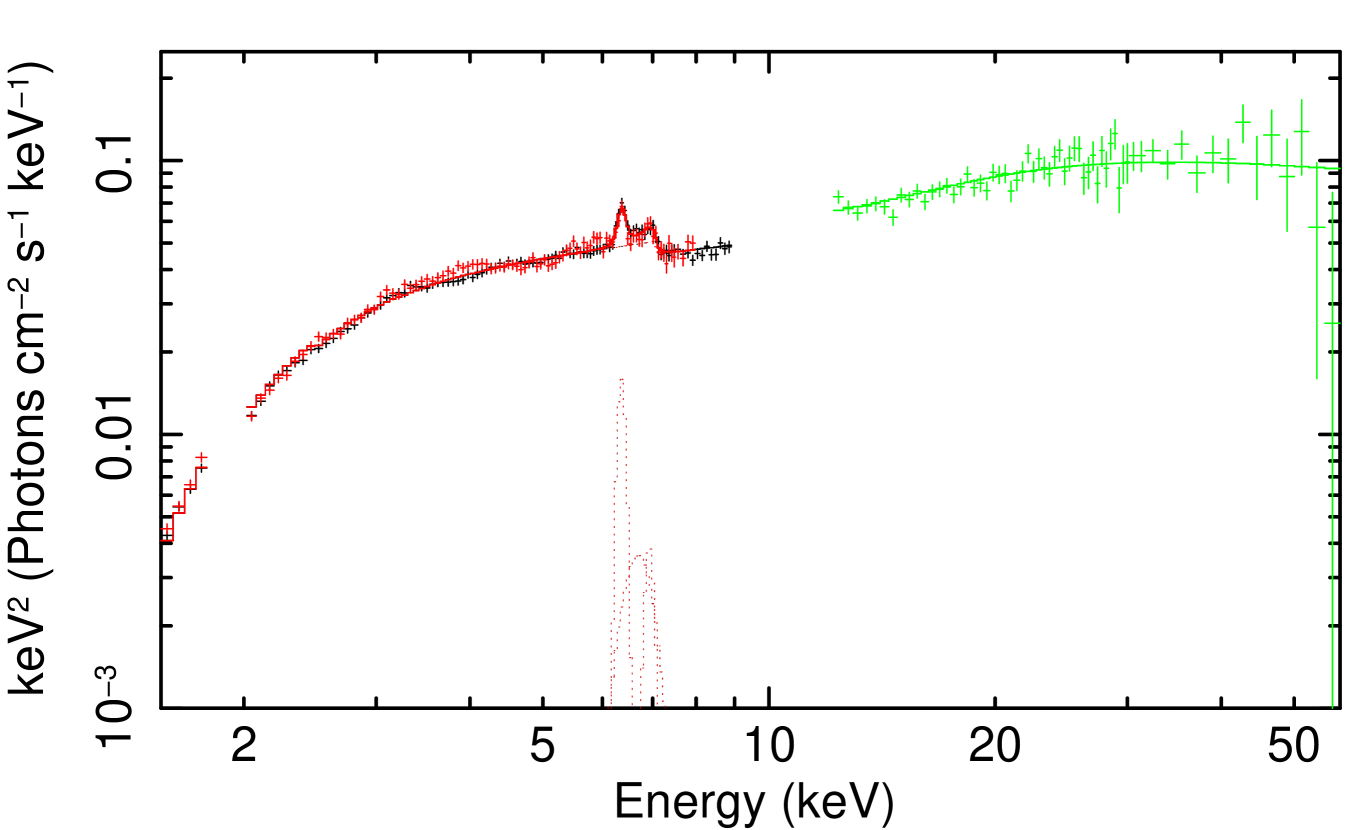
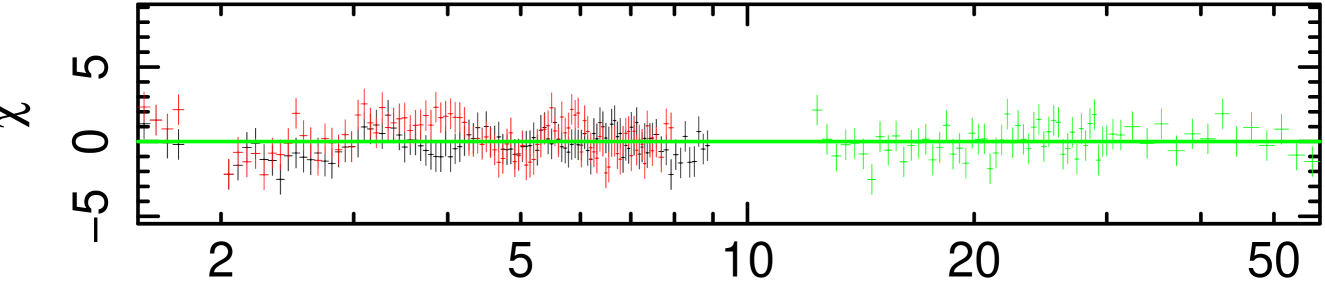
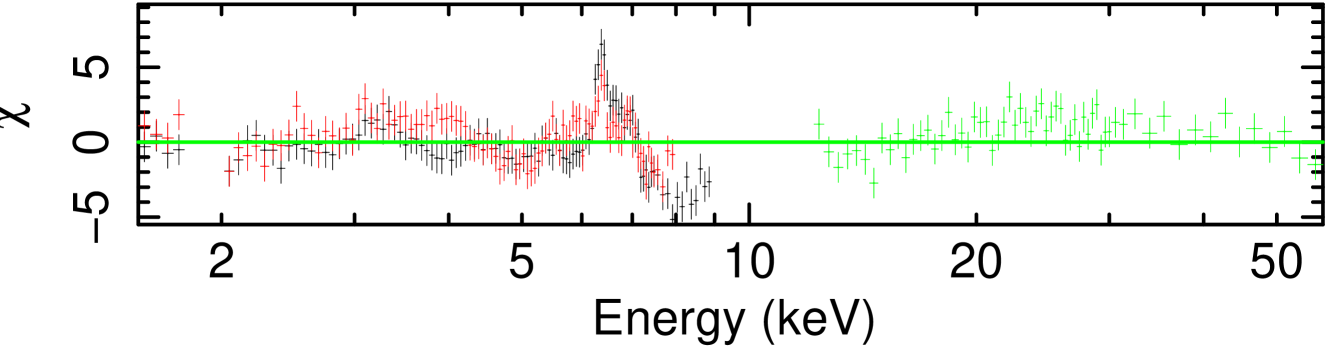
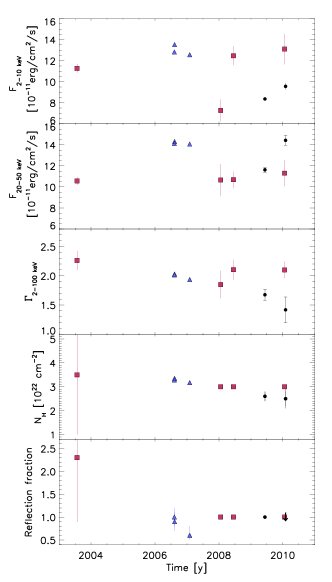
The intrinsic absorption shows limited variations in the range , whereas the power law photon index varies between and , with an average value of (Fig. 3). The only constraining values for the reflection fraction can be obtained with the Suzaku spectra (Fig. 2), providing , when the spectra are fitted with the pexrav model, and when the compPS model is used. With the latter model, we find values of the optical depth and temperature of the plasma cloud of and , respectively, which translate into a high-energy cut-off at in the photon spectrum. It is important to notice that the compPS model does not provide a statistically better fit than the pexrav model for the 3 Suzaku spectra and that the relatively low upper energy boundary of the PIN spectra () does not make this instrument the most suitable one for measuring turnovers around 100 keV. A more exhaustive analysis of the mean spectral properties of this source, exploring a wider parameter space and including XMM-Newton data, will be presented in Lubinski et al. (in preparation).
4 Discussion and conclusions
The intrinsic hard X-ray spectrum of NGC 5506 measured with INTEGRAL, Swift and Suzaku data is well represented by a power law with , modified by a reflection fraction and a high-energy cut-off at . During previous observations with BeppoSAX, XMM-Newton and INTEGRAL [16, 17, 5, 18], this NLS1 showed similar properties to those revealed by our study, with a spectrum with photon index , a strong Compton reflection with but only lower limits at 100–200 keV for the high-energy cut-off. In spite of the observed flux variations, NGC 5506 spectral shape seems to be quite stable, with only a hint of hardening of the spectrum and decreasing intrinsic absorption during the recent hard X-ray observations.
The intrinsic spectrum of NGC 5506 is found to be consistent with that observed in average for NLS1. An early work with a limited sample of 5 NLS1 detected with INTEGRAL found an average steep spectrum at hard X-rays with , interpreted as due to the presence of an unconstrained cut-off at [2]. More recent results on a sample of 14 hard X-ray selected NLS1 have been presented by [19, 20, 21]. The average hard X-ray NLS1 spectrum results to be only slightly softer, with , compared to that of BLS1 ( [19, 21, 22]). This is again possibly due to the presence of a cut-off in the NLS1 hard X-ray spectrum at lower energies of [19, 20] compared to the values of observed in BLS1 [19, 20, 22] and Seyfert 1 galaxies in general (; [18]).
A quite large discrepancy is found in the estimate of the black hole mass of this object, with values ranging from to [23, 24, 25, 26]. With a 0.1–300 keV luminosity of and assuming a twice as large bolometric luminosity, NGC 5506 presents an Eddington ratio of . A black hole of few fits better the scenario of NGC 5506 belonging to a class of AGN in an early evolutionary state and powered by extreme accretion rates. In addition, a low mass would also agree with the lack of strong relativistic broadening of the broad Fe K line recently detected in this AGN [14].
Acknowledgments
S.S. acknowledges the Centre National d’Etudes Spatiales (CNES) for financial support. Part of the present work is based on observations with INTEGRAL, an ESA project with instruments and science data centre funded by ESA member states with the participation of Russia and the USA.
References
- [1] L. C. Gallo, Investigating the nature of narrow-line Seyfert 1 galaxies with high-energy spectral complexity, MNRAS 368 (2006) 479
- [2] A. Malizia, L. Bassani, A. J. Bird et al., First high-energy observations of narrow-line Seyfert 1s with INTEGRAL/IBIS, MNRAS 389 (2008) 1360
- [3] S. Mathur, Narrow-line Seyfert 1 galaxies and the evolution of galaxies and active galaxies, MNRAS 314 (2000) 17
- [4] B. M. Peterson, I. M. McHardy, B. J. Wilkes et al., X-Ray and Optical Variability in NGC 4051 and the Nature of Narrow-Line Seyfert 1 Galaxies, ApJ 542 (2000) 161
- [5] M. Dadina, BeppoSAX observations in the 2–100 keV band of the nearby Seyfert galaxies: an atlas of spectra, A&A 461 (2007) 1209
- [6] P. Uttley & I. M. McHardy, X-ray variability of NGC 3227 and 5506 and the nature of active galactic nucleus ‘states’, MNRAS 363 (2005) 586
- [7] V. Beckmann, S. D. Barthelmy, T. J.-L. Courvoisier et al., Hard X-ray variability of active galactic nuclei, A&A 475 (2007) 827
- [8] C. Winkler, T. J.-L. Courvoisier, G. Di Cocco et al., The INTEGRAL mission, A&A 411 (2003) 1
- [9] N. Gehrels, G. Chincarini, P. Giommi et al., The Swift Gamma-Ray Burst Mission, ApJ 611 (2004) 1005
- [10] K. Mitsuda, M. Bautz, H. Inoue et al., The X-Ray Observatory Suzaku, PASJ 59 (2007) 1
- [11] F. Lebrun, J. P. Leray, P. Lavocat et al., ISGRI: The INTEGRAL Soft Gamma-Ray Imager, A&A 411 (2003) 141
- [12] N. Lund, C. Budtz-Jørgensen, N. J. Westergaard et al., JEM-X: The X-ray monitor aboard INTEGRAL, A&A 411 (2003) 231
- [13] W. Baumgartner et al., submitted to ApJS (2011)
- [14] M. Guainazzi, S. Bianchi, G. Matt et al., Final verdict from XMM-Newton: the X-ray obscured Seyfert galaxy NGC 5506 has a broad Fe K line, MNRAS 406 (2010) 2013
- [15] T. Miyazawa, Y. Haba, H. Kunieda, Broad-Band Temporal and Spectral Variation of 36 Active Galactic Nuclei Observed with Suzaku, PASJ 61 (2009) 1331
- [16] G. Matt, M. Guainazzi, G. C. Perola et al., The complex iron line of NGC 5506, A&A 377 (2001) L31
- [17] S. Bianchi, I. Balestra, G. Matt et al., The recent X-ray history of NGC 5506, A&A 402 (2003) 141
- [18] V. Beckmann, S. Soldi, C. Ricci et al., The second INTEGRAL AGN catalogue, A&A 505 (2009) 417
- [19] C. Ricci, R. Walter, T. J.-L. Courvoisier, S. Paltani, Reflection in Seyfert Galaxies and the Unified Model of AGN, A&A in press (2011) [arXiv:1104.3676]
- [20] C. Ricci, The average hard X-ray spectra of NLS1, in Proceedings of the Workshop Narrow-Line Seyfert 1 Galaxies and Their Place in the Universe, \posPoS(NLS1)021 (2011).
- [21] F. Panessa, The INTEGRAL Narrow-Line Seyfert 1 Galaxies, in Proceedings of the Workshop Narrow-Line Seyfert 1 Galaxies and Their Place in the Universe, \posPoS(NLS1)022 (2011).
- [22] M. Molina, L. Bassani, A. Malizia et al., The INTEGRAL complete sample of type 1 AGN, MNRAS 399 (2009) 1293
- [23] K. Hayashida, S. Miyamoto, S. Kitamoto et al., Central Black Hole Masses in Active Galactic Nuclei Inferred from X-Ray Variability, ApJ 500 (1998) 642
- [24] I. E. Papadakis, The scaling of the X-ray variability with black hole mass in active galactic nuclei, MNRAS 348 (2004) 207
- [25] W. Bian & K. Gu, The Eddington Ratios in Seyfert 2 Galaxies with and without Hidden Broad-Line Regions, ApJ 657 (2007) 159
- [26] M. Nikołajuk, B. Czerny, P. Gurynowicz, NLS1 galaxies and estimation of their central black hole masses from the X-ray excess variance method, MNRAS 394 (2009) 2141