GMRT observations of NGC 2997 and radio
detection of the circumnuclear ring
Abstract
We present high-resolution, high-sensitivity radio continuum observations of the nearby spiral galaxy NGC 2997 at 332, 616 and 1272 using the Giant Metrewave Radio Telescope (GMRT). The integrated spectrum of this galaxy has a spectral index of () and we place an upper limit to the thermal fraction at 1272 of 10 per cent. Our multi-frequency study shows a relatively flat spectrum source () at the centre of the galaxy. This leads to radio detection of a circumnuclear ring in the high resolution map at 1272 . We detect five hotspots in the ring, with average star formation rate of , a median SN rate of and luminosity of . We estimate an equipartition field in the central nuclear region of diameter pc to be about G. We also report several interesting features along the spiral arms. In this paper, we present the low frequency radio continuum maps, the spectral index distribution, the circumnuclear ring and the derived physical properties.
keywords:
galaxies: individual: NGC 2997- radio continuum: galaxies - galaxies: nuclei - galaxies: statistics1 Introduction
NGC 2997 is an interesting grand design spiral galaxy of type SAB(rs)c located
in the loose galaxy group LGG 180 (Garcia, 1993). The disc inclination is
(Milliard & Marcelin, 1981) and the southern part of the disc is closer
to us (Peterson, 1978). We assume a distance of 13.8 Mpc (Tully, 1988)
to NGC 2997 and note that 1 arc-min corresponds to a linear scale of 4.0 kpc.
Basic data on NGC 2997 are listed in Table 1.
The photometric and morphological analysis of this galaxy shows the presence
of a normal nucleus surrounded by several HII regions known as ‘hotspots’ (Pastoriza, 1975).
Further investigations in optical (Meaburn & Terrett, 1982), ultraviolet (Maoz et al., 1996) and
near-infrared (Elmegreen et al., 1999) have detected a circumnuclear star-forming ring in NGC 2997.
The study of such a ring is significant in terms of understanding gas transport to the
inner regions of the galaxy and its association with any possible nuclear activity.
NGC 2997 also shows several bright knots of emission along its arms.
These knots are young star clusters with typical masses of M⊙
(Grosbøl et al., 2006). This galaxy also hosts two giant HII regions which show supersonic
velocity dispersion caused by an intense starburst (Firpo et al., 2005).
The galaxy which is part of the HI brightest galaxy catalogue
of the southern sky derived from HIPASS has an HI mass of M⊙
and half power line width of (Koribalski et al., 2004).
NGC 2997 has been extensively studied in radio wavelengths
shorter than cm by Han et al. (1999) and Men & Han (2005). To the best of our knowledge,
this galaxy has not been studied at longer wavelengths ( cm). Since
the non-thermal spectrum of synchrotron radiation is dominant at low frequencies,
the GMRT observations at metre-wavelengths with high angular resolution and high
sensitivity can reveal many significant features of NGC 2997 due to its moderate
inclination such as smooth synchrotron emission from the disc, morphological structure
of spiral arms, nucleus and compact HII regions. The spectral index distribution
study of NGC 2997 could be useful for identification of giant HII regions.
The low radio frequency spectrum of the galaxy is important
in obtaining the non-thermal spectral index of the galaxy which can then be used
to separate the thermal and non-thermal contributions to the observed spectrum.
Moreover, the non-thermal luminosities at low frequencies can be used to estimate
the supernovae rate (), average star formation rate (),
production rate of the Lyman continuum photons () etc for the galaxy.
In this paper, we present radio continuum observation of NGC 2997
using the GMRT (Ananthakrishnan, 2005; Swarup et al., 1991) at 332, 616 and 1272 . Section 2 describes
the observations and the data reduction procedure. Section 3 presents the total
intensity maps and the morphological details of radio continuum features of NGC 2997.
In section 4, we discuss the total emission spectrum of the galaxy, the spectral
index map derived between 1272 and 332 and the circumnuclear ring.
The last section summarizes the paper.
| Optical center (J2000) | 09h45m38.8s -31d11 |
|---|---|
| Morphological type‡ | SAB(rs)c |
| Major diameter (arcmin) | 8.9 |
| Minor diameter (arcmin) | 6.8 |
| Distance () | 13.8 Mpc |
| Magnitude (Visual) | 10.06 |
| Inclination angle (deg.) | 40 |
| Heliocentric radial velocity () | 1088 2 |
†Reference : NASA/IPAC Extragalactic Database (NED)
‡de Vaucouleurs et al. (1991)
2 Observations and data reduction
We had a total of three observing sessions on NGC 2997 using the GMRT synthesis
array at each of the three frequency bands 332, 616 and 1272
respectively. Observing sessions were conducted in the period from 2003 to 2004
using the standard spectral line mode of the GMRT digital correlator which gives
visibility data of 16 bandwidth across 128 channels for two polarisations.
The observational parameters are summarized in Table 2. The raw visibility
data were converted to FITS and analysed using standard AIPS111Astronomical Image Processing System, distributed by the National Radio Astronomy Observatory, http://www.aips.nrao.edu. The NRAO is a facility of the National Science Foundation operated under cooperative agreement by Associated Universities, Inc..
The VLA flux density calibrators, 3C147 and 3C286 were used as flux
density reference to scale the flux densities of phase calibrators and the target
source. To correct the ionospheric and instrumental gain variations, phase calibrator
0837-198 was observed for 6 during every 25 of observation of
the target source. The flux density values of phase calibrators obtained using the task
GETJY are given in Table 2. The flux density calibrators were also used
for bandpass calibration. To avoid bandwidth smearing effect, the band-pass calibrated
data at 616 and 1272 band were collapsed to five channels each of 2.75
bandwidth by averaging every 22 channels. At 332 , ten channels each
of 1.25 bandwidth formed from RFI free band by averaging every 10 channels.
The expected error bars in flux density scale for the GMRT observations are per cent.
| Observing band () | 332 | 616 | 1272 | |
|---|---|---|---|---|
| 1. | Date | 2004 Feb 24 | 2003 Jan 21 | 2003 Aug 16 |
| 2. | Correlator used (USB/LSB)a | USB | USB | LSB |
| 3. | On source time(Hrs.)b | 5 | 4 | 3 |
| 4. | Receiver bandwidth () | 16 | 16 | 16 |
| 5. | No. of working antennasc | 27 | 24 | 28 |
| 6. | Shortest spacing(k) | 0.06 | 0.120 | 0.250 |
| 7. | Longest spacing(k) | 27 | 40 | 101 |
| 8. | Largest visible structured | 19′ | 12′ | 8′ |
| 9. | Flux density calibrator(s) | 3C147,3C286 | 3C147,3C286 | 3C147,3C286 |
| Flux density in Jy e | 52.69,25.96 | 38.26,21.07 | 23.69,15.48 | |
| 10. | Phase calibrator(s) | 0837-198,0902-142 | 0837-198 | 0837-198 |
| Flux density in Jy f |
a. USB-Upper side band, LSB-Lower side band. b. Total observation time on the object before editing. c. Maximum number of antenna operational at any time during the observation. d. Corresponding to the shortest spacing present in our data. e. Set by SETJY task : Using VLA (1999.2) or Reynolds (1934-638) coefficients. f. Flux density and error from GETJY.
First, a low resolution map of arcsec was made using ‘uvtaper’
at each observing frequency and the entire primary beam was imaged. We also used
varying tapers to generate maps of different angular resolution which can be compared
at the different frequencies. There were two to three strong point sources near the
edge of primary beam at each frequency with peak flux ten to twelve times stronger
than the peak flux on the object. These sources were removed using the task UVSUB.
Wide field imaging was used at 616 and 332 . The number of
facets used for imaging NGC 2997 at 616 and 332 were 13 and 22 respectively
(obtained using SETFC task in AIPS). No self calibration was done at 1272 .
At other frequencies, the visibility data sets were first phase self-calibrated using
only strong point sources near or within the inner quarter of the primary field. After
two to three iterations of phase self-calibration using only point sources, the source
model obtained by cleaning up to the rms noise level of the map was included in
self-calibration. At 332 and 616 , it took about four to six iterations to
get good convergence of self-calibration resulting in improved dynamic range maps.
All facets were combined and primary beam correction applied using the FLATN task
to produce a map at each observing frequency.
3 Observational results
3.1 Total intensity maps
We made total intensity maps of the object with angular resolution ranging
from 45 to 3 arcsec. Whenever possible, the total intensity maps at different
observing frequencies were made with a similar angular resolution by using the
uv-tapering function in the task ‘IMAGR’. Fig.1 shows the total
intensity maps of NGC 2997 at 1272, 616 and 332 at a resolution of 15 arcsec
overlaid on the optical Digitized Sky Survey image. The uv-tapering and weighting functions
used while mapping the object are given in Table 3.
| Figure | 1a | 1b | 1c |
|---|---|---|---|
| Band Center ()† | 1272 | 616 | 332 |
| Synthesized Beama | @ | @ | @ |
| Restoring Beamb | |||
| UV-taper/Weighting | /NA | /NA | /UN |
| RMS noise () | 0.3 | 0.6 | 1.0 |
| Figure | 2 | 5-contour | 5-left grey |
| Band Center ()† | 1.27 | 1.27 | 4.8 |
| Synthesized Beama | @ | @ | @ |
| Restoring Beamb | |||
| UV-taper/Weighting | /NA | None/UN | None/UN |
| RMS noise () | 0.6 | 0.08 | 0.04 |
†All maps are stoke I and corrected for the shape of the GMRT primary beam.
NA-Natural weighting, UN-Uniform weighting.
Final bandwidth for analysis after editing is about at each frequency.
a. Synthesized beam for a deconvolution, position angle with respect to the major axis is given in degree.
b. Restoring beam is a circular Gaussian with PA=0 degree, and the area is approximated to the
devoncolving beam area in square arcsec .
c. Map using the VLA archival data.
The multifrequency total intensity GMRT maps in Fig. 1
show about six common radio continuum features of NGC 2997. These discrete features
are labelled by numbered tags in Fig.1a. In Table 4, we summarize
their positions, size, observed flux densities, etc. The peak positions of the discrete features
listed in Table 4 match within median errors of
and arcsec. The summary of radio continuum emission features seen in
NGC 2997 is as follows :
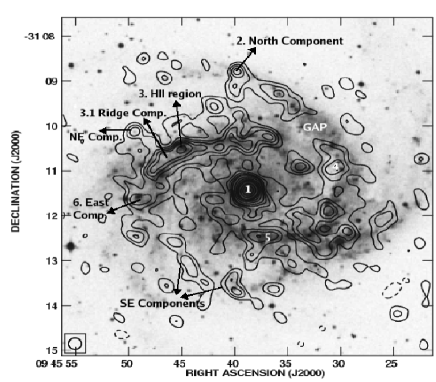 |
Fig. 1a : The 1272 radio contour map superimposed on the optical Digitized Sky Survey image. The six discrete radio continuum features detected at three wavebands are labelled with numbers. The peak brightness is 21 . The rms is 0.3 mJy per beam area, the beam is depicted at the bottom left corner. The contours are at ( -3, 3, 5, 7, 9, 11, 15, 20, 25, 30, 40, 50, 60, 70 ) |
|
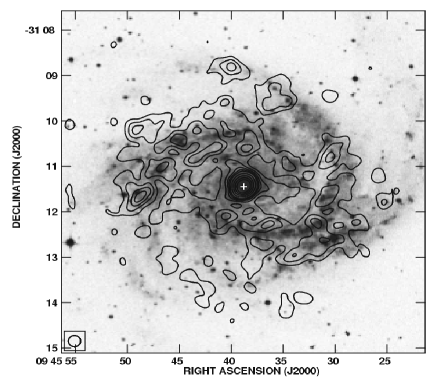
Fig. 1b : The 616 radio contour map overlaid on the DSS optical image. The radio peak position of the nucleus is marked as a plus sign. The peak brightness is 28.4 . The rms is 0.6 mJy per beam area, the beam size is depicted at the bottom left corner. Contours : ( -3, 3, 5, 7, 9, 11, 15, 20, 25, 30, 40 ) |
|
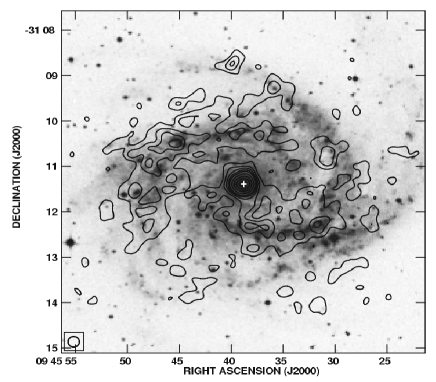
Fig. 1c : The 332 radio contour map overlaid on the DSS optical image. The radio peak position of the nucleus is marked as a plus sign. The peak brightness is 40.9 . The rms is 1 mJy per beam area, the beam size is shown at the BLC. Contours : ( -3, 3, 5, 7, 9, 11, 15, 20, 25, 30, 40 ) . |
(i) The radio disc in the GMRT
low-resolution images has an extent
of by which is comparable to the optical extent. The extent of radio
emission in the low resolution map at 1272 is comparable to the NVSS grey-scale
image (Condon et al., 1998) as shown in Fig.2.
(ii) All our total intensity maps show the compact bright
nucleus, centred at, RA; DEC (J2000).
The uncertainties in RA and DEC are and arcsec, respectively.
The radio peak position coincides with the values given by Han et al. (1999),
Men & Han (2005) and also the optical centre (see Table 1).
At first glance, the intense unresolved nucleus at 15 arcsec resolution (Fig.1)
appears like an AGN.
| Source | Observed position | Integrated flux densities () | Spectral index | Comments | ||
|---|---|---|---|---|---|---|
| at 1272 | & Peak intensities () at | 332-1272 | ||||
| 1272 | 616 | 332 | () | |||
| 1 | 09 45 38.76 0.0 | 38.7 1.6 | 56.6 3.1 | 86.34.0 | -0.6 | Nuclear region |
| -31 11 26.60 0.3 | 21.0 0.5 | 28.4 1.2 | 40.9 1.3 | -0.5 | ||
| 2 | 09 45 39.65 0.1 | 13.7 2.4 | 20.9 4.8 | 21.0 4.6 | -0.31 | North source |
| -31 08 51.15 2.1 | 4.2 0.6 | 6.9 1.2 | 8.1 1.3 | -0.48 | ||
| 3 | 09 45 45.05 0.1 | 16.7 2.1 | 14.0 4.6 | 12.043.6 | 0.24 | HII region in northern |
| -31 10 33.08 1.1 | 6.0 0.6 | 4.9 1.2 | 6.5 1.4 | -0.06 | arm | |
| 3.1 | 09 45 45.87 0.3 | 19.3 3.7 | 27.0 5.2 | 59.814 | -0.84 | Northern ridge |
| -31 10 41.19 2.3 | 6.3 0.5 | 6.8 0.9 | 15.2 1.2 | component (5.0 by 2.1 ) | ||
| 4 | 09 45 30.53 0.2 | 5.3 2.0 | 18.3 5.6 | 22.64.9 | -1.08 | Nonthermal north-west |
| -31 10 54.90 4.1 | 2.1 0.6 | 5.0 1.2 | 8.0 1.3 | -0.98 | component | |
| 5 | 09 45 37.42 0.3 | 6.1 2.1 | 5.8 3.2 | 15.65.0 | -0.69 | Component in southern arm |
| -31 12 28.48 2.3 | 2.25 0.5 | 3.42 1.3 | 5.4 1.3 | -0.65 | ||
| 6 | 09 45 48.84 0.2 | 26.1 4.4 | 13.3 4.1 | 22.55.3 | 0.11 | East component of |
| -31 11 36.10 2.5 | 3.9 0.5 | 5.4 1.2 | 7.3 1.3 | -0.45 | North-east arm | |
(iii) The radio continuum emission associated with both
the spiral arms is clearly detected in all the maps shown in Fig.1.
There is an intense ridge of emission along the northern spiral arm as compared to
the southern arm.
(iv) No radio emission is detected in the northern part
of the southern spiral arm near the region at RA=9h45m32.8s; DEC
(labelled as ‘GAP’ in Fig. 1a). This region is bluer in the optical image,
suggesting a young star forming complex. This gap has also been noted in the VLA total
intensity maps at , 18, cm and in the polarized intensity maps
at and cm (Han et al., 1999; Men & Han, 2005).
(v) A bright compact source (component 2) is seen in all
our maps of NGC 2997 at RA; DEC,
in the north of the galaxy. No discrete optical counterpart is seen for this source.
(vi) All the maps in Fig.1 show
an intense region (component 3) in the northern spiral arm, near
RA; DEC.
This compact region is coincident with the giant HII region identified by
Firpo et al. (2005) using high resolution optical spectra ().
Apart from this, a prominent north-east discrete component (labelled as ‘NE Comp.’)
is seen in Figs.1a and 1b, positioned at RA=09h45m49.28s, DEC
(J2000) and lying roughly above the northern ridge. This component appears to be a flat spectrum
source since it is barely detected in the 332 map (Fig. 1c).
Global radio continuum properties :
The integrated flux densities given in Table 5 are obtained by
integrating the region above contour in the low resolution
maps (45 arcsec). The measured spectral power ranges from
at 1272 MHz to
at 332 MHz. At 1.4 , normal galaxies range in power from L
where
h (Condon, 1992).
The global spectral index values given in Table 5 indicate
that the spectrum flattens at the lower frequencies. The total emission spectrum
of many normal spiral galaxies with moderate surface brightness are known to
show a break in the range from 0.1 to 1 . One of the reasons
for this is possibly free-free absorption by the cool ()
ionized gas filling a large fraction of the radio emitting volume (Israel & Mahoney, 1990).
On the other hand, the break could be due to propagation effects of relativistic
electrons and subsequent energy losses (Hummel, 1991; Pohl, Schlickeiser, Hummel, 1991)
| Observing band () | 332 | 616 | 1272 |
|---|---|---|---|
| Flux density (mJy) | 1134 | 730 | 367 |
| Spectral Power () | 24.4 | 15.7 | 7.9 |
| Global Spectral Index () |
†The reasonable error bars in flux density scale are expected to be per cent.
The radio-selected samples of normal galaxies are characterized by the FIR/radio flux density ratios (Condon, 1992). Helou et al. (1985) defined the parameter as a logarithmic measure of the FIR/radio flux density ratio. For more general comparisons, the is defined as (Fitt et al., 1996), where is the radio spectral index (). The spectral index for the observed GMRT data is -0.79 0.07. From the IRAS surveys (Fitt et al., 1996) at 60 and 100 the flux densities of NGC 2997 are 32.28 and 85.14 Jy, respectively. Using the IRAS FIR flux density measurements and integrated flux densities measured with the GMRT, the derived parameter is , which is close to the median for spiral galaxies at 1.4 , i.e. with the rms scatter (Condon & Broderick, 1988; Condon et al., 1991b; Helou et al., 1985). The spectral power and FIR/radio flux density ratio found at our observing frequencies confirms that NGC 2997 is a normal spiral galaxy.
4 Discussion
4.1 The observed radio spectrum & SFR
Integrated flux densities of NGC 2997 obtained using the GMRT and other
published data from 0.33 to 8.46 are listed in Table 6.
A single power law () with 0.04 gives
the best-fitting to the radio spectrum from 0.33 to 5 (Fig. 3).
A value of is quoted by Men & Han (2005) for the radio spectrum from
1.43 to 8.46 . Niklas et al. (1997) analysed the radio continuum spectra of 74 galaxies
to separate the thermal and the non-thermal radio emission. The mean value obtained for non-thermal
spectral index is . They also studied the correlation
of the morphological type and non-thermal spectral index and found that spiral galaxies of type Sc
show to be in the range of to . Spectral index of NGC 2997
which is a Sc galaxy lies in the above range. The flatter spectrum
for the GMRT data at the lower frequencies compared to the wide band spectral index value
could suggest a break in the spectrum at . However the change in
is only and needs to be confirmed with data at still lower .
Condon & Yin (1990) estimated a global thermal fraction for most of the normal galaxies,
as : ,
where S is the total flux density, and is the flux density due to the thermal component.
Taking, , thermal fractions derived at 1272, 616 and 332 are
10, 6 and 4 per cent respectively of the measured total flux density value at each
observing band. The derived thermal fraction at 1.2 GHz agrees with the obtained mean
value of thermal fraction at for 74 galaxies by Niklas et al. (1997) which is
. The average thermal fraction
at 1.4 in normal galaxies is per cent (Kennicutt, 1983b; Condon & Yin, 1990).
The standard method applied here to derive the thermal fraction
using the constant non-thermal spectral index is simplistic. Tabatabaei et al. (2007b) derived the
thermal radio continuum in the galaxy M33 from the extinction corrected Hα map
instead of using a constant across the galaxy. They find that the thermal
fraction of M33 at cm using the new method is per cent lower than
found by assuming a constant across the galaxy. However, Tabatabaei et al. (2007b) note
that the thermal fraction derived from the radio integrated spectrum of M33 using
the standard method and the new method agree. Hence, assumption of a constant
non-thermal spectral index to derive the thermal fraction is reasonable when the integrated
spectrum is used.
Considering the small value of the thermal fraction in the total emission of
NGC 2997 at low frequencies, we assume that the spectral power given in Table 5 is
mostly non-thermal.
We estimate the supernova rate (yr-1) in NGC 2997 from the non-thermal
luminosity (Condon & Yin, 1990). The estimated supernova rate for the disc and nuclear region is about
and respectively.
In order to compare the SN rate per kpc2, we assumed a diameter
and kpc for the nucleus and the disc respectively.
The SN rate per kpc2 for the nucleus and the whole disc is about and
respectively.
If we assume a filling factor of for the disc, the SN rate for
the disc is about
i.e. the nuclear region has a SN rate which is 40 times higher than the rate
in the disc.
The tight correlation between the radio continuum
intensities and the FIR luminosities is known to be linear
over a wide range in star formation rate from normal spirals to the most intense starbursts
(Lacki et al., 2010). Roy et al. (1998) found that Seyfert galaxies with radio quiet cores follow the linear
radio-FIR correlation similar to normal galaxies. NGC 2997 is a
late type spiral galaxy and having no obvious companion (Milliard & Marcelin, 1981).
With the resultant steep spectral index of NGC 2997,
absence of an active nucleus (see section 4.3), and the observed logarithmic
measure of FIR/radio flux density ratio at our observing frequencies,
the linear correlation between FIR and radio emission exists in NGC 2997.
For estimating various parameters like average formation
rate of stars more massive than
(SFR() ) and the ionization rate of
the Lyman continuum photons () given in Table 7,
we assumed a simple model with only one free parameter the average formation
rate of stars more massive than (Condon, 1992).
| Frequency | Flux density | Reference |
|---|---|---|
| Jy | ||
| 8.460 | 0.034 0.004 | Han et al. (1999)a |
| 5.010 | 0.092 0.010 | Whiteoak (1970) |
| 4.860 | 0.067 0.011 | Han et al. (1999)a |
| 4.850 | 0.141 0.014 | Wright et al. (1996) |
| 2.373 | 0.160 0.010 | Han et al. (1999) |
| 1.543 | 0.255 0.020 | Han et al. (1999) |
| 1.490 | 0.290 | Condon (1987) |
| 1.400 | 0.235 0.010 | Condon et al. (1998) |
| 1.272 | 0.367 0.008 | This paper |
| 0.616 | 0.730 0.022 | This paper |
| 0.332 | 1.134 0.111 | This paper |
a.Lower limits, because of missing spacing problems, not included in fit in Fig.3

Radio counts of young Galactic SNRs suggest a radio supernova rate of 0.013 yr-1 (Caswell & Lerche, 1979) or Type II supernova rate estimated by Tammann (1982). Our data suggest that the supernova rate in NGC 2997 is a factor of three to four times higher than that of our Galaxy. The Lyman continuum photon rate of the Galaxy is photons s-1 (Güsten & Mezger, 1982). The derived star formation rate in NGC 2997 suggest that the galaxy is a normal galaxy with intermediate star formation. The derived values of star formation rate and the Lyman continuum photon rate of NGC 2997 are less than the values derived for M82 by Condon (1992) but higher than our Galaxy. For M82, the star formation rate SFR() is , the ionization rate is and the radio supernova rate is (Condon, 1992).
| Disc | Nuclear region | |
|---|---|---|
| 1. Star-formation rate () | 1.9 | 0.2 |
| 2. The ionization rate (s-1) | 6.7 | 0.8 |
| 3. The supernova rate (yr-1) | 0.08 | 0.01 |
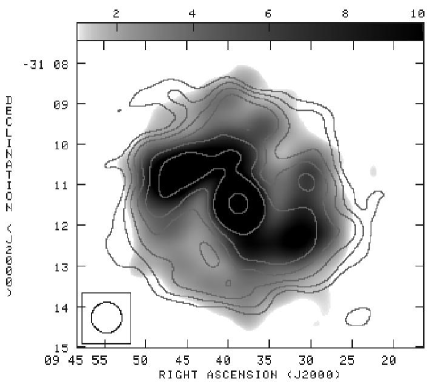
4.2 Spectral index (SI) distribution
The spectral index () distribution across the galaxy
was determined by using total intensity maps of identical beamsize at 1272 and
332 respectively. Both the maps were convolved with a circular
Gaussian beam of 18 arcsec in size and all points below level were
blanked out. Spectral index map () was then derived using
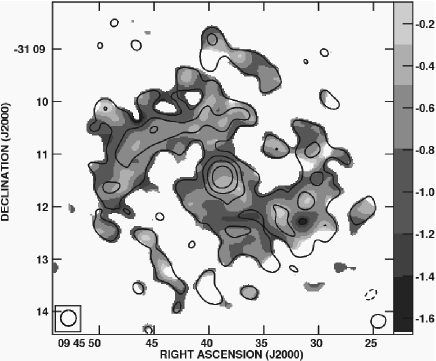
the COMB task in AIPS. The SI map between 1272 and 332 is shown as a grey scale image
in Fig.4 (left) with the 1272 radio contour map
superimposed on it. The uncertainty for the measured SI map is shown in
the right panel of Fig.4. The spectral index measured over most
of the disc shows uncertainty in the range of 0.05 to 0.25. The uncertainty
map (Fig.4 right) shows intense regions (i.e. high S/N) having
error whereas uncertainty increases in the fainter parts
of the galaxy. Strong features registered with position errors of the order of
3 to 4 arcsec in total intensity maps can make larger changes in the spectral
index measurements. The errors in RA and DEC in our total intensity maps
are and arcsec, respectively.
 |
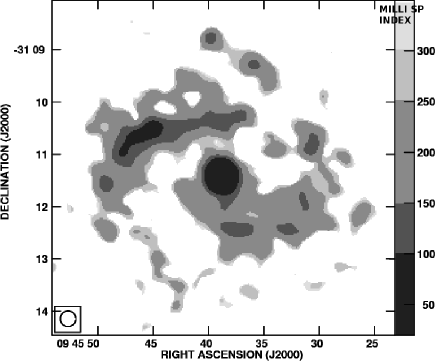 |
The SI map in Fig. 4 shows that the radio spectrum
is flatter in nature wherever brightness peaks such as intense spiral arms and nucleus exist,
whereas radio spectrum of the outer parts of spiral arms show steeper spectrum.
The radio emission from normal galaxies is known to be closely related to the
population of young massive main sequence stars which ionizes the HII regions causing
the free free thermal radio emission. The supernova explosions of these young massive
stars accelerate the relativistic electrons causing the non-thermal synchrotron emission.
As the spectral indices of Galactic supernovae remnants (SNRs) are known to show a
broad range () with a mean value of (Trushkin, 1999) and considering
that the thermal fraction of the observed total flux densities at low frequencies is less
than 10 per cent, the relative flatter spectral index regions in spiral arms could
suggest direct contribution of non-thermal emission by SNRs.
The spectral index value which increases up to in the outer parts
of the spiral arms indicates the energy losses of the relativistic electrons while
they diffuse away out of their place of origin in star forming regions.
We measured a spectral index for the nucleus
by a single power law fit to the flux densities listed in Table 4 (source 1).
This is consistent with the mean spectral index value of the nucleus in the SI map
shown in Fig.4 ().
A relatively flatter spectral index of the nuclear region might be due to a
younger population of particles, due to the thermal contribution by ionized
gas in massive-star clusters and SNR.
The spatial spectral index for the ridge-component in the northern
spiral arm varies from .
The source in the ridge-component (Fig.4, left)
is a giant HII region and the core source in this region is classified as a
thermal source (Firpo et al., 2005). The spectral index value for source 3 is
(see Table 4) and confirms the thermal nature of emission.
4.3 The circumnuclear ring
 |
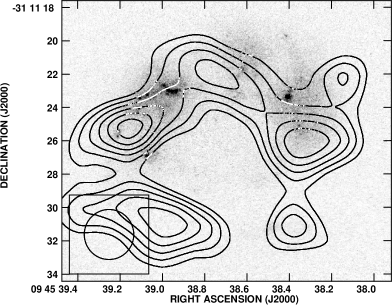 |
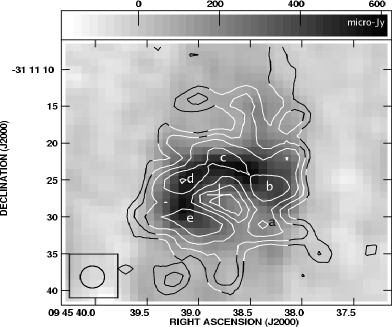
| Fig.5 left: Contour levels are at 0.24, 0.4, 0.56, 0.72, 0.88, 1.04, 1.2, 1.36 , the peak brightness is 1.39 | Fig.5 right: Contour levels are at 0.72, 0.84, 0.96, 1.07, 1.2, 1.32 , the peak brightness is 1.39 |
We detect a strong nuclear source in NGC 2997 at all the wavebands which is
resolved into a circumnuclear starforming ring in our high resolution
1272 MHz image. NGC 2997 is an intermediate type SAB(rs)c galaxy with
several hotspots. The circumnuclear star forming ring has been observed
in the optical and NIR (Maoz et al., 1996; Elmegreen et al., 1999).
Circumnuclear rings are observed in 20 per cent of all spiral galaxies
and mostly occur in barred galaxies (Knapen, 2005). Observational studies (Allard et al., 2005; Böker et al., 2008)
show that the circumnuclear ring can arise due to the bar driven radial inflow of
magnetized gas materials which gets accumulated in a ring near the location of inner
Lindbland resonances. There are two models which explain the star formation
in circumnuclear rings : (i) in the gravitational instability or “popcorn” (Elmegreen, 1994; Böker et al., 2008) model,
star formation is driven by stochastic gravitational fragmentation
along the ring where the star forming regions have a regularly spaced distribution (Elmegreen et al., 1999).
(ii) in the “pearls on a string” model, the gas along the bar that
flows into the ring is compressed near the contact points. Star formation is then
triggered in these over density contact regions. Observationally an age gradient
in the star forming regions is seen along either half of the ring (Allard et al., 2005; Böker et al., 2008).
We made a high resolution image at 1.27 using robust
weighting of in the task IMAGR. The resulting angular resolution of 3 arcsec
( 200 pc) resolved the circumnuclear ring (see Fig.5)
into five star-forming clumps i.e. hotspots. We measured the position, peak intensity
and integrated flux-density of each hotspot by fitting a Gaussian using the task JMFIT in AIPS.
The position for each component is listed using seconds of RA and arcsec of DEC in Table
8. The observed luminosity for the individual hotspot is between
0.16 to 1.58
at cm band with a pc resolution.
We also calibrated and imaged VLA archival data of this galaxy at
4.8 . The resulting image shown as grey scale in Fig.5
(left) also detects the circumnuclear ring coincident with the 1.27 ring.
Fig.5 (right) shows the 1.27 radio contour map
overlaid on HST V band gray-scale image (Maoz et al., 1996). The
radio ring is coincident but more extensive than the observed structure of the
ring in the V band. This is likely to be due to the lower angular resolution at
radio wavelengths and partly probably due to extinction at optical wavelengths which
Elmegreen et al. (1999) estimate to be about 3 magnitudes in the vicinity of the ring. The
morphological structure of the circumnuclear region in our 1.27 radio
contour map is similar to the contour maps of relative intensities in U
band published by Meaburn & Terrett (1982) using the SAAO 1.9-m reflector.
Our radio contour map and the gray-scale images in the UV ()
and radio (4.8 ) band shown in Fig.5 indicate that
there is no detectable radio continuum emission from the central part of the nucleus,
confirming that there is no radio-loud AGN in the center of this galaxy.
Maoz et al. (1996) observed circumnuclear rings in five barred or weakly barred spiral galaxies
of type Sc (including NGC 2997) and none of the rings hosted an AGN at its centre.
The quiescent phase of the nucleus was also noted in the detailed study of the NGC 2997
nucleus by Walsh et al. (1986).
A large number of hotspots are observed on a complete circumnuclear ring
of NGC 2997 at NIR (Elmegreen et al., 1999) whereas only three northern star-forming regions
are visible in the V band image. We note that the
intense NIR hotspots located in the northern part of the ring correlate with
the radio hotspots. Weak radio emission is detected from the southern parts
of the ring although hotspots are not distinguishable. The faint emission along
the southern half of the ring is seen in UV (Maoz et al., 1996), U (Meaburn & Terrett, 1982)
band image. Faint southern hotspots are also seen in NIR ring which
Elmegreen et al. (1999) attribute to the heavy dust extinction since the southern hotspots are being
observed through the dust lanes. A slight offset between the optical and radio positions
of the hotspots are observed. This could be attributed to the poor angular resolution
of the radio data ( arcsec) as compared to the excellent
resolution of the optical data ( arcsec) and dust
extinction near the star forming peaks.
The circumnuclear ring that we detect in radio has a deconvolved diameter
of arcsec i.e. pc. The separation between the hotspots ranges from to pc.
This is comparable to the NIR where the diameter of the ring is pc (8.7 arcsec)
and the spacings between hotspots is pc (Elmegreen et al., 1999).
This is typical of the circumnuclear rings detected in other galaxies.
The average size of the nucleus from the photometric and morphological analysis of
the galaxies with peculiar nuclei is quoted to be less than pc (Pastoriza, 1975).
We compared the circumnuclear ring (CNR) in NGC 2997
to the well studied CNR in NGC 1097 (Walsh et al., 1986; Barth et al., 1995; Beck et al., 1999; Sandstrom et al., 2010). The CNR of NGC 1097
has kpc diameter (Beck et al., 2005) and a LINER/Seyfert 1 AGN at its centre.
Three prominent radio hotspots are seen at cm in NGC 1097 (Beck et al., 2005) whereas
four bright and one faint hotspots are observed in NGC 2997 at cm (see Fig.5).
No azimuthal age gradient is seen in massive stars of both the rings with ages less
than to yrs (Maoz et al., 1996; Elmegreen et al., 1999; Sandstrom et al., 2010) and both rings show regular distribution
of hotspots (Barth et al., 1995; Elmegreen et al., 1999; Beck et al., 2005) which lends support to the gravitational instability model (Elmegreen, 1994)
for the star formation in the CNR. The CNR in NGC 1097 is formed due to the gas driven by bar potential.
Various observational studies show that NGC 2997 does not possess either a prominent
large scale bar or an active nucleus (Walsh et al., 1986; Maoz et al., 1996), hence unlike NGC 1097 gas accumulation
in the CNR of NGC 2997 is unclear.
However, Fast Magnetohydrodynamic Density Waves (FMDWs) at the modified inner Lindbland resonance
(mILR) model (Lou et al., 2002; Lou, 2003) can explain the formation of CNR in NGC 2997.
We estimate an equipartition field in the central nuclear region
of diameter pc to be about G. This is similar to the field
strength of G estimated by Han et al. (1999) for the central region of NGC 2997
and G estimated for the CNR in NGC 1097 by Beck et al. (1999). The equipartion
field for the radio hotspots in NGC 2997 ranges from to G.
We estimate a disc field of G for NGC 2997.
| Hotspot | Position (J2000) | Deconvolved angular | Peak Intensity | Integrated | Radio luminosity |
|---|---|---|---|---|---|
| RA (sec), DEC (arcsec) | size (arcsec2 PA) | () | flux density () | () | |
| a | 38.37,31.01 | 1.7 1.3 @167∘ | 0.61 | 0.77 | 0.16 |
| b | 38.32,25.77 | 7.5 5.0 @ 88∘ | 1.34 | 7.0 | 1.52 |
| c | 38.78,22.31 | 12.5 4.0 @ 76∘ | 0.77 | 5.0 | 1.17 |
| d | 39.12,25.00 | 7.7 2.1 @122∘ | 0.96 | 3.27 | 0.7 |
| e | 39.02,30.86 | 9.4 4.0 @71 ∘ | 1.34 | 7.36 | 1.58 |
We compared the luminosity of radio hotspots in circumnuclear region
of NGC 2997 with the circumnuclear radio hotspots in other galaxies such as NGC 253, 1365 and
1808. NGC 253 is a nearby ( Mpc) starburst galaxy, in which Ulvestad (2000) detected
22 compact circumnuclear sources at cm with pc resolution. The detected
circumnuclear sources of NGC 253 have typical radio power of .
Stevens et al. (1999) detected seven hotspots in the circumnuclear region of NGC 1365 at 3 and cm
with a pc resolution ( Mpc). The luminosity of circumnuclear hotspots
for NGC 1365 at cm (derived using a SI from 6 and cm) ranges from
. Similarly, Collison et al. (1994) detected hotspots
in NGC 1808 with a resolution of pc. The luminosity of circumnuclear hotspots in NGC 1808
( Mpc) at cm (derived using a SI between 6 and cm) ranges
from .
Thus, the average luminosity of hotspots in a CNR observed with pc
resolution appears to be to a few times
at cm. It is likely that the hotspots are composed of several
clumps as seen in NGC in addition
to diffuse non-thermal emission. Assuming that the observed emission at 1.27
from the circumnuclear hotspots is mostly non-thermal in nature, we derived the SN
rate based on Condon & Yin (1990) equation. The median SN rate value for the discrete
components in NGC 2997 ring is yr-1. The median value of
average formation rate of stars (SFR() M⊙ yr-1)
estimated for the hotspots is M⊙ yr-1.
The spectral index of the CNR in NGC 2997
is . We could not estimate the
spectral index of the individual hotspots since these were not clearly
discernible in the convolved 4.8 GHz map (see Fig.5).
NGC 6951, unlike NGC 2997, hosts a central AGN and has a marginally
larger diameter ( kpc) of the CNR but both the rings show hotspots
which form an almost complete ring. In NGC 2997, the radio ring is fainter
to the south whereas in NGC 6951 the ring appears to be broken
in the north
and south (Saikia et al., 2002). The spectral index of the circumnuclear emission
in NGC 6951 between 20 and cm was found to be (Ho & Ulvestad , 2001).
The radio spectrum of the hotspots in the CNR of other galaxies
exhibit a large range in spectral index. For example, the
CNR in NGC 613 has a spectral index of -0.65 between 2 and cm
(Hummel & Jörsäter, 1992) similar to NGC 2997, whereas the spectral index of
the individual compact sources (total 19) in the CNR of NGC 4736
exhibit spectral index ranging from 0.1 to between and cm (Duric & Dittmar, 1988).
Similar kind of distribution is also noted in the CNR of NGC 1365 between and cm
by Stevens et al. (1999). Out of seven hotspots detected in the ring of NGC 1365,
four hotspots show steep spectrum and rest show flat spectrum with
the spectral index ranging from 0.04 to (Stevens et al., 1999). Stevens et al. (1999) attribute
synchrotron emission from hotspots to electrons accelerated by SN
and SNRs. The spectral indices of circumnuclear hotspots detected between
and cm in NGC 1808 (Collison et al., 1994) are also consistent with them being dominated by SNRs.
Utilizing a V band HST exposure of NGC 2997, Maoz et al. (1996) determined
the numerous compact (few pc radius) sources distributed along the ring that are
probably young (less than yr) and massive ( M⊙) clusters of
stars that are gravitationally bound.
5 Summary
We have presented high resolution radio continuum maps of NGC 2997 at 332, 616 and
1272 . To the best of our knowledge these are the first images of the galaxy
at . The radio continuum features detected in our observation
bands are described, in detail, along with the spectral index values. The best-fitting
single power law model to the integrated radio spectrum of NGC 2997 gives a spectral
index . The best-fitting value of obtained
using only the low-frequency GMRT data suggests a break in the spectrum at
. We put an upper limit of 10 per cent on the thermal fraction
at .
The spectral power of NGC 2997 at our observing frequencies is in
the range of 7.9 to 24.4. The derived logarithmic
measure of FIR/radio flux density ratio, parameter is ,
which is near the median for spiral galaxies at 1.4 , (Condon, 1992).
The estimated values for average star formation rate SFR()
is 1.9 M⊙ yr-1, the supernovae rate is 0.08 ,
and the production rate of the Lyman continuum photons is .
The resultant logarithmic measure of FIR/radio flux density ratio and the intermediate
average star formation rate confirms that NGC 2997 is a normal galaxy.
The low frequency spectral index distribution map ()
of NGC 2997 shows that the radio spectrum is flatter in nature near brightness
peaks such as in intense spiral arm regions and nucleus, whereas radio emission
from the low surface brightness regions shows a steeper spectrum. The measured
spectral index for the nucleus between 332 and 1272 is .
The radio continuum map at 1272 with an angular resolution
of 3 arcsec ( pc) reveals a circumnuclear ring structure with five radio
hotspots. No radio continuum emission at the centre of the galaxy is detected
indicating that there is no radio-loud AGN. Part of the ring to the south is faint.
The circumnuclear ring is similar to that observed at other wavebands from the galaxy
and in other galaxies. It has a deconvolved diameter of pc and the
separation between hotspots range from to pc. We estimate an
equipartition field in the central nuclear region of diameter pc
to be about G. The observed luminosity for the individual hotspot
is about . The median SN rate and average formation
rate of stars SFR() for the hotspots in the ring are
and respectively.
Acknowledgments
We thank the staff of the GMRT who have made these observations possible. GMRT is run by the National Centre for Radio Astrophysics of the Tata Institute of Fundamental Research. We thank the anonymous referee for useful comments on the manuscript. J. Kodilkar thanks the Dean of the GMRT, Prof. Y. Gupta for his support. One of the authors (SA) wishes to thank R. Wielebinski for bringing to his notice the importance of low frequency observation of NGC 2997. This research has made use of the NASA/IPAC Extragalactic Database which is operated by the Jet Propulsion Laboratory, Caltech under contract with the NASA.
References
- Allard et al. (2005) Allard E.L., Peletier R.F., and Knapen J.H., 2005, ApJ, 633, L25
- Ananthakrishnan (2005) Ananthakrishnan S., 2005, Proc. 29th International Cosmic Ray conference, Pune, 10, 125
- Barth et al. (1995) Barth A. J., Ho L. C., Filippenko A. V., and Sargent W. L., 1995, AJ, 110, 1009
- Beck et al. (1999) Beck R., Ehle M., Shoutenkov V., Shukurov A., and Sokoloff D., 1999, Nature, 397, 324
- Beck et al. (2005) Beck R., Ehle M., Fletcher A., Harnett J., Shoutenkov V., Shukurov A., and Sokoloff D., 2005, AIP Conf. Proc., 783, 216
- Böker et al. (2008) Böker T., Falcón-Barroso J., Schinnerer E., Knapen, J. H., and Ryder S., 2008, AJ, 135, 479
- Caswell & Lerche (1979) Caswell J.L. and Lerche I., 1979, MNRAS, 187, 201
- Collison et al. (1994) Collison P.M., Saikia D.J., Pedlar A., Axon D.J., and Unger S.W., 1994, MNRAS, 268, 203
- Condon (1987) Condon J.J., 1987, A&AS, 65, 485
- Condon (1992) Condon J.J., 1992, A&AR, 30, 575
- Condon & Broderick (1988) Condon J.J. and Broderick J.J., 1988, AJ, 96, 30
- Condon & Yin (1990) Condon J.J. and Yin Q.F., 1990, ApJ, 357, 97
- Condon et al. (1998) Condon J.J., Cotton W. D., Greisen E. W., Yin Q. F., Perley R. A., Taylor G. B., and Broderick J. J., 1998, AJ, 115, 1693
- Condon et al. (1991b) Condon J.J., Frayer D. T., Broderick J. J., 1991b, AJ, 101, 362
- de Vaucouleurs et al. (1991) de Vaucouleurs G., de Vaucouleurs A., Corwin JR. H. G., Buta R. J., Paturel G., and Fouque P., 1991, Third Reference Catalogue of Bright Galaxies. Springer, New York
- Duric & Dittmar (1988) Duric N. and Dittmar M. R. 1988, ApJ, 332, L67
- Elmegreen (1994) Elmegreen, G. B., 1994, ApJ, 425, L73
- Elmegreen et al. (1999) Elmegreen D.M., Chromey F.R., Sawyer J.E., and Reinfeld E.L., 1999, AJ, 118, 777
- Fathi et al. (2006) Fathi K., Strorchi-Bergmann T., Riffel R.A., Wing C., Axon D.J., Robinson A., Capetti A., Marconi A., 2006, ApJ, 641,L25
- Firpo et al. (2005) Firpo V., Bosch G., Morrell N., 2005, MNRAS, 356, 1357
- Fitt et al. (1996) Fitt A.J.,Howarth N.A., Alexander P. and Lasendby, 1996, MNRAS, 255, 146
- Garcia (1993) Garcia A. M., 1993, VizieR Online Data Catalog, 410, 47
- Grosbøl et al. (2006) Grosbøl P., Dottori H., and Gredel R., 2006, A&A, 453, L25
- Güsten & Mezger (1982) Güsten R. and Mezger P.G., 1982, Vistas in Astronomy, 26, 159
- Han et al. (1999) Han J.L., Beck R., Ehle M., Hynes R.F., and Wielebinski R., 1999, A&A, 348, 405
- Helou et al. (1985) Helou G., Soifer B. T., Rowan-Robinson M., 1985, ApJ, 298, L7
- Ho & Ulvestad (2001) Ho, L. C. and Ulvestad, J. S., 2001, ApJs, 133, 77
- Hummel (1991) Hummel E., 1991, A&A, 251, 442
- Hummel & Jörsäter (1992) Hummel E. and Jörsäter S., 1992, A&A, 261, 85
- Israel & Mahoney (1990) Israel F.P. and Mahoney M.J., ApJ, 1990, 352, 30
- Knapen (2005) Knapen J.H., 2005, A&A, 429, 141
- Kennicutt (1983b) Kennicutt R., 1983b, A&A, 120, 219
- Koribalski et al. (2004) Koribalski B. S., Staveley-Smith L., Kilborn V.A. et al., 2004, AJ, 128, 16
- Lacki et al. (2010) Lacki B. C., Thompson T. A., Quataert E., 2010, ApJ, 717, 1
- Lou (2003) Lou Y.Q., 2003, ATCA Astronomica Sinca, 44, 172
- Lou et al. (2002) Lou Y.Q., Walsh W.M., Han J.L., and Fan Z., 2002, ApJ 567, 289
- Maoz et al. (1996) Maoz D., Barth A. J., Sternberg A., Filippenko A.V., Ho L. C., Macchetto F.D., Rix H.-W., Schneider D.P., 1996, AJ, 111, 2248
- Meaburn & Terrett (1982) Meaburn J. and Terrett D.L., 1982, MNRAS, 200, 1
- Men & Han (2005) Men H. and Han J. L., 2005, Chin. J. Astron. Astrophys., 5, 49
- Milliard & Marcelin (1981) Milliard B. and Marcelin M., 1981, A&A 95, 59
- Niklas et al. (1997) Niklas S., Klein U. and Wielebinski R., 1997, A&A 322, 19
- Pastoriza (1975) Pastoriza M. G., 1975, Ap&SS, 33, 173p
- Peterson (1978) Peterson C. J., 1978, ApJ, 226, 75
- Pohl, Schlickeiser, Hummel (1991) Pohl M., Schlickeiser R., and Hummel E., 1991, A&A, 250, 302
- Roy et al. (1998) Roy A.L., Norris R.P., Kesteven M.J., Troup E.R. and Reynolds J.E., 1998, MNRAS, 301, 1019
- Sandstrom et al. (2010) Sandstrom K.,Krause O., Linz H., Schinnerer E., Dumas G., Meidt S. et al., 2010 A&A 518, L59
- Saikia et al. (2002) Saikia D.J., Phookun B., Pedlar A., and Kohno K., 2002, A&A, 383, 98
- Stevens et al. (1999) Stevens I.R., Forbes D.A., and Norris R.P., 1999, MNRAS, 306, 479
- Swarup et al. (1991) Swarup G., Ananthakrishnan S., Kapahi V.K., Rao A.P., Subrahmanya C.R., and Kulkarni V.K., 1991, Current Science, 60, 95
- Tabatabaei et al. (2007b) Tabatabaei F.S., Beck R., Krügel, Krause M., Berkhuijsen E.M., Gordon K.D., and Menten K.M., 2007b, A&A, 475, 133
- Tammann (1982) Tammann G. A., 1982, In Supernovae: A Survey of Current Research, ed. Rees M.J., Stoneham R.J., 371
- Trushkin (1999) Trushkin S. A., 1999, Odessa Astronomical publications, 12, 144
- Tully (1988) Tully R.B., 1988, Nearby Galaxies Catalog, Cambridge University Press, Cambridge
- Ulvestad (2000) Ulvestad J.S., 2000, AJ, 120, 278
- Walsh et al. (1986) Walsh J.R., Nandy K., Thompson G.I., Meaburn J., 1986, MNRAS, 220, 453
- Whiteoak (1970) Whiteoak J.B., 1970, ApL, 5, 29W
- Wright et al. (1996) Wright A. E., Griffith M. R., Hunt A. J., Troup E., Burke B. F., and Ekers R. D., 1996, ApJS, 103, 145W