Characterization and Improvement of the Image Quality of the Data Taken with the Infrared Camera (IRC) Mid-Infrared Channels onboard AKARI
Abstract
Mid-infrared images frequently suffer artifacts and extended point spread functions (PSFs). We investigate the characteristics of the artifacts and the PSFs in images obtained with the Infrared Camera (IRC) onboard AKARI at four mid-infrared bands of the S7 (7 m), S11 (11 m), L15 (15 m), and L24 (24 m). Removal of the artifacts significantly improves the reliability of the reference data for flat-fielding at the L15 and L24 bands. A set of models of the IRC PSFs is also constructed from on-orbit data. These PSFs have extended components that come from diffraction and scattering within the detector arrays. We estimate the aperture correction factors for point sources and the surface brightness correction factors for diffuse sources. We conclude that the surface brightness correction factors range from 0.95 to 0.8, taking account of the extended component of the PSFs. To correct for the extended PSF effects for the study of faint structures, we also develop an image reconstruction method, which consists of the deconvolution with the PSF and the convolution with an appropriate Gaussian. The appropriate removal of the artifacts, improved flat-fielding, and image reconstruction with the extended PSFs enable us to investigate detailed structures of extended sources in IRC mid-infrared images.
1 Introduction
Mid-infrared multiband imaging data offer a useful tool to study dusty stellar objects (e.g., Meixner 2008; Ita et al. 2008) as well as the interstellar medium (e.g., Bernard et al. 2008; Onaka et al. 2010). However, mid-infrared observations frequently suffer from various instrumental effects, such as the anomalies in the detector performance (Pipher et al., 2004), the extended point spread functions (PSFs) due to the diffraction of light (Jarrett, 2006), and artifacts. The corrections for these annoying effects should become crucial particularly when we are interested in the faint diffuse objects adjacent to bright objects. In this Paper we report detailed investigations on the qualities of the mid-infrared imaging data taken with the Infrared Camera on board Japanese AKARI satellite to evaluate their artifacts and to offer useful information needed for the advanced data reduction procedures to users of the AKARI mid-infrared data, which are now publically available from the data archive server.
The infrared satellite AKARI carried out about 5000 pointed observations in addition to the all sky survey at the mid- to far-infrared bands during its cold phase (until 2008 Aug 24) (Murakami et al., 2007). The Infrared Camera (IRC: Onaka et al. 2007) on board AKARI made near- to mid-infrared (2–26 m) imaging as well as spectroscopic observations in the pointed observation mode. The IRC has three channels: NIR, MIR-S and MIR-L, which cover the spectral ranges 1.8–5.5 m, 4.6–13.4 m, and 12.6–26.5 m, respectively. Each channel has a field-of-view of about and is equipped with three medium-band filters for imaging observations (see Onaka et al. 2007 for details).
When a bright object comes into the field-of-view, several artifacts, often termed as ”ghosts” (e.g. Lorente et al. 2008), appear in MIR images of S7 (7 m), S11 (11 m), L15 (15 m), and L24 (24 m) bands due to reflections among the optical elements (Lorente et al., 2008). The scattering of light internal to the Si:As detector arrays of the AKARI also spreads out the signals from the object over the entire array. This scattering together with the diffraction produces very extended components in the PSFs. It is not straightforward to separate artifacts from the PSF unambiguously. In this Paper, we define artifacts as components that move differently from the real object in the image or those showing very distinct, asymmetric patterns (§ 2.1). In our definition, anomalies of the detector array and the effects of diffraction are included in the PSF. We present high dynamic range (HDR) PSFs, aperture correction factors, and surface brightness correction factors for diffuse sources at S7, S11, L15, and L24 bands (§ 2.2). The obtained HDR PSFs are useful in the process of image reconstruction (see § 3), which enable us not just to carry out an accurate photometry of point sources but also to get much improved information on the structures and surface brightness of diffuse extended sources. We also obtain the revised reference data for flat-fielding (hereafter flat data) for L15 and L24 that free from the effects of the artifacts (see § 2.3).
Among the information obtained in this study, the information commonly used in the process of data reduction (e.g., new flat dataset for L15 and L24) is included in the latest update of the imaging toolkit ver. 20110225. On the other hands, further advanced data reduction procedures, beyond the treatments made with the standard pipeline, may be necessary for the data of relatively faint extended sources and for those affected by artifacts due to an inclusion of bright objects in the FOV. This paper aims to provide the information needed in the course of such advanced data reduction procedures to the general users of the AKARI MIR datasets and to demonstrate the method of imaging reconstruction and its application to the AKARI MIR data of M81 to exemplify the usage of information newly given in this paper.
2 Detailed examination on the image qualities of AKARI/IRC data
2.1 Artifacts in IRC images
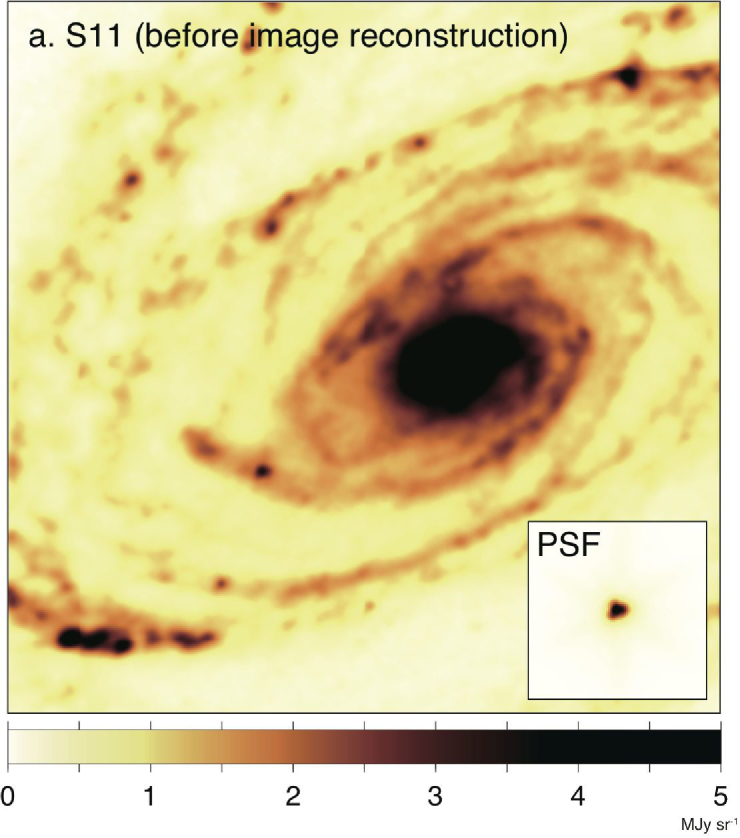
2.1.1 MIR-S artifacts
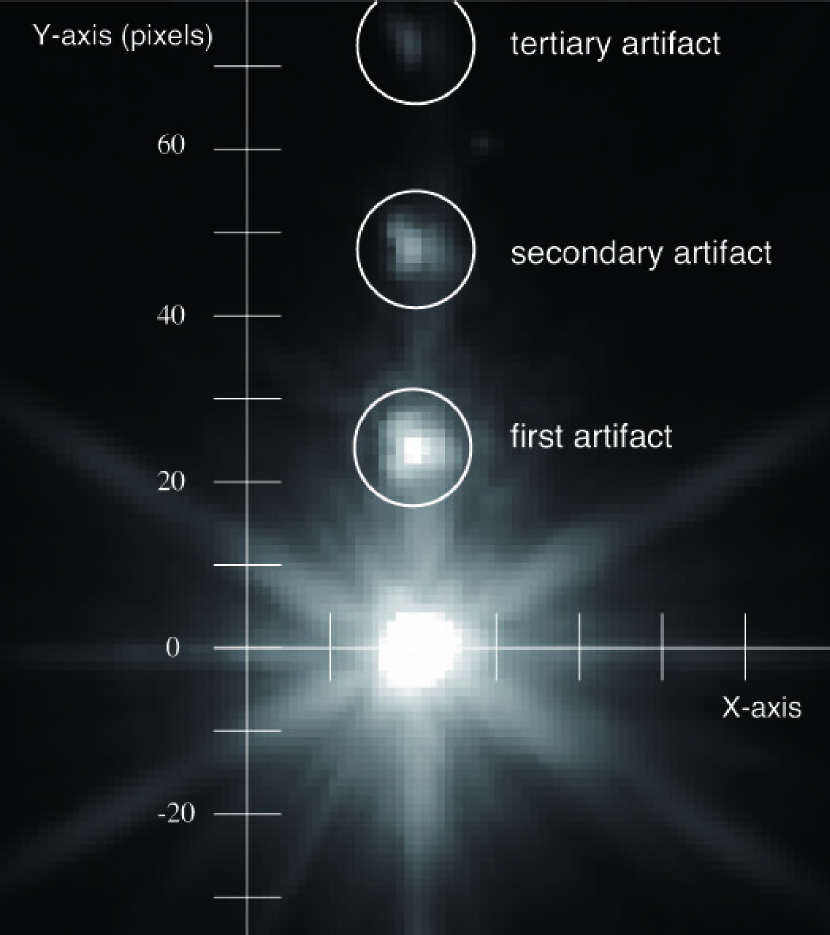
In the MIR-S channel, a point-like artifact appears with an interval of about 24 pixels from the corresponding real point source in the scan direction (hereafter, defined as the Y-axis), which is attributed to internal reflections in the beam splitter since it does not split the light perfectly (Figure 1). We employ archival data of CRL618 and Red Rectangle Nebula of Open Time Programs as a calibration source for the artifact, which are listed in Table 1. The outskirts of the PSF are fairly symmetric about the central source and the artifact shows a distinct, point-like pattern. Using this characteristic, we derive the artifact patterns at the S7 and S11 bands by subtracting the signals 24 pixels away from the real source in the opposite side from the image as the background. No significant difference is noticed in the spatial pattern of the artifact between the two objects.
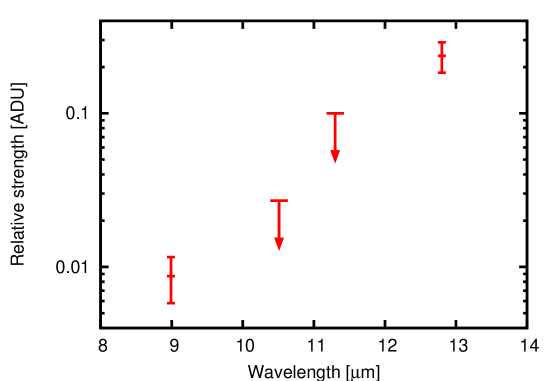
Despite the consistency in the spatial pattern of the artifact, the ratio of the intensity of the artifact to that of the original object varies among objects. Since the degree of imperfection varies with wavelength, the intensity of the artifacts can have strong spectral dependence (cf. Okumura 2003). We investigate the wavelength dependence of the artifact by using spectroscopic datasets. The IRC has a narrow slit (Ns) for spectroscopy of diffuse emission (Onaka et al., 2007; Ohyama et al., 2007). The dispersion direction is along the Y-axis and the artifact of an emission line appears at a different wavelength. Three datasets of spectroscopic observations of two Galactic H II regions and a planetary nebula are employed to investigate the spectral dependence (see Table 1). We use the lines of [Ar III] 8.99 m, [S IV] 10.51 m, [Ne II] 12.81 m, and the unidentified infrared (UIR) band at 11.3 m. The relative intensity of the artifact varies with the wavelength of the incident photon from 1 % to 4.5 % for 9 to 13 m (see Figure 2). The tendency of the wavelength dependence is roughly consistent with the wavelength dependence of transmission of the beam splitter (Figure 5 of Onaka et al. 2007). Because of this characteristic, the intensity of the artifact depends on the spectrum of the object and cannot be estimated straightforwardly. In practice, the estimate of the intensity of this artifact has to be made interactively. Examples of the relative intensity of the artifacts for various objects are given in Table LABEL:aa. The contributions of the artifacts to the total input signals are measured to be less than 1 % at S7 and about 1-3 % at S11, the latter of which is consistent with the values obtained from the spectroscopic data.
2.1.2 MIR-L artifacts
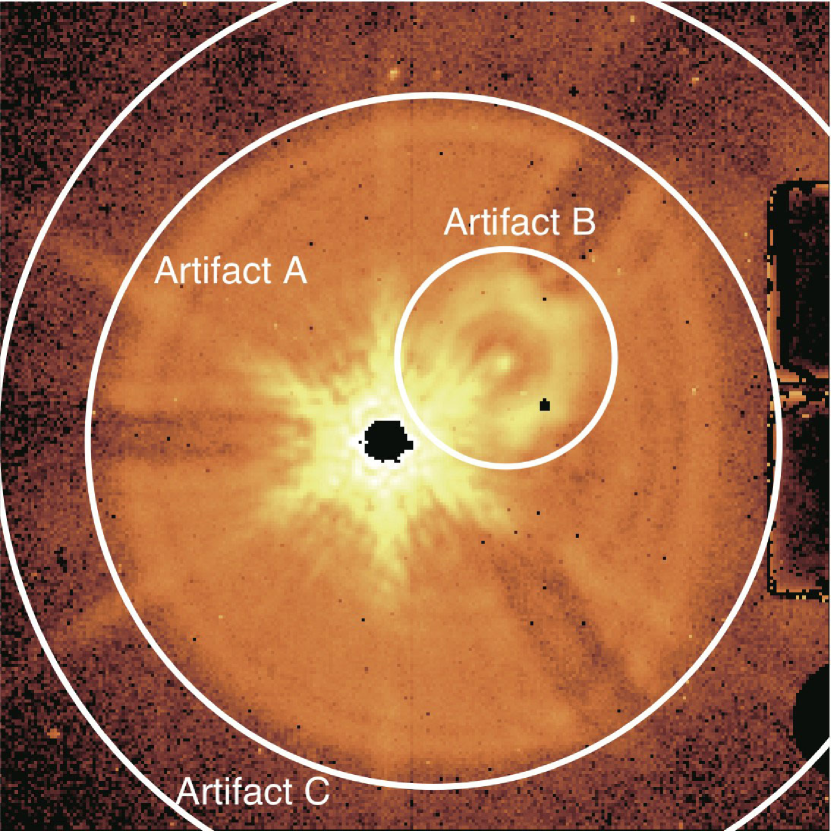
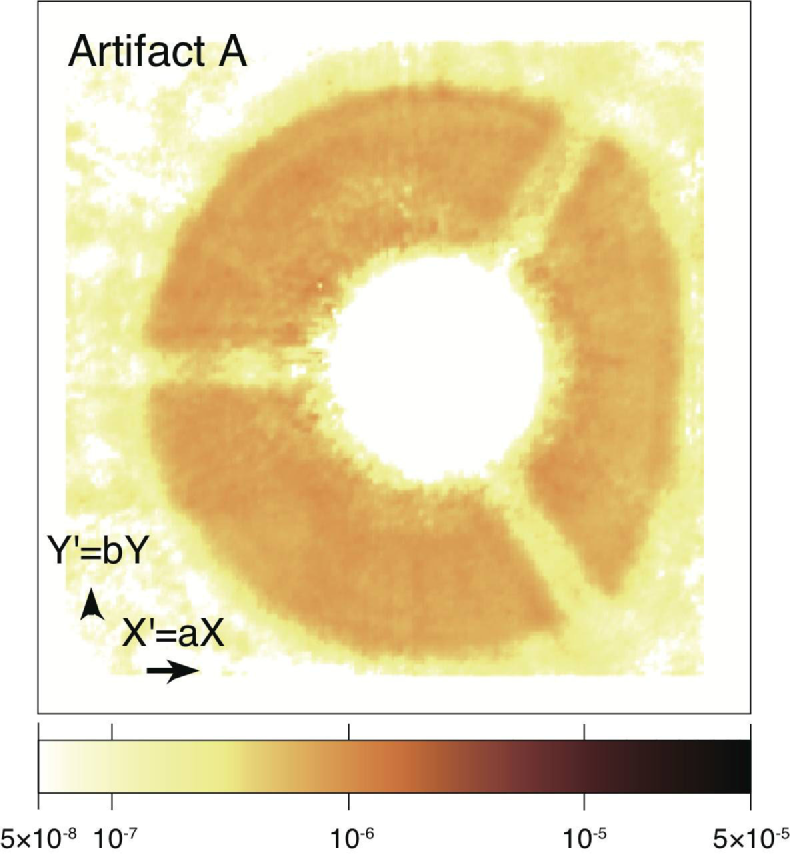
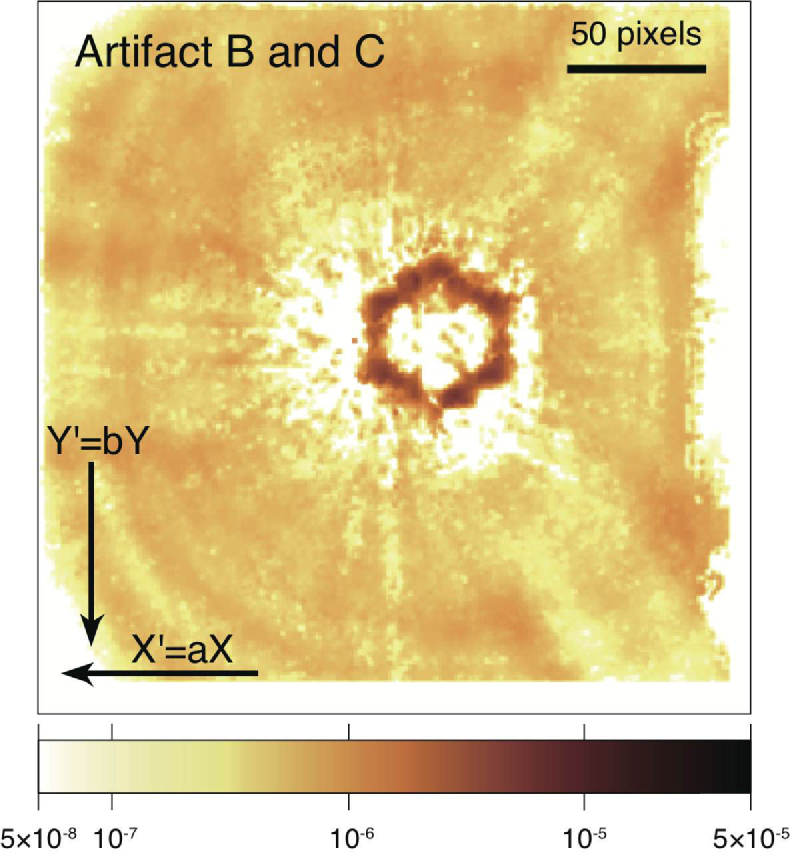
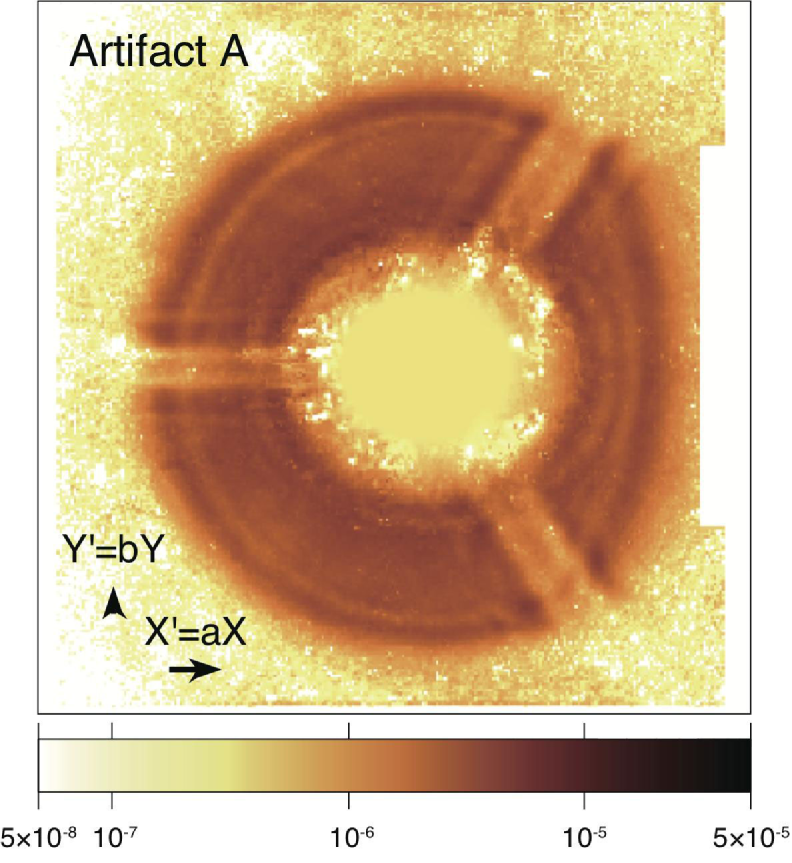
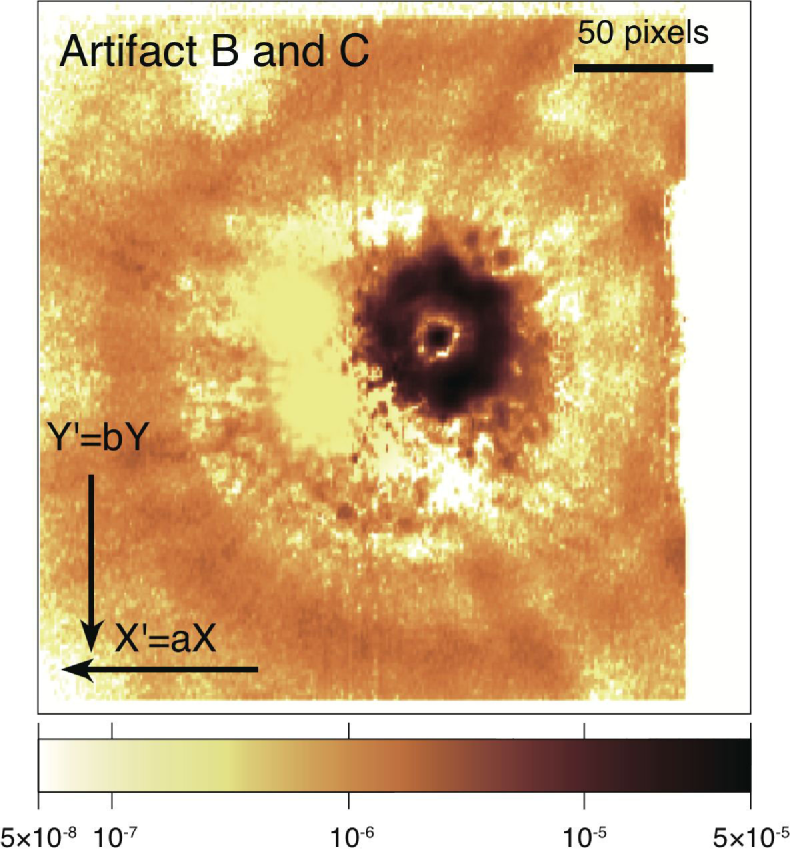
MIR-L images are severely affected by artifacts originating in reflections among the optical elements and the surface of the detector array because of the imperfect AR coating. There are at least three types of artifacts (A,B and C) overlapped with the extended PSF (§4) in MIR-L images (Figure 3), one relatively compact (artifact B) and the others quite extended (artifacts A and C). The optical path of each artifact is identified by ray-tracing calculations. Their major paths are the reflection between the surface of the detector array and the KRS-5 lenses, whose AR coating is not perfect particularly at the longer wavelength edge of the spectral range of the MIR-L. Thus the artifacts appear more strongly at L24 than at L15. The artifact images from a point source are not focused onto a point, but appear as a diffuse pattern. We examine the properties of these artifacts and derive the surface brightnesses and the positions relative to the original object using the on-orbit data listed in Table 1. Artifacts A and C, and the PSFs (see § 2.2.1) are very extended and the subtraction of the background sky needs to be made with high accuracy. There is no appropriate position for the estimate of the background sky in the image, and we use the data taken at a near sky position that do not have bright objects in their field-of-view as the sky background.
During an pointed observation carried out with AOT IRC02 (Onaka et al., 2007), a dithering operation was carried out to settle the target at three different positions on the detector array. Using these dithered data, the movement of the artifacts is estimated by a least-square fit for the region where each component of the artifacts does not overlap with each other. The relative movement of each artifact is assumed to be proportional to the movement of the original object. Thus the relative movement of the reference position of each artifact from the origin is given by the position of the incident object as
| (1) |
where and are the fitting parameters. We set the origin as the center of the array, . The artifact patterns do not change with the position of the object in the field-of-view and thus the reference position is defined as a position near the center of the artifact. For real objects and their PSFs in the image, and should be unity, but these are not for the artifacts. By the difference in the relative movement, the artifacts can be separated from the PSF pattern. The derived fitting parameters are listed in Table 3.
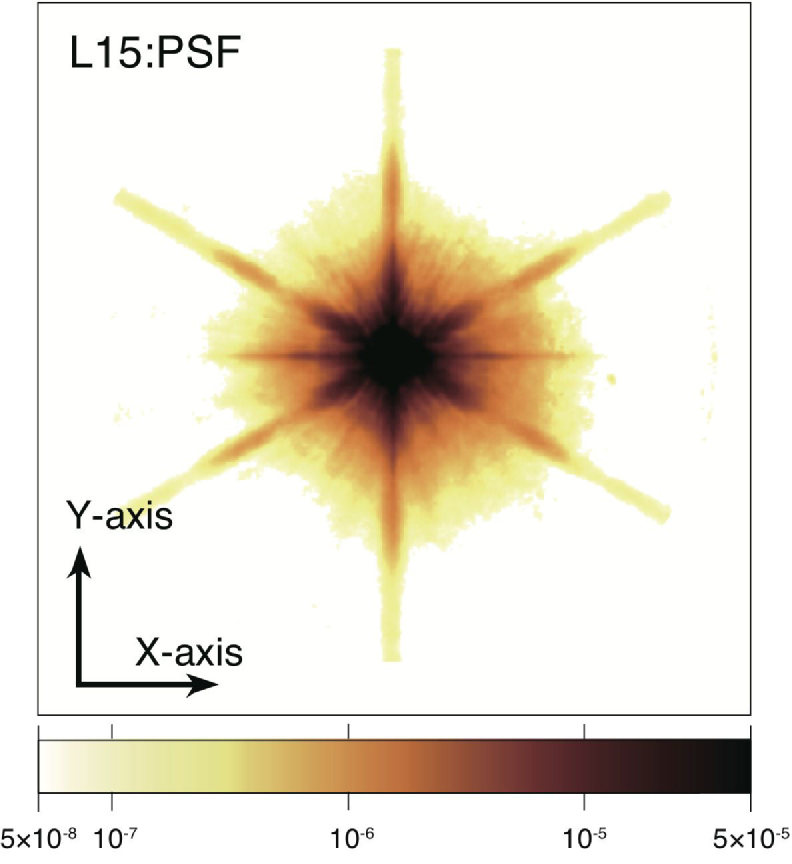
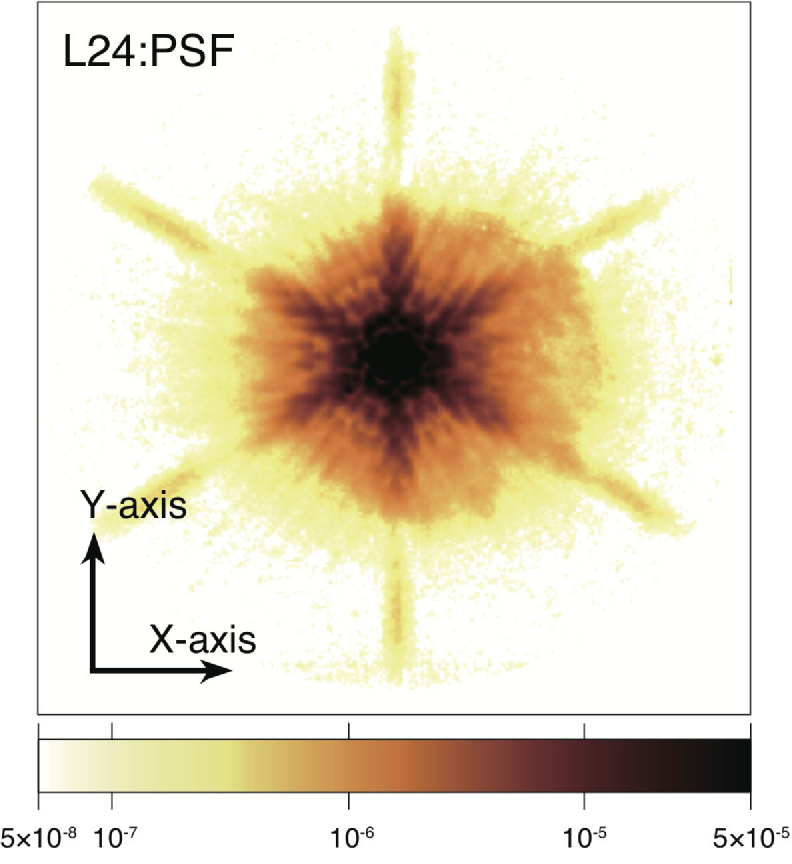
The artifacts on L15 images are too faint to derive reliable position movements, and the fit is made only for L24 images. We assume the same values of and for L15 as derived for L24 since the positions are determined by internal reflections and the spectral dependence is thought to be negligible. The parameters and for artifact A are both positive and thus artifact A moves in the same direction as the real object. Artifacts B and C move, on the other hand, in the opposite direction relative to the real object with the same amount on the image. Taking account of the difference in the movement on the image, we determine the patterns of artifacts A, B, and C, and the PSFs both at L15 and L24 (Figures 4 and 5). The spider patterns and the banding structures from the detectors are included in the PSFs (see Figure 11). Because they move with the same amount in the same direction, artifacts B and C cannot be separated uniquely from the relative movement. The relative intensities between these two artifacts, however, vary between L15 and L24 (see Table 4). Each artifact image is shifted and stacked by median average, excluding the maximum value to remove the other artifacts from the output image. Artifact A in the L15 image is very diffuse and fully overlaps with the extended component of the PSF, which makes it difficult to extract. We assume the same pattern at L24 as for the low frequency ( pixels) of artifact A at L15. Artifact C is much fainter than artifact A at L24 and we assume the same pattern at L24 as at L15.
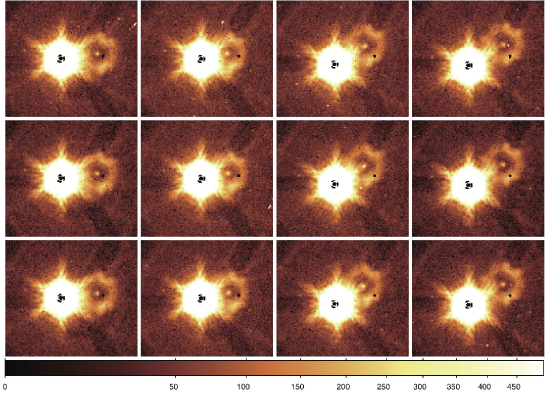
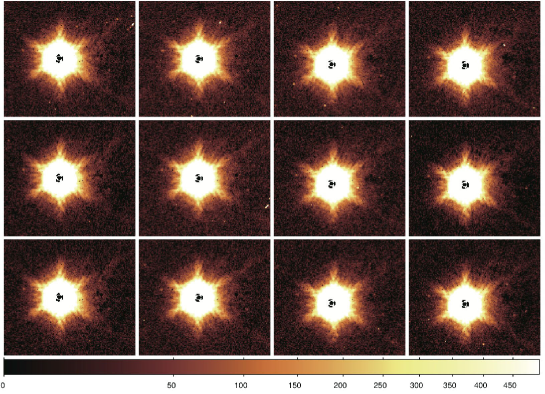
The characteristics of artifacts A, B, and C are summarized in Table 4. The total contributions of the artifacts to the input signals are 7.3 % and 16.1 % at L15 and L24, respectively. The spectral dependence of the intensity of the artifacts relative to the original object cannot be investigated with accuracy because of the lack of sufficient data. We assume fixed relative intensities of the artifacts as given in Table 4, where the artifact signals are normalized by the signal of the target point source within a radius of 7.5 pixels (see below). Among the MIR-L images we have investigated, the spectral dependence of the relative intensity of the artifacts is less than 15 %. Corrections for the artifacts have to be made for each dithered image since the artifacts move differently from real objects. Figures 7 and 7 show examples of the original images with the artifacts and those of the artifacts removed for the carbon star U Antliae at L24, respectively (pointing ID:1710071.1, Arimatsu et al. 2011). They show that the artifacts seen in Figure 7 are subtracted almost perfectly after the removal process (Figure 7), demonstrating the applicability of the artifact patterns at L15 and L24 derived in the present study.
2.2 Extended PSFs of IRC images
2.2.1 Extended PSFs
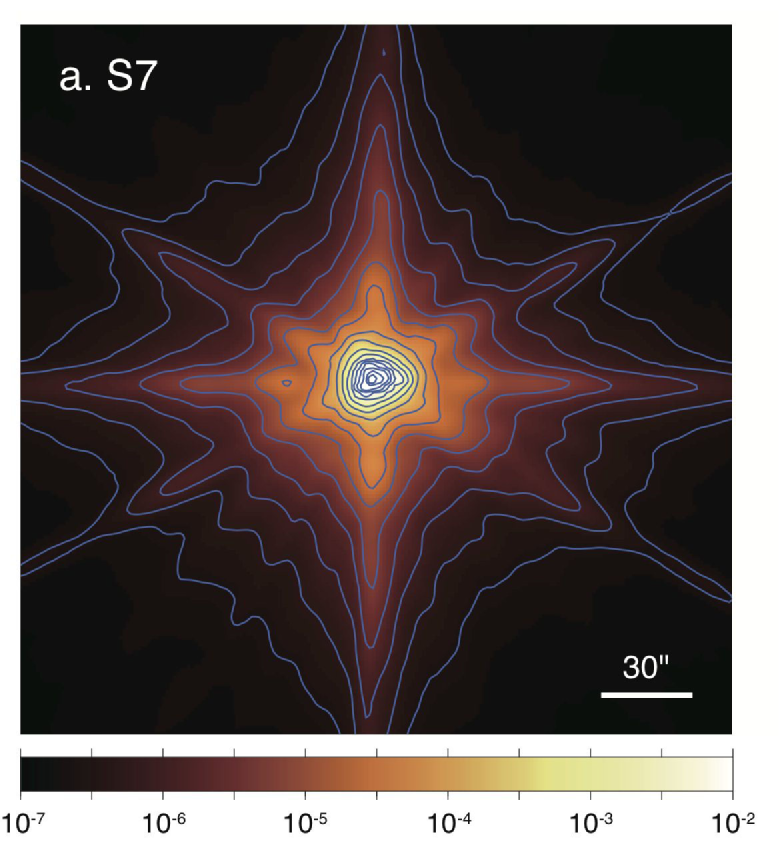
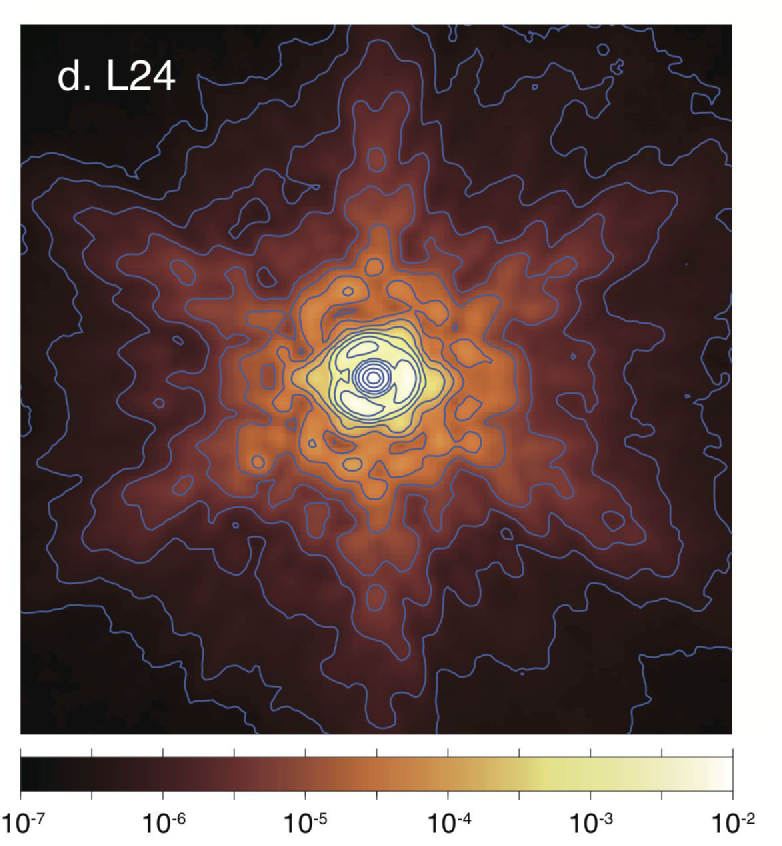
In general, the PSFs of mid-infrared instruments tend to be extended due to the diffraction and the scattering within the detector arrays (Hola et al., 2004). We determine the PSFs over the entire field-of-view of the four imaging bands (S7, S11, L15, L24) by subtracting the artifacts from calibration and science observations of stars. The observations used to determine the PSFs are listed in Table 1. To obtain HDR PSFs, we use targets with a wide range of brightness. We also employ short-exposure and long-exposure images, the latter of which was taken with 28 times longer exposure time than the former. Images after the artifact subtraction at each dithering position are shifted and combined with an accuracy of 0.1 pixels to produce a brightness map, and we determine the extended component of the PSFs down to of the total intensity. Figure 11 shows the PSFs, which indicates significant morphological differences among the imaging bands. Especially in the PSFs at S7 and L15, a banding structure along the cross-scan direction (hereafter, defined as the X-direction) is seen in addition to the structures produced by the secondary mirror spiders separated by 120 degrees. A similar banding pattern is seen in Spitzer/IRAC images, which is attributed to light scattering inside the detector (Pipher et al., 2004). The banding shows a strong spectral dependence and the morphological differences can be attributed partly to the internal reflections in the Si:As detector and/or to diffraction of light. Uniform offsets that appear under high incoming photon conditions (Pipher et al., 2004) are not recognized in the IRC PSF object images, when they are compared with the reference sky images (§ 2.1.2).
The full width of half maximums (FWHMs) of the obtained PSFs are listed in Table 5. The obtained values of the FWHMs are smaller than the published values (Table 2 of Onaka et al. 2007) at the short wavelength channels. The present values are consistent with the diffraction-limited performance at 7.3 m (Kaneda et al., 2007). The published values are derived from a number of stellar images and the averaging process could increase the FWHM. In another word, they provide ”average” FWHMs when the standard reduction toolkit is used. On the other hand, the PSFs in the present study are derived from the data that are carefully shifted and stacked. This process requires for the data with sufficient signal-to-noise ratios. When the present HDR PSF is applied to a standard processed image, the inner part of the new PSFs needs to be adjusted to the individual image, which might be degraded by a less accurate stacking process, while the outer part provides proper information on the extended component of the PSFs.
2.2.2 Aperture Corrections
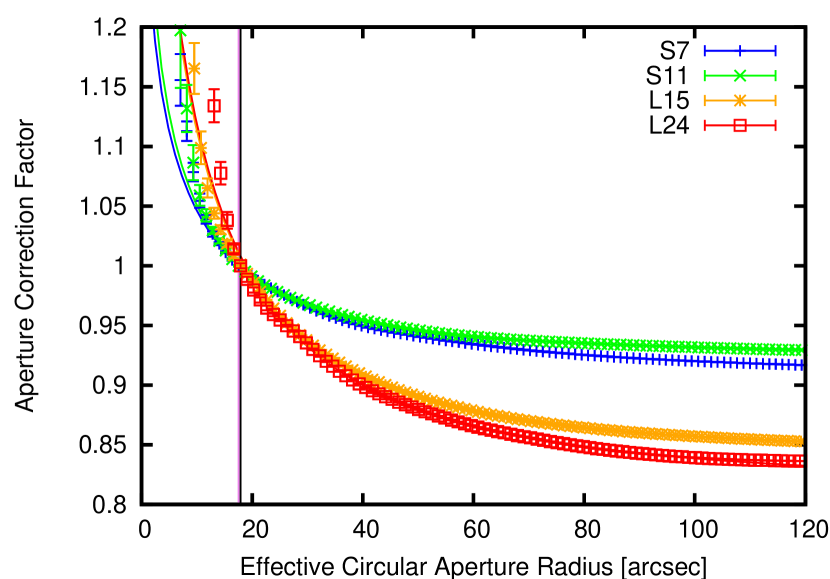
The extended component of the PSFs can be characterized quantitatively by the encircled energy. It is also useful for practical applications to calculate the aperture correction factor , which is defined as the reciprocal of the encircled energy normalized at a given radius. We set the reference radius as 7.5 pixels, with which the absolute calibration of the MIR-S and MIR-L data is carried out (Tanabé et al., 2008). This radius corresponds to 17″.55 for the MIR-S and 17″.88 for the MIR-L channel, respectively. According to Jarrett (2006), we approximate as a function of the radius from the center of the object as
| (2) |
where is in pixels, and , and are the fitting parameters. They are given in Table 6 and is plotted in Figure 12. Figure 12 indicates that equation (2) provides good fits for pixels.
The calibration for diffuse emission needs to take account of the fact that a large fraction of the incident photons spread over the detector array. The correction for diffuse emission can be given by equation (2) with . Thus parameter gives the correction factor for diffuse emission. As indicated in Table 6, the correction factor has spectral dependence. Scattering within the detector array is known to have strong spectral dependence, peaking in the 5–6 m region (Pipher et al., 2004). It explains part of the dependence in the MIR-S bands. For the MIR-L bands, diffraction of light is likely to make a significant contribution.
2.3 Revised Flat Frames for MIR-L images
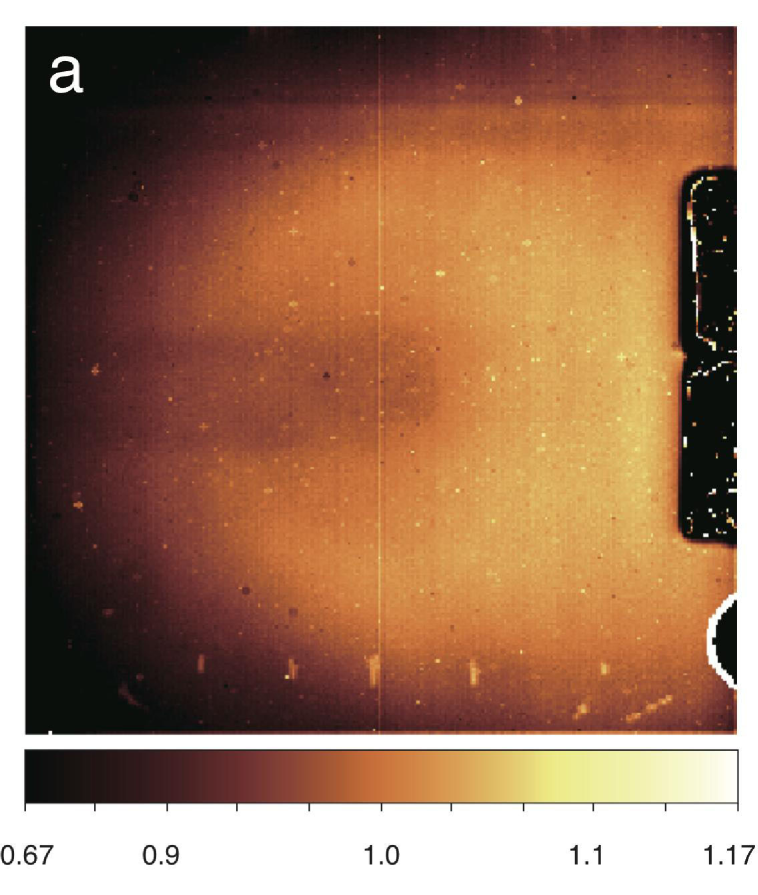
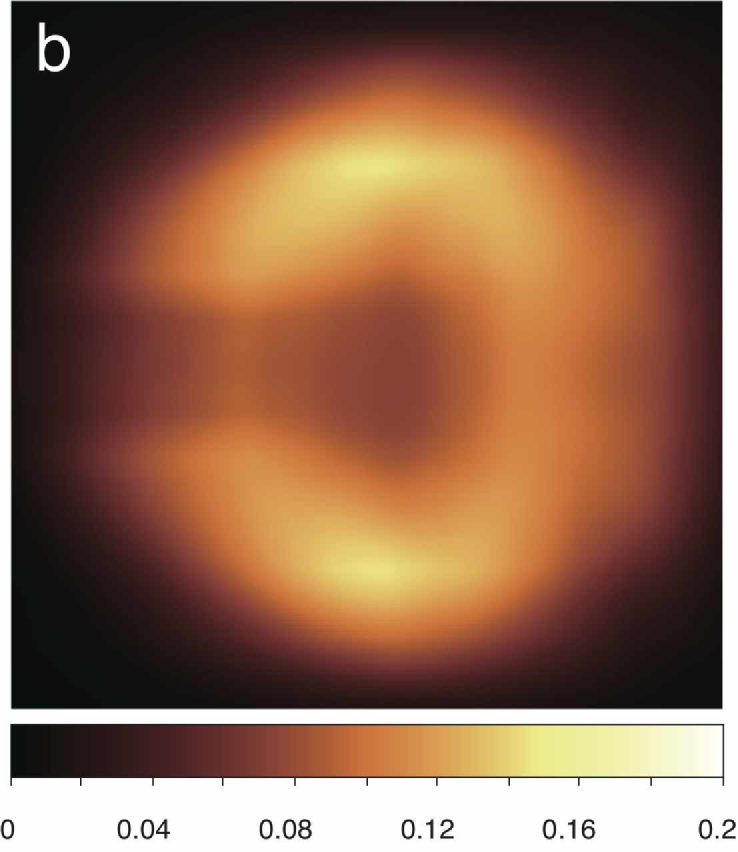
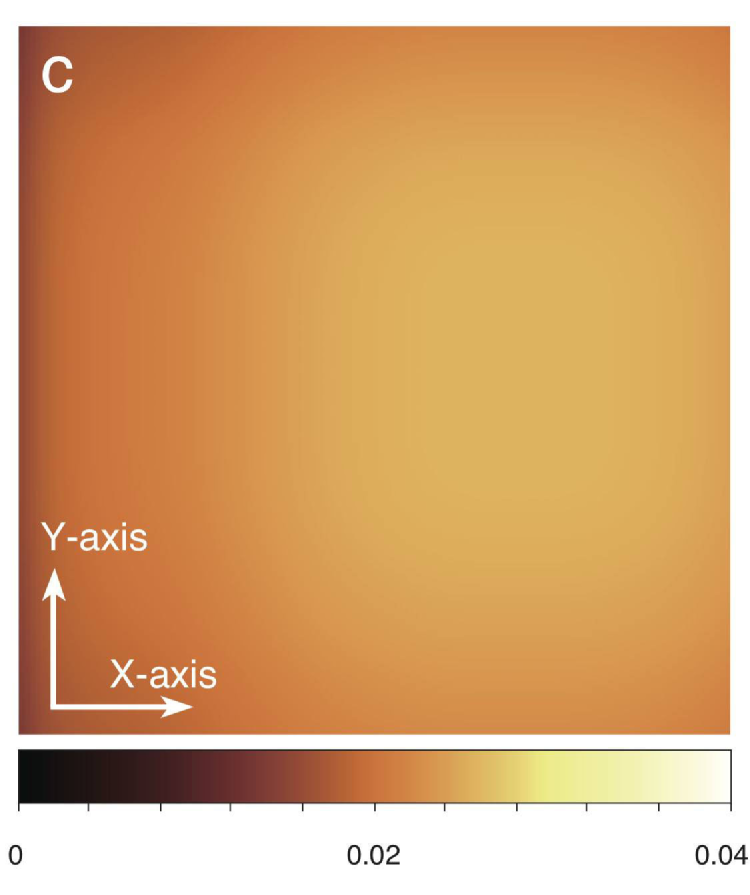
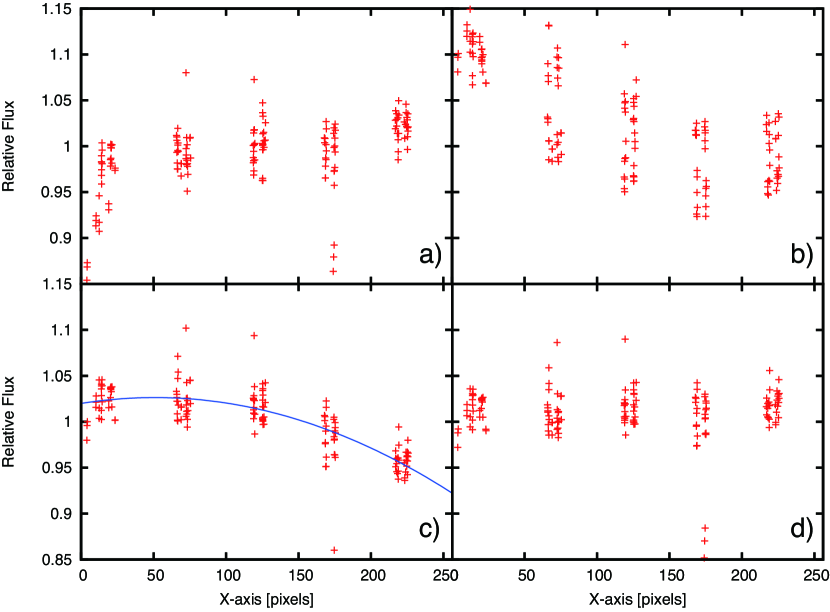
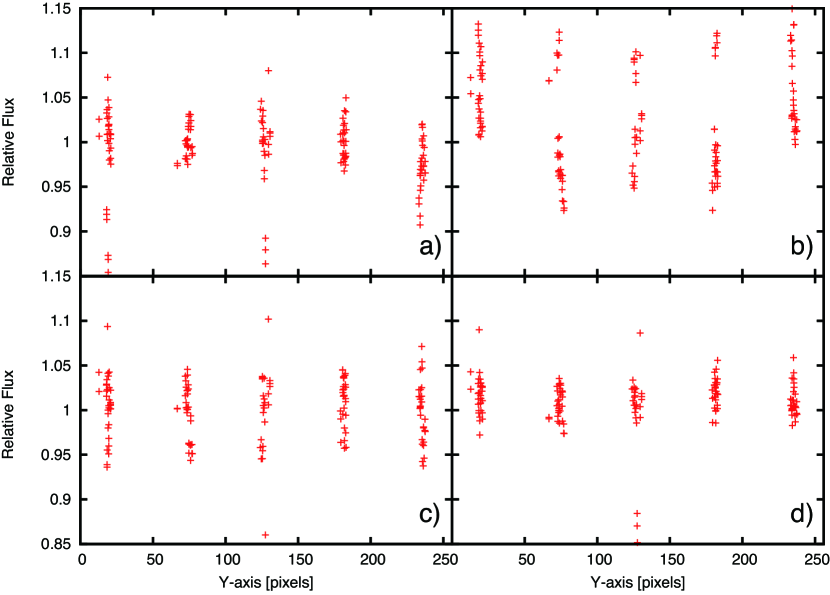
Diffuse emission images are affected not only by the artifacts and the extended PSF components produced by bright objects in the field-of-view, but also by those produced by diffuse sky background. Signals of the artifacts produced by the diffuse background in each pixel are small, but the total amount of the signals integrated over the entire array becomes significant. Flat data for mid-infrared instruments are usually produced from the sky background data. Previous flat data for the MIR-L channel are created from a large number of background sky images. Thus the artifacts at L15 and L24 can affect the derived flat data. In fact, they show strange patterns, which are attributed to the artifact effects (Lorente et al., 2008). The flat data show a steep decline at the edges of the field-of-view (Figure 8a). It is most likely that the decline is produced by the effect of the artifacts, especially artifact A.
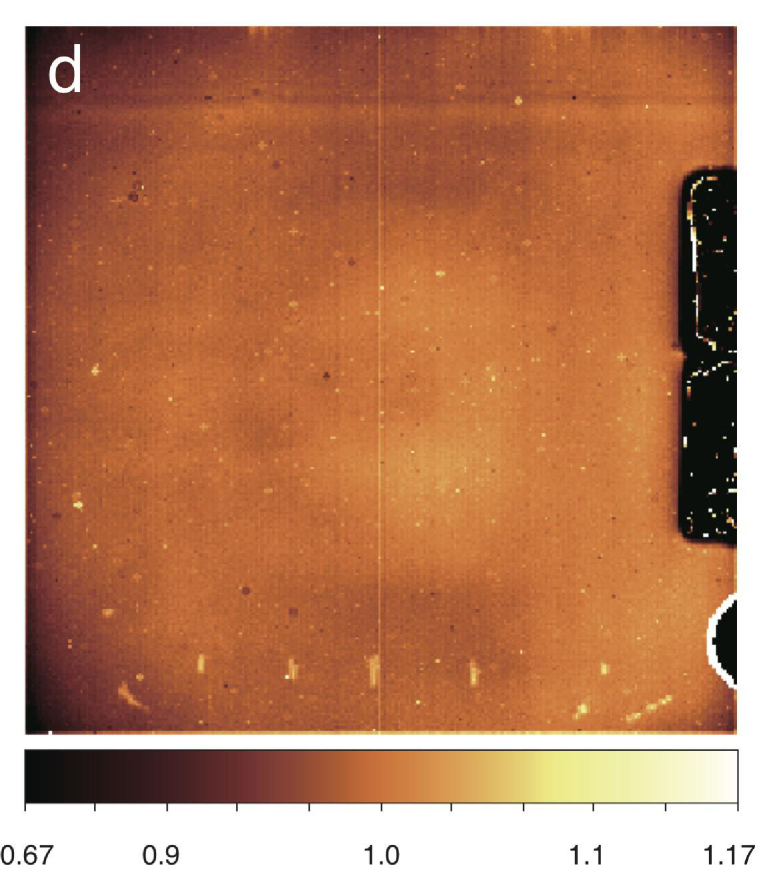
To investigate the effects of the artifacts on the flat data, we carried out observations of the MIR-L standard star IRAS F060096636 at 25 different positions of a 55 grid separated by in the field-of-view of the MIR-L (Table 1) and compare the variation in the signal with the flat data. The flux of the star is measured with aperture photometry with a radius of 7″.5 and is derived for each dithered image. The comparison indicates that the previous flat data overcorrect the flux of a point source at an edge of the field-of-view by 15 % at most at L24 (Figures 9b and 10b). The standard deviation of the flux variation increases from 3.8 % (without flat-fielding) to 6.4 % if the flat correction is made. These observations were useful to estimate the accuracy of the previous flat-fielding process of MIR-L images, but did not have sufficient spatial information to produce new flat data.
We produce new flat data for L15 and L24 from the previous flat data by correcting for the artifacts derived in § 2.1.2. First we assume that the sky background is uniform over the entire field-of-view and integrate the contribution from the signal of each position to obtain the artifact pattern that is produced by the uniform background. Next the artifact pattern is searched for in the previous flat data and the amplitude of the artifact is estimated. The scaled artifact pattern is then subtracted from the previous flat data. The artifact-subtracted-flat data are renormalized at the center position to keep the present absolute calibration valid since most of the standard stars are observed around the center of the field-of-view (Tanabé et al., 2008). Finally we apply the newly-derived flat data to the 55 standard star observations. The results indicate that the flat is significantly improved in the Y-direction (Figure 10c), but there still remains a shallow decline around the edge in the X-direction (Figure 9c). There may still be a very diffuse artifact that remains uncorrected. We fit the pattern in the X-direction with a quadratic function of the position and apply it to the flat data to create the final flat data (Figure 8d). With the final artifact-subtracted and slope-corrected flat data, the standard deviation of the flux variation of the standard star decreases from 3.8 % to 2.8 % for L24 (see Figures 9d and 10d).
For the L15 band, a similar trend is seen in the previous flat data. The same procedure is applied as for the L24 band to obtain new flat data after the slope correction in the X-direction. The standard deviation of the flux variation of the standard star improves from 3.2 % (without flat-fielding) to 1.2 % (with the artifacts-subtracted flat data with the slope correction) for the L15 band.
3 Data Reduction Techniques beyond the Imaging Pipeline Procedures for the Advanced Analyses of Diffuse Sources
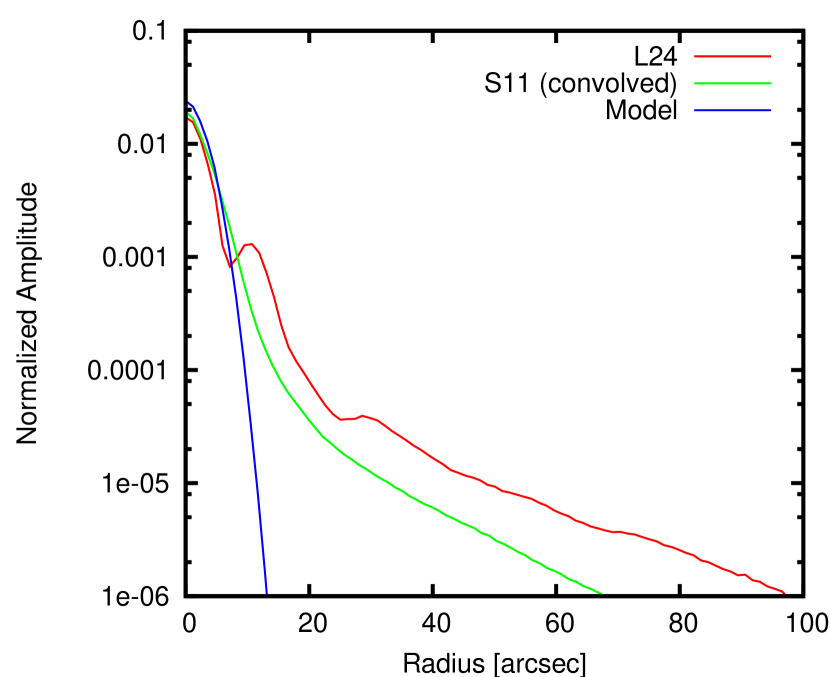
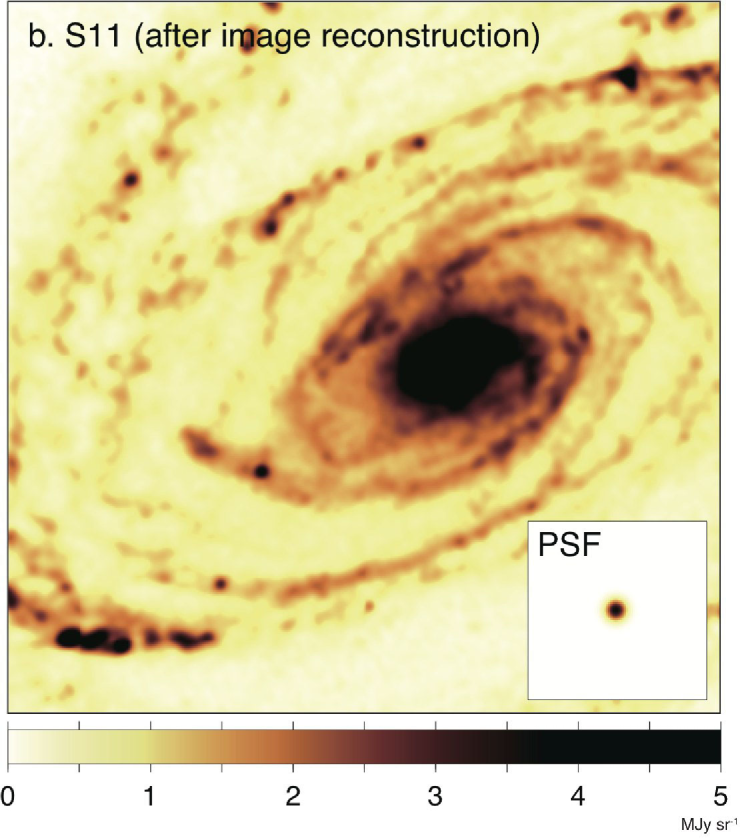
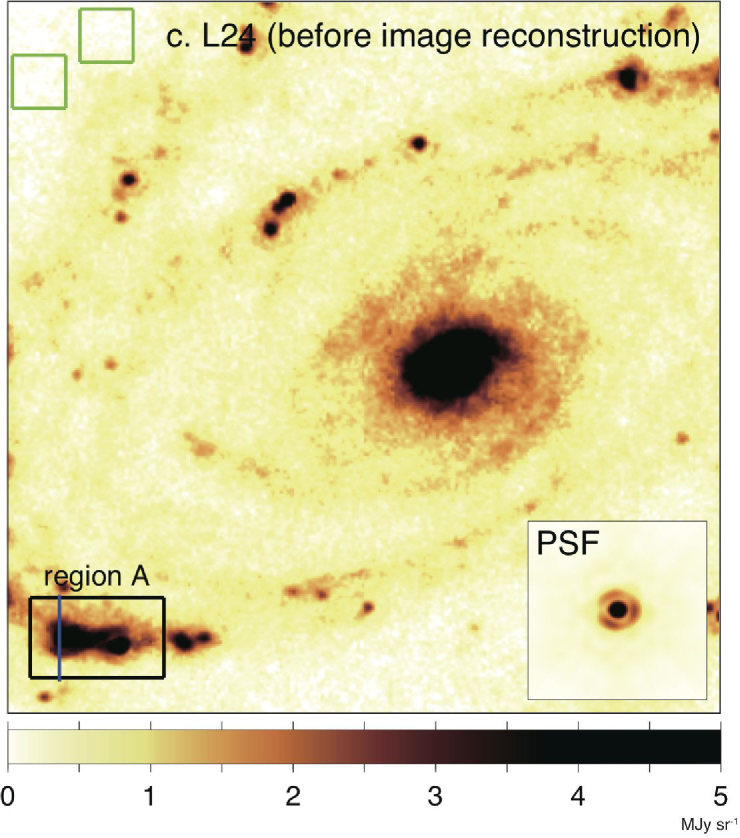
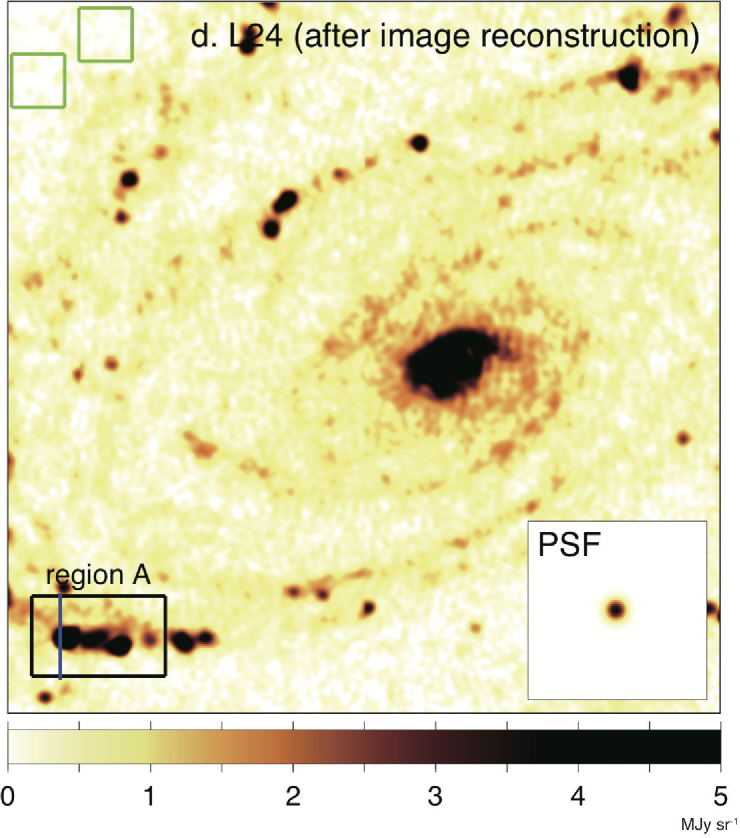
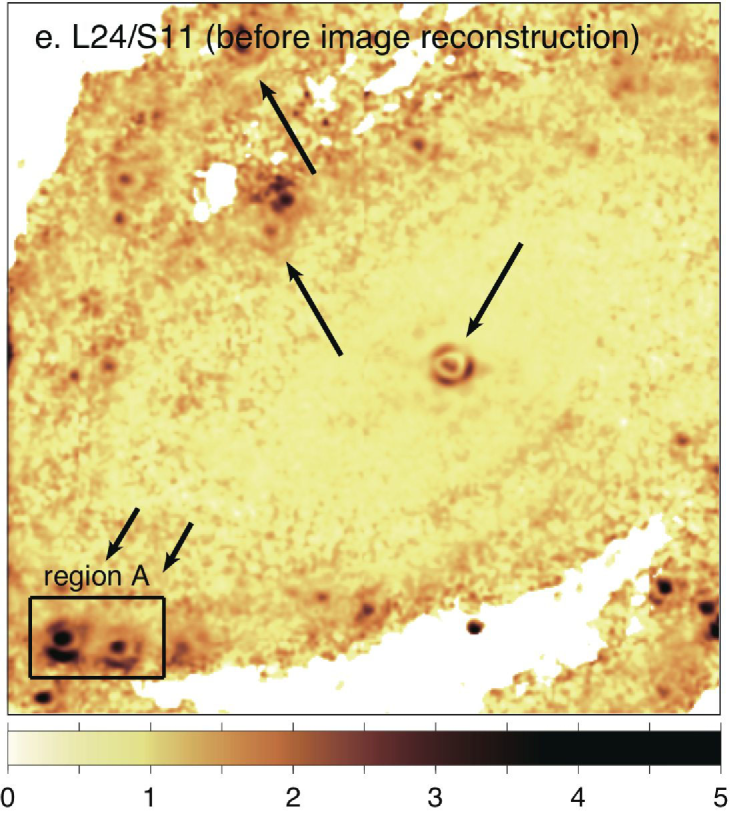
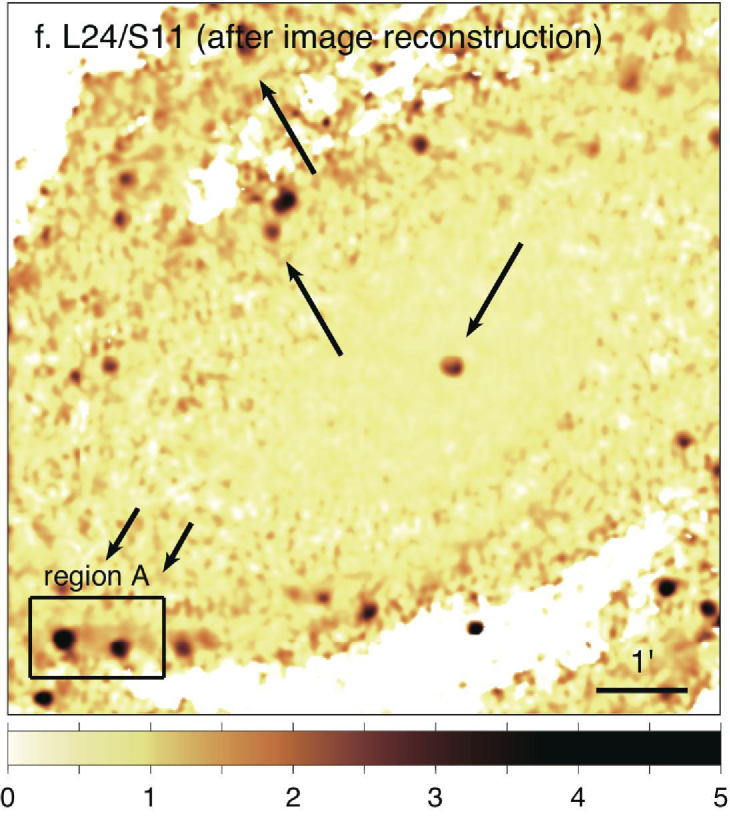
A significant fraction of IRC observations in the cold phase were made with the S7, S11, L15, and L24 bands, which provide us useful information to characterize the emission properties of the interstellar matter (e.g., Onaka et al. 2009; Sakon et al. 2007; Onaka et al. 2010). However, the differences in the PSF sizes as well as in the distinct patterns in a large scale, as shown in Table 5 and Figure 11, hamper us from directly making color analyses among those bands especially for extended objects such as ISM structures of nearby galaxies. Figure 13 compares the radial profile of the PSF at L24 and that at S11 convolved with a Gaussian to have the same FWHM as the L24 PSF (6″.7, see Table 5). It shows that the radial profile of the adjusted PSF of S11 is different from that of L24, especially at larger radii beyond . In Figure 14 we exemplify the case of imaging data of the nearby galaxy M81. Ring-like artifacts appear around H II regions and the nucleus of the galaxy in the L24/S11 flux ratio map of M81 made from this simple convolution of the S11 image (Figure 14e, indicated by the arrows). The ring-like structures come from the diffraction pattern at L24, which should be corrected for by making use of the proper PSF pattern. To make comparative studies with the four bands it is necessary to adjust the PSF pattern properly. We investigate a method to convolve the deconvolved image with an appropriate kernel.
Following Gordon et al. (2008), we define the convolution kernel as
| (3) |
where DFT indicates the discrete Fourier transform operation and is the reverse operation. is the PSF of the input image and is a simple PSF to which all band images will be adjusted. The output image is then obtained by
| (4) |
In these operations, the sampling scale for , and is set as a half of the intrinsic pixel scale. The Gaussian profile with the FWHM of 7″is employed for . The radial profile is shown by the blue line in Figure 13. The convolution with a Gaussian suppresses spurious features found in a simple deconvolution operation without losing spatial information significantly.
The present reconstruction procedure provides images that can be used reliably for the study of faint extended emission. Figure 14 shows how the reconstruction procedure described above improves the image quality taken with the IRC. For example, some discrete H II regions are seen as bright point-like spots over the relatively faint diffuse emission from the ISM in the M81 in the L24 image in Figure 14c. Due to the extended component of the PSF, especially to the diffraction ring structure of the PSF at L24, the diffuse emission around such bright sources are overlapped by the extended artifacts that come from the bright sources. Figure 15 shows the surface brightness profiles along a certain selected line defined in both images of region A before and after processing the present image reconstruction (see Figures 14c and 14d. respectively). A typical level of the diffuse emission in region A is about 0.7 MJy if the area that is not affected by bright sources. On the other hand, a bright infrared point-like source centered at with a flux density of 0.02 Jy at L24, for example, produces the ring-like pattern that makes a false contribution to the surface brightness as bright as 2 MJy in the profile ranges of =7-9 and =16-18 (see Figure 15). In this case, about one third of the whole pixels in region A are almost comparably affected by the extended PSF components from the bright sources, which makes it difficult to estimate the emission from the diffuse sources in concern. These artifacts are properly removed by the reconstruction procedure, as shown in Figures 14d and 15, which offers significant improvement in accurate photometry of the surface brightness of diffuse sources located even at a closer region to a point source. After the present image reconstruction, the surface brightness of the diffuse emission can be measured with an accuracy of 0.2 MJy at L24 if there are no sources brighter than 0.1 Jy within 5 pixels from the region in question. We note that the present methods do not take account of the changes in PSF shapes within the FOV. Thus the accuracy of the present image reconstruction may be slightly degraded for diffuse sources around a point source located in the corner of the FOV. Figures 14e and f indicate that the image reconstruction significantly improves the quality of the comparative study of four-band images. As shown in the reconstructed L24/S11 color map (Figure 14f), the ring-like structures disappear and the contrast of the L24/S11 flux ratio is clearly enhanced compared to the original color map (Figure 14e).
4 Summary
Mid-infrared images taken with the IRC onboard AKARI suffer artifacts and extended PSFs. The artifacts are investigated at four IRC bands, whose contributions to the total input signal are measured to be about , , , and at S7, S11, L15, and L24, respectively. These artifacts affect the flat-fielding reference data and new flat data are derived by removing the effects of the artifacts. The PSFs and the aperture correction factors for point and diffuse sources are obtained at S7, S11, L15, and L24. To adjust the spatial resolution at different bands, an image reconstruction method is developed. The present investigation enables us to carry out the comparative study of four-band mid-infrared images taken with the IRC. The artifacts and extended PSFs of the IRC data have common characteristics inherent in mid-infrared instruments. The present analysis will be useful not only for the analysis of IRC MIR data, but also for the design, ground tests, on-orbit calibration plans, and data analyses of mid-infrared instruments of future facilities. The image reconstruction developed here can also be applied to data taken with other instruments.
The MIR-L ghost patterns, the new flat data of L15 and L24, and the HDR PSFs of S7, S11, L15, and L24 are available at http://www.ir.isas.jaxa.jp/AKARI/Observation/. The new flat data are included in the latest version of the imaging toolkit (ver. 20110225). The validity of the absolute calibration is confirmed with the data of standard stars in the LMC (Tanabé et al., 2008) processed with the latest imaging toolkit with the new flat data.
References
- Arimatsu et al. (2011) Arimatsu, K., Izumiura, H., Ueta, T., Yamamura, I., & Onaka, T. 2011, ApJ, 729, L19
- Bernard et al. (2008) Bernard, J. -P., et al. 2008, AJ, 136, 919
- Cohen et al. (2007) Cohen, M., Green, A. J., Meade, M. R., et al. 2007, MNRAS, 374, 979
- Gordon et al. (2008) Gordon, K. D., Engelbracht, C. W., Rieke, G. H., Misselt, K. A., Smith, J.-D. T., & Kennicutt, Jr., R. C. 2008, ApJ, 682, 336
- Hola et al. (2004) Hoa, J. L., et al. 2004, Proc. SPIE, 5487, 77
- Ita et al. (2008) Ita, Y., et al. 2008, PASJ, 60, S435
- Jarrett (2006) Jarrett, T. 2006, IRAC Extended Source Calibration http://web.ipac.caltech.edu/staff/jarrett/irac/calibration
- Kaneda et al. (2007) Kaneda, H., Kim, W., Onaka, T., Wada, T., Ita, Y., Sakon, I., & Takagi, T. 2007, PASJ, 59, S423
- Lorente et al. (2008) Lorente, R., Onaka, T., Ita, Y., Ohyama, Y., & Pearson, C. P. 2008, AKARI IRC Data User Manual v.1.4 http://www.ir.isas.jaxa.jp/ASTRO-F/Observation/
- Meixner (2008) Meixner, M. 2008, PASA, 25, 149
- Murakami et al. (2007) Murakami, H., et al. 2007, PASJ, S59, 369
- Ohyama et al. (2007) Ohyama, Y., et al. 2007, PASJ, S59, 411
- Okumura (2003) Okumura, K. 2003, ESASP, 481, 211
- Onaka et al. (2007) Onaka, T., et al. 2007, PASJ, S59, 401
- Onaka et al. (2009) Onaka, T., et al. 2009, ASP Conf. Ser., 414, 227
- Onaka et al. (2010) Onaka, T., Matsumoto, H., Sakon, I., and Kaneda, H. 2010, A&A, 514, A15
- Pipher et al. (2004) Pipher, J. L., et al. 2004, Proc. SPIE, 5487, 234
- Reach et al. (2005) Reach, W. T., et al. 2005, PASP, 117, 978
- Sakon et al. (2007) Sakon, I., et al. 2007, PASJ, 59, 483
- Tanabé et al. (2008) Tanabé, T., et al. 2008, PASJ, 60, S375
| Observation ID | AOTaaAstronomical Observation Template for the IRC and FIS observations. See ASTRO-F Observer’s Manual for details of the parameters (http://www.ir.isas.jaxa.jp/AKARI/Observation/ObsMan/). | Date | Object | Note |
|---|---|---|---|---|
| MIR-S channel | ||||
| 4080002.1 | IRC03 a;L | 2007 Mar 05 | CRL618 | PSF & SCL |
| 4080019.1 | IRC03 a;L | 2007 Mar 05 | CRL618 | PSF |
| 4080007.1 | IRC03 a;L | 2006 Sep 28 | Red Rectangle | PSF & SCL |
| 4080006.1 | IRC03 a;L | 2006 Sep 28 | Red Rectangle | PSF |
| 1800623.1 | IRC02 a;L | 2007 May 10 | HIP 28909 | PSF |
| 5020008.1 | IRC03 a;L | 2006 Apr 22 | HIP 28909 | PSF |
| 5124007.1 | IRC03 a;L | 2006 Jun 24 | KF01T4 | PSF |
| 5124019.1 | IRC03 a;L | 2006 Aug 03 | KF03T2 | PSF |
| 1400229.1 | IRC04 b;Ns | 2007 Feb 06 | CAR 057TO005 | SCL |
| 1401033.1 | IRC04 b;Ns | 2007 Apr 06 | CRU 032 S003 | SCL |
| 5020048.1 | IRC04 a;Ns | 2006 Apr 29 | NGC6543 | SCL |
| MIR-L channel | ||||
| 1711365.1 | IRC02 a;L | 2007 May 12 | IRAS 223964708 | PSF & SCL |
| 4080019.1 | IRC03 a;L | 2007 Mar 5 | CRL618 | SCL |
| 4080002.1 | IRC03 a;L | 2007 Mar 5 | CRL618 | PSF& SCL |
| 5124105.1 | IRC03 a;L | 2007 Jul 12 | IRAS F060096636 | PSF & FLAT |
| 5124089.1 | IRC03 a;L | 2007 Jun 19 | IRAS F060096636 | PSF & FLAT |
| 5124090.1 | IRC03 a;L | 2007 Jun 22 | IRAS F060096636 | PSF & FLAT |
| 5124091.1 | IRC03 a;L | 2007 Jun 22 | IRAS F060096636 | PSF & FLAT |
| 5124099.1 | IRC03 a;L | 2007 Jul 4 | IRAS F060096636 | PSF & FLAT |
| 5124092.1 | IRC03 a;L | 2007 Jul 21 | IRAS F060096636 | PSF & FLAT |
| 5124098.1 | IRC03 a;L | 2007 Jul 4 | IRAS F060096636 | PSF & FLAT |
| 5124097.1 | IRC03 a;L | 2007 Jul 1 | IRAS F060096636 | PSF & FLAT |
| 5124100.1 | IRC03 a;L | 2007 Jul 5 | IRAS F060096636 | PSF & FLAT |
| 5124083.1 | IRC03 a;L | 2007 Jun 1 | IRAS F060096636 | FLAT |
| 5124081.1 | IRC03 a;L | 2007 Jun 2 | IRAS F060096636 | FLAT |
| 5124082.1 | IRC03 a;L | 2007 Jun 2 | IRAS F060096636 | FLAT |
| 5124084.1 | IRC03 a;L | 2007 Jun 7 | IRAS F060096636 | FLAT |
| 5124085.1 | IRC03 a;L | 2007 Jun 12 | IRAS F060096636 | FLAT |
| 5124087.1 | IRC03 a;L | 2007 Jun 13 | IRAS F060096636 | FLAT |
| 5124086.1 | IRC03 a;L | 2007 Jun 14 | IRAS F060096636 | FLAT |
| 5124088.1 | IRC03 a;L | 2007 Jun 18 | IRAS F060096636 | FLAT |
| 5124094.1 | IRC03 a;L | 2007 Jun 26 | IRAS F060096636 | FLAT |
| 5124095.1 | IRC03 a;L | 2007 Jun 27 | IRAS F060096636 | FLAT |
| 5124093.1 | IRC03 a;L | 2007 Jun 29 | IRAS F060096636 | FLAT |
| 5124096.1 | IRC03 a;L | 2007 Jun 30 | IRAS F060096636 | FLAT |
| 5124101.1 | IRC03 a;L | 2007 Jul 8 | IRAS F060096636 | FLAT |
| 5124102.1 | IRC03 a;L | 2007 Jul 8 | IRAS F060096636 | FLAT |
| 5124103.1 | IRC03 a;L | 2007 Jul 9 | IRAS F060096636 | FLAT |
| 5124104.1 | IRC03 a;L | 2007 Jul 12 | IRAS F060096636 | FLAT |
| Object | S7 | S11 |
|---|---|---|
| A-type staraaHD 28909 (A0 star) | ||
| K-type starbbPSF indicates the data that were used to derive the PSF. SCL indicates those used to estimate the scattered light contribution (artifacts). FLAT indicates those used to estimate the reference data for flat-fielding at L15 and L24. | ||
| Zodiacle lightccCalculated from the slit image. |
| Artifact | [pixels]aaThe fit parameters in equation (1). | [pixels]aaThe fit parameters in equation (1). |
|---|---|---|
| A | ||
| B and C |
| Artifact | Total signal to | Typical radius | Surface brightness per pixel |
|---|---|---|---|
| the object signal | [pixels] | relative to the object signal | |
| L15 | |||
| A | |||
| B | |||
| C | |||
| L24 | |||
| A | |||
| B | |||
| C |
| IRC band | FWHM [arcsec] |
|---|---|
| S7 | 2.9 |
| S11 | 3.3 |
| L15 | 4.6 |
| L24 | 6.7 |
| IRC band | aaThe fit parameters in equation (2). | aaThe fit parameters in equation (2). | aaThe fit parameters in equation (2). |
|---|---|---|---|
| S7 | 0.776 | 0.371 | 0.906 |
| S11 | 0.804 | 0.428 | 0.926 |
| L15 | 1.671 | 0.417 | 0.843 |
| L24 | 1.764 | 0.396 | 0.817 |
|
|
|
|
|
|
|
|
|
|
|
|
|
|
|
|
|
|
|
|
