Modules of human micro-RNA co-target network
Abstract
Human micro RNAs (miRNAs) target about of the coding genes and form a complex regulatory network. We study the community structure of the miRNA co-target network considering miRNAs as the nodes which are connected by weighted links. The weight of link that connects a pair of miRNAs denote the total number of common transcripts targeted by that pair. We argue that the network consists of about modules, quite similar to the components (or clusters) obtained earlier [Online J Bioinformatics, 10,280 ], indicating that the components of the miRNA co-target network are self organized in a way to maximize the modularity.
1 Introduction
Micro RNAs are a class of small single stranded non-coding RNAs, about to base long, which interfere with the translation of messenger RNAs (mRNAs) by binding to their untranslated regions (UTR) [1]. Several computational methods [2] have been developed for predicting the mRNA transcripts which are possible targets of a particular miRNA. For example, nucleotide sequences are predicted as miRNAs [3] of human; their possible targets, ( in total) are listed in the mirBASE database [4]. It has been proposed on the basis of theoretical analysis that as large as human genes are targets of miRNA [5]. Regulation of coding genes by miRNAs in combination are also experimentally validated [6].
The abundance of miRNA and their targets provide enormous combinatorial possibilities for regulation. Combinatorial regulation of genes by transcription factor (TF) and miRNAs provides higher complex programs [7]. Recently, taking TFs as important mediators of miRNA-initiated regulatory effects, it was shown [8] that the underlying network is significantly associated with multicellular organismal development, cell development and cell-cell signaling. Combinatorial effect of miRNA modules [9] has been observed in tumor tissues or cell lines. This observation suggests a combinatorial effect of the module associated miRNAs on target gene regulation in selective tumor tissues or cell lines. Synergistic network [10] of miRNAs reveals that miRNA modules associated with diseases are significantly different from modules of miRNAs that does not involve in disease. Possibility of co-regulation of two or more miRNAs in context of gene expressions and relevant biological functions is, however, least explored.
Recently Mookherjee et. al. [11] have analyzed the miRNA co-target network (MCN) of Homo sapiens, which indicate that several group of miRNAs (so called clusters) provide most essential regulations. This topological analysis of miRNA network revealed that about clusters of miRNAs co-target the genes, which are involved in specific pathways. For several clusters, all miRNAs belonging to the cluster are found to be maximally expressed in a specific tissue. Further studies [12], indicate that the clusters are also disease specific. Reorganizing miRNAs into such groups (clusters) helps in identifying cooperative activity of miRNAs. In fact, from these analysis one can predict that, “if one miRNA from a particular cluster is involved in a specific biological pathway or cellular function, the other miRNAs belonging to the same cluster are likely to be involved in the same disease, pathway or function”.
Detection of communities, groups, components or clusters have been a focus of recent interest in context of complex networks. Networks like the world wide web [13], the metabolic network [14], the social network [15], protein protein interaction network [16] etc. do possess community structures, meaning the vertices tend to divide into groups, with dense connections within the groups and sparse connection existing among the groups. These communities act as the functional units of the network; for example ‘ATP synthesis’, ‘DNA processing’, and ‘cell cycle control’ are well known [17] functional modules of yeast protein-protein interaction network. Evidently, the functional properties of an entire network is quite different from their properties at community level.
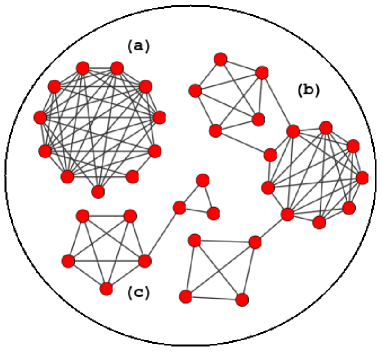
In this article, we study the community structures (modules) of miRNA co-target network of human and compare them with the components (clusters) of miRNAs obtained earlier [11]. Since the components of a network are the only disjoint subgraphs, it is expected that the community structures can be better represented by the modules. This is explained schematically in Fig. 1, where the network has components and modules.
In section 2 we briefly review the relevant features of the miRNA co-target network of human and its components (clusters). In section 3 we apply the modularization method introduced by Newmann [18] to analyze this miRNA co-target network and compare the resulting modules with the clusters obtained earlier[11]. Finally, conclusions are given in section 4.
2 Clusters of miRNAs in the co-target network
Let us briefly revisit the main ideas and results of Ref. [11] to understand the construction, topology and components of human miRNA co-target network consisting of miRNAs and their predicted targets obtained from the miRBase database (http://microrna.sanger.ac.uk/, version ). For convenience, miRNAs are given arbitrary identification number , where Further, the miRNA co-target network was constructed by considering miRNAs as the nodes and joining every pair of miRNAs having one or more common targets with a link. The total number of co-targeted transcripts of miRNAs and is taken to be the weight of the corresponding link. Clearly, the resulting adjacency matrix is symmetric (with diagonal elements ).
Mookherjee et. al. [11] have proposed an elegant method for finding the clusters of miRNAs. Since substantially large number of miRNA pairs have only few co-targets, the links between them have small weights, and can be erased to obtain a simplified network. Let be the number of components of the network when all the links having weight less than are erased. Thus, the network breaks into smaller disjoint subgraphs (components) with rate , which is maximum at It was argued that among all the subgraphs of the co-target network obtained at , the largest one is the most important; miRNAs belonging to this subgraph are found to down regulate expression of genes involved in several genetic diseases.
To be specific, the human miRNA co-target network breaks into subgraphs at , where the largest subgraph called contain miRNAs. To determine how miRNAs are organized within the subgraph , is increased further. At the subgraph breaks up into small clusters (the subgraphs having two or more miRNAs) and independent miRNAs. Out of total , clusters arise from the seed sequence111The nucleotides - of the miRNAs are called seed sequences. similarities and clusters are organized into the same genomic region ( inter-genomic clusters also show seed sequence similarities). Most of the clusters are found to be either pathways, tissues and/or diseases specific.
In the following section we aim at investigating the modular structure of miRNA co-target network. Figure 1 schematically describes, why a network is better represented by its modules than its components (disjoint subgraphs).
3 Modular structure of miRNA network
The identification of community structure is one of the many challenging problems in various scientific field. A large variety of community detection techniques have been developed based on centrality measures, link density, percolation theory etc. Recently, Newman et. al.[18] proposed a method of finding community structure of a network based on maximization of the modularity. This method is further generalized to include weighted networks[19].
The most obvious way of finding groups in a network is to minimize the number of edges connecting the groups. Simply rearranging the network, such that only few edges exist between the communities, is not enough. Rather one must rearrange it in a way that communities are connected with fewer than expected edges. One can associate a score called modularity [20] for each possible partition of a network. is defined up to a multiplicative factor as the number of edges present within the groups minus the expected number in an equivalent random network. Since positive values of indicates possible presence of community structure, one need to look for a partition for which the modularity is preferably large and positive.
A good partition of a network can be obtained by maximizing the modularity index defined as follows. Let us consider a network with vertices labeled by , and links. The corresponding adjacency matrix is . Let the degree of each vertex is , thus . If the network is to be partitioned into two groups, one associates a quantity which takes a value if vertex belongs to group (group ).
Correspondingly the modularity is given by
| (1) |
where is the expected number of links between and , if edges were placed at random. The term is () if vertices and belong to different (same) group; this assures that is maximum when two groups are connected by smaller than expected number of links. In the following we apply this procedure to obtain modular structure of MCN.
MCN is a undirected weighted network, where the weight of the link corresponds to the number of transcripts being co-targeted by the concerned pair of miRNAs and . The diagonal elements are taken , as usual. It has been pointed out in Ref. [11] that the weights vary widely between to , indicating that most of the links with small weights can be erased to obtain a simpler network. However, the connectivity of the network changes when links having weight less than a predefined value are erased. Taking the adjacency matrix , defines as
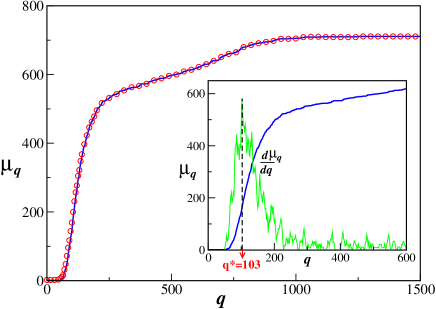
Mookherjee et. al. [11] have calculated the number of components by varying . Since, this adjacency matrix is unweighted (as it keeps the information of connectivity ignoring the actual weights) one can apply the idea of modularity maximization[18] to detect the communities or modules present there. Let be the total number of modules of . Clearly , as each component can either have one module, i.e. itself, or it can break into two or more modules. In Fig. 2 we have compared , obtained from modularization methods, with the components obtained earlier. It is evident that ; a negligible small positive difference is not visible in the figure. This brings us to conclude that the components of the network are self organized in a way that modularity (given by Eq. (1)) is maximized.
We also find that is maximum at , which is the value obtained from earlier [11]. Now let us have a closer look at the size of the components and that of the modules obtained at . This is listed in Table-I. Note, that the modularity maximization algorithm organizes the network into several small modules and few moderate size modules as . Whereas in terms of components the network breaks into few clusters of small sizes (e.g. ) along with a giant cluster () of size [11].
| Size | 2 | 3 | 4 | 5 | 6 | 7 | 8 | 9 | 11 | 12 | 13 | 14 | 17 | 26 | 37 | 57 | 98 | 101 | 477 |
| No. of clusters | 24 | 7 | 1 | 2 | 0 | 3 | 0 | 0 | 0 | 0 | 0 | 0 | 0 | 0 | 0 | 0 | 0 | 0 | 1 |
| No. of modules | 26 | 8 | 2 | 3 | 1 | 4 | 1 | 2 | 2 | 2 | 2 | 1 | 1 | 1 | 1 | 1 | 1 | 1 | 0 |
Evidently at , MCN has one distinctly large component containing miRNAs, compared to the moderate size modules those appear with competitive sizes ( and ). The largest component must have been broken into these smaller modules. Thus, as far as ‘identifying a large set of relevant miRNAs’ (one like ) is concerned, one can reliably consider the component as
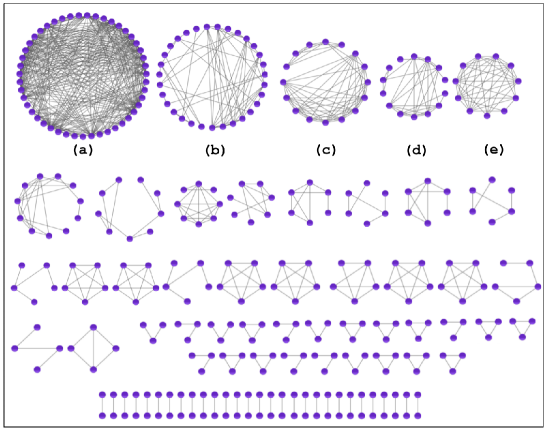
the optimal set of miRNAs, which co-regulate the gene expressions. Further, to understand how miRNAs are organized within , we calculate its modules by taking , which is the same value of used in [11], to obtains the clusters (in total ). All the components of having two or more miRNAs (referred to as clusters), are shown in Fig. 3 in decreasing order of their sizes. The first five, named as (a) to (e) have and miRNAs respectively.
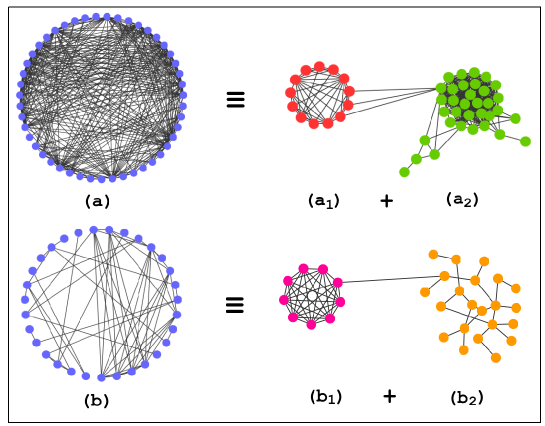
It would be interesting to look at the community structure of at this value of . Using the modularization algorithm [18], we find that contains modules (total miRNAs) and single miRNAs. Whereas in terms of components, had clusters (total miRNAs) and independent miRNAs [11]. The detailed study of modules reveals that only two of the clusters are broken into smaller modules : cluster (a) in Fig. 3 with miRNA, has two modules and of size and respectively, cluster (b) with miRNAs, breaks into two modules ( miRNAs) ( miRNAs). Such modular structures of (a) and (b) were not apparent in Fig. 3; we redraw these graphs keeping all miRNAs in same module close to each other. The resulting graph (Fig. 4 (a) and (b)) clearly show the existence of modular structures.
In summary, the community structure in these networks are very similar to the components (or clusters) obtained earlier in [11]. Only few large components show further small sub-structures, indicating that the existing components of MCN are already optimally modularized. Implications of these results will be discussed in section 4.
Few comments are in order. It is quite evident that cluster (c) in Fig. 3, containing miRNAs, might have sub-structures of size and , which could not be obtained when the modularization algorithm is applied to the un-weighted graph containing miRNAs. In this analysis, the actual weights were ignored, all links having weight more than are considered identical irrespective of their actual weight. When we keep these weights and use the modified version of the algorithm [19], that works for weighted networks, the cluster (c) shows the predicted substructures. In addition, some other modules, such as which has miRNAs also show further sub-structures of size and . These four nodes, turns out to be those shown in the left side of in Fig. 4.
It appears that Newman’s algorithm, both for un-weighted and weighted network, provides only the sub-structures of large components. This is because, modularity of the network is inversely proportional to the total number of links ( see Eq. (1)). Thus, the total modularity of a network with many components is not substantially altered by re-structuring the small components into smaller sub-structures. It is only, the re-structuring of larger components which can change the modularity appreciably. To overcome this difficulty, one must find modular structures of individual components, instead of looking at the community structure of the whole network.
4 Conclusion
To our surprise, the community structure of human miRNA co-target networks is very similar to the existing components or clusters. Only few large components show smaller sub-structures. Most of the components do not show any further substructures, indicating that the miRNA co-target network inherently consists of optimally modularized structures. It is quite possible that, during the evolution of miRNAs, first the the modular structures are formed, optimized and then they join with other modules to provide essential regulation for complex life structures. Further study in these directions is required to verify such hypothesis.
References
- [1] Chen K and Rajewsky N 2007 Nature Reviews - Genetics 8 93.
- [2] Majoros W H and Ohler U 2007 BMC Genomics 8 152; Grimson A, Farh K K H, Johnston W K, Engele P G, Lim L P and Bartel D P 2007 Molecular Cell 27, 91105.
- [3] Jones S G, Saini H K, Dongen S V and Enright A J 2008 Nucl. Acids Res. 36 D154.
- [4] miRBase : http://microrna.sanger.ac.uk/, version 10.
- [5] Miranda K C, Huynh T, Tay Y, Ang Y S, Tam W L, Thomson A M, Lim B and Rigoutsos I 2006 Cell 126 1203.
- [6] Krek A, Grun A D, Poy M N, Wolf R, Rosenberg L, Epstein E J, MacMenamin P, Piedade I, Gunsalus K C, Stoffel M, et. al. 2005 Nature Genetics 37 495.
- [7] Zhou Y, Ferguson J, Chang J T and Kluger Y 2007 BMC Genomics 8 396.
- [8] Tu K, Yu H, Hua Y J, Li Y Y, Liu L, Xie L and Li Y X 2009 Nucl. Acids Res. 37 5969.
- [9] Bandyopadhyay S, Mitra1 R, Maulik U and Zhang M Q 2010 Silence 1:6.
- [10] Xu J et. al. 2010 Nucl. Acids Res. 39(3) 825.
- [11] Mookherjee S, Sinha M, Mukhopadhyay S, Bhattacharyya N P and Mohanty P K 2009 Online Journal of Bioinformatics 10,(2) 280.
- [12] Mookherjee S, Sinha M, Mukhopadhyay S, Bhattacharyya N P and Mohanty P K arXiv:0901.4211 .
- [13] Albert R, Jeong H and Barabási A L 1999 Nature 401 130.
- [14] Jeong H, Tombor B, Albert R, Oltvai Z N and Barabási A L 2000 Nature 407, 651.
- [15] Barabási A L 2005 Science 308 639; Barabási A L, Jeong H, Ravasz R, Néda Z, Vicsek T and Schubert A 2002 Physica A 311 590.
- [16] Jeong H, Mason S, Barabási A L and Oltvai Z N 2001 Nature 411 41; Lim J, Hao T, Shaw C, Patel A J, Szabó G, Rual J F, Fisk C J, Li N, Smolyar A, Hill D E, Barabási A L, Vidal M and Zoghbi H Y 2006 Cell 125 801.
- [17] Zhou H and Lipowsky R 2004 Lecture Notes Comput. Sci. 3038 1062 (Preprint http://power.itp.ac.cn/ zhouhj/works/publications.html).
- [18] Newman M E J 2006 PNAS 103 8577.
- [19] Clauset A, Newman M E J and Moore C 2004 Phys. Rev. E 70 066111.
- [20] Newman M E J and Girvan M 2004 Phys. Rev. E 69 026113.