The substellar mass function in the central region of the open cluster Praesepe from deep LBT observations ††thanks: The LBT is an international collaboration among institutions in Germany, Italy and the United States. LBT Corporation partners are: LBT Beteiligungsgesellschaft, Germany, representing the Max-Planck Society, the Astrophysical Institute Potsdam, and Heidelberg University; Istituto Nazionale di Astrofisica, Italy; The University of Arizona on behalf of the Arizona university system; The Ohio State University, and The Research Corporation, on behalf of The University of Notre Dame, University of Minnesota and University of Virginia.
Abstract
Context. Studies of the mass function (MF) of open clusters of different ages allow us to probe the efficiency with which brown dwarfs evaporate from clusters to populate the field. Surveys of older clusters (age 100 Myr) are not affected so severely by several problems encountered in young clusters, such as intra-cluster extinction and large uncertainties in brown dwarf models.
Aims. We present the results of a deep photometric survey to study the MF of the central region of the old open cluster Praesepe (age 590 Myr, distance 190 pc), down to the substellar regime.
Methods. We performed an optical ( and -band) photometric survey of Praesepe using the Large Binocular Telescope Camera covering an area of 0.59 deg2 in the cluster centre from mag (100 ) down to a 5 detection limit at 25.6 mag (40 ). The survey is approximately 95% complete at mag and mag (55 ).
Results. We identify 59 cluster member candidates, of which 37 are substellar, by comparing with the predictions of a dusty atmosphere model. The MF of those candidates rises from the substellar boundary until 67 and then declines. This is quite different from the form inferred for other open clusters older than 50 Myr, but seems to be similar to those found in very young open clusters, the MFs of which peak at 10 . Either Praesepe really does have a different MF from other clusters or they had similar initial MFs but a different dynamical evolution. Since most of the candidates are faint, we lack astrometric or spectroscopic follow-ups to test their memberships. However, the contaminations by field dwarfs, galaxies, or giants are found to have little effect on the shape of MF and therefore the MF of ‘real’ cluster members should have similar characteristics.
Key Words.:
stars: brown dwarfs – stars: low-mass – stars: luminosity function, mass function – Galaxy: open clusters and associations: individual: Praesepe1 Introduction
The mass functions (MFs) of stellar and substellar populations have been determined from optical and near-infrared surveys for several open clusters at different ages, such as the Orion Nebula Cluster, Orionis, Ophiuchi, Taurus, IC 348, IC 2391, M35, the Pleiades, and the Hyades. These MFs show clear heterogeneity (see Fig. 10), which may be partially caused by cluster evolution.
Studies of relatively old open clusters (age 100 Myr) are important for two particular reasons: first, they allow us to study the intrinsic evolution of basic properties of brown dwarfs (BDs), e.g., luminosity and effective temperature, and to compare the evolution with structural and atmospheric models; second, we may investigate how the BD and low-mass star populations as a whole evolve, e.g., the efficiency with which BDs and low-mass stars evaporate from clusters. These investigations have been carried out for the Hyades (Bouvier et al. 2008 and references therein) and for Praesepe (Boudreault et al. 2010 and references therein).
The Praesepe open cluster has been surveyed extensively in the past (cf. Table 1), but only a few surveys have reached masses below the substellar limit (and then only just). Several BD candidates were detected in those surveys, some of which will be re-examined in the present work. The substellar MF of Praesepe remains uncertain.
Boudreault et al. (2010) observed a significant difference between the MFs of Praesepe and Hyades. While they found that the Hyades MF has a maximum at 0.6 M⊙ (Bouvier et al. 2008), the MF of Praesepe continues to rise from 0.8 M⊙ down to 0.1 M⊙. This is surprising, as both clusters share similar physical properties (ages, mass, metallicity, and tidal radii). Disagreement between the Praesepe and Hyades MFs could arise from variations in the clusters’ initial MFs, or from differences in their dynamical evolution (Bastian et al. 2010). Although different binary fractions could cause the observed (system) MFs to differ, there is no clear evidence of any variations in the binary fractions from measurements published in the literature (Boudreault et al. 2010).
In this paper, we present a survey of the very low-mass star and substellar populations of Praesepe using the blue and red Large Binocular Cameras, extending down to hitherto unexplored mass regimes (40 ). The main aims of our study are to search for new BDs and determine the MF of the Praesepe for a large coverage of the substellar regime.
The candidate selection procedure, and mass and temperature determination methods employed in this study are similar to those adopted in Boudreault et al. (2010). However, we probe a lower mass regime and use an evolutionary model based on a dusty atmosphere instead of a combination of dust-free and dusty models.
| Authors | Telescope / instrument | Area | BD | Completeness limits |
|---|---|---|---|---|
| (deg2) | candidates | (mag) | ||
| Hambly et al. (1995) | COSMOS / POS & UKSTU | 19 | 0 | 20, 19 |
| Pinfield et al. (1997) | INT / WFC | 1.0 | 10a | =21.5, =20.0, =21.5 |
| Magazzù et al. (1998) | INT / WFC | 0.22 | 1 | =22.2, =21.2 |
| Chappelle et al. (2005) | INT / WFC | 2.6 | 4 | =21.3, =20.5 |
| González-García et al. (2006) | 3.5 m CAHA / LAICA & 5 m Hale / LFI | 0.33 | 1 | =23.8, =23.3 |
| Boudreault et al. (2010) | 3.5 m CAHA / 2k & 2.2m La Silla / WFI | 3.1 | 6 | =23.2, =19.9, =18.6 |
| This workb | LBT / LBC | 0.59 | 37 | =24.1, =25.6, =24.7, =20.3 |
-
a
From Fig. 3 in Pinfield et al. (1997), about 10 of their 26 Praesepe member candidates have masses below 72 .
-
b
Our work was complemented by the the 3.5 m CAHA / 2k data from Boudreault et al. (2010).
2 Observations and analysis
2.1 Observations
The observations presented in this paper were carried out with the Large Binocular Telescope (LBT) located on Mount Graham, Arizona (Hill et al. 2006), using the Large Binocular Cameras (LBCs, see Speziali et al. 2008). The LBCs are two wide-field, high-throughput imaging cameras, namely Blue (LBCB) and Red (LBCR), located at the prime focus stations of the LBT. Each LBC has a wide field of view (23’23’), with four CCD detectors of 20484608 pixels each, providing images with a sampling of 0.23″/pixel.
The optical design and detectors of the two cameras are optimized for different wavelength ranges: one for ultraviolet–blue wavelengths (320–500 nm, including the Bessel , , and Sloan and bands), and one for the red–infrared bands (500–1000 nm, including the Sloan , and Fan bands). In the full binocular configuration, both cameras are available simultaneously, and both point in the same direction of the sky, thus doubling the net efficiency of the LBT.
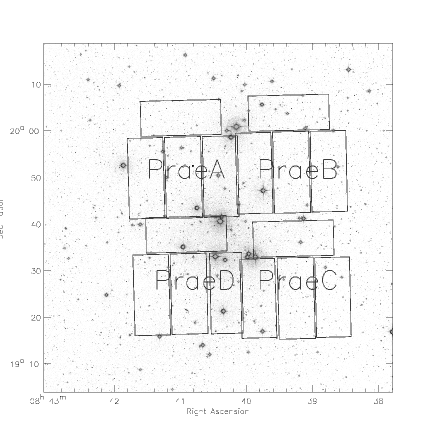
To accomplish the entire survey of the inner region of Praesepe, we carried out three observing runs, in March 2008, December 2008, and February 2009. Table 2 summarizes the observations and Fig. 1 shows the areas surveyed. The total area covered is 0.59 deg2, about 1 percent of the cluster region. The transmission curves of the filters used in this survey is presented in Fig. 2, along with a synthetic spectrum of a brown dwarf with = 2300 K, log g = 4.5 [CGS], and solar metallicity (NextGen model).

| Field | RA | DEC | Date | Filter | Seeing | ||
|---|---|---|---|---|---|---|---|
| (min) | (arcsec) | (mag) | |||||
| PraeA | 08:40:53.76 | +19:52:41.9 | 2009-02-28 | 114 | 1.0 | 25.8 | |
| 2009-02-28 | 42 | 1.0 | 25.8 | ||||
| 2009-02-28 | 54 | 1.0 | 24.8 | ||||
| 2009-02-28 | 18 | 1.0 | 21.3 | ||||
| PraeB | 08:39:14.23 | +19:52:41.9 | 2009-02-28 | 54 | 1.0 | 25.1 | |
| 2008-03-06 | 42 | 2.2 | 25.7 | ||||
| 2009-02-28 | 54 | 1.0 | 25.2 | ||||
| 2008-03-04 | 48 | 1.4 | 22.2 | ||||
| PraeC | 08:39:14.36 | +19:27:18.0 | 2008-03-07 | 90 | 1.9 | 25.6 | |
| 2008-03-07 | 30 | 2.0 | 25.8 | ||||
| 2008-03-07 | 30 | 1.0 | 25.1 | ||||
| 2009-02-28 | 18 | 1.0 | 21.2 | ||||
| PraeD | 08:40:53.63 | +19:27:18.0 | 2008-12-29 | 99 | 1.0 | 25.8 | |
| 2008-12-29 | 42 | 1.0 | 25.8 | ||||
| 2008-12-29 | 39 | 1.0 | 24.8 | ||||
| 2008-12-29 | 18 | 1.0 | 21.9 |
-
a
We also performed a shallower, 84-min pointing in on 2008-12-30.
2.2 Reduction and astrometry
The standard data reduction steps for the LBT data were performed using the IDL astronomy package and IRAF. The bias subtraction was executed on a nightly basis and for each CCD chip. To correct for pixel-to-pixel variations and global illumination, master flat frames were created for the nights using twilight exposures. For nights when no appropriate sky flat exposures were available, we used a master sky flat in the adjacent night. The individual images of a given field were registered and median combined, resulting in a combined science frame for each CCD, field and filter. To detect faint sources, we subtracted the strong background introduced by very bright stars111The area fraction affected by bright stars is less than 3% for most of CCD images, and is about 6% in the worst case.. We then used the IRAF task daofind to detect sources in the “clean” frames. The sources were extracted from the original science frames and instrumental magnitudes calculated using both aperture and point-spread function photometry with the IRAF tasks phot and allstar respectively.
At this stage, weak fringes were still visible for several -band images. The method described by Bailer-Jones & Mundt (2001) for removing fringes does not apply well in the present case, since the images are seriously affected by bright stars and no clean fringe images could be created. However, as the -band images are 1.5 dex shallower than expected, we decided not to use them in this study (although we still quote some statistics of the photometry below).
An astrometric solution was achieved using the Sloan Digital Sky Survey (SDSS York et al. 2000) catalogue as a reference. The root mean square (rms) accuracy of our astrometric solution is 0.10-0.15 arcsec. As with other reduction procedures, astrometry was also performed separately for each CCD, to ensure that the solutions were as robust as possible.
2.3 Photometric calibration
To correct for Earth atmospheric absorption of the photometry, we calibrated the inferred data using the , , and band values of Sloan Digital Sky Survey (SDSS) objects that were observed in the science fields. Zero point offsets were determined from the difference between the SDSS magnitudes and our instrumental magnitudes. Since these were obtained with objects in the same field of view for each science frame, we did not perform a colour or airmass correction when reducing our photometry. The error introduced by this approximation is less than 0.05 mag.

To calibrate our band photometry, we used our LBT and photometry and the band photometry from the United Kingdom Infrared Telescope Infrared Deep Sky Survey (UKIDSS, Lawrence et al. 2007). We found that the differences between band LBT magnitudes and band UKIDSS magnitudes have a linear dependence on the colours, which can be described by the equation
| (1) |
On the basis of about 800 common objects between UKIDSS and our measurements, the a0,1 coefficients were determined and the instrumental magnitudes were then transferred into the UKIDSS photometry system. For the same reasons as for our data, we did not (need to) perform a colour or airmass correction for our -band photometry.
The 5 detection limits of our survey are 25.6 mag and 24.7 mag for the and bands, respectively. However, we do not expect all targets brighter than these limits to be able to be detected. We estimate the survey completeness by comparing the number of objects detected to the number predicted assuming a uniform three-dimensional spatial distribution of stars. As shown in Fig. 3, the number of detected sources in each band deviates from a log-normal relationship at bright and faint limits. From this, we estimate the completeness to our 5 detection limit as 67.0% at and 70.3% at respectively, which corresponds to 40 assuming a dusty atmosphere. A similar estimation yields a completeness of 82.0% at mag and 82.6% at mag, respectively. Our survey is approximately 95% complete at mag and mag.
The relatively low completeness of our survey is possibly caused by the saturation of bright stars. For stars lying near to saturated stars, the photometric uncertainties are relatively large. A significant fraction of detected stars is then excluded because of their large photometric errors, which lowers the completeness. The total area seriously affected by bright stars in band is 3–6 percent.
2.4 Candidate selection procedure
The candidate selection introduced by Boudreault et al. (2010) was adopted in the present work. Candidates were first selected based on the colour–magnitude diagram (CMD) using bands from our LBC observations222Our bands observations do not reach a similar stellar mass, hence are not used here. A second selection was performed using a colour–colour diagram. While our bands observations are not deep enough for our present investigations, data from the near-IR photometric survey by Boudreault et al. (2010) – which fully covers our survey area, with a 5 detection limit at 55 in and bands – was used instead for the second selection. In the third and final selection, we used the known distance to Praesepe to reject objects based on the discrepancy between their observed magnitude in and the magnitude predicted from the isochrones and our estimation of . To be considered as a cluster member, an object had to satisfy all three of these criteria.
We use the evolutionary tracks of Chabrier et al. (2000) and the atmosphere models from Allard et al. (2001) – assuming a dusty atmosphere (the AMES-Dusty model) – to compute an isochrone for Praesepe using an age of 590 Myr (Fossati et al. 2008), a distance of 190 pc (van Leeuwen 2009), and a solar metallicity ([Fe/H] = 0.0380.039, Friel & Boesgaard 1992). We neglect the reddening [ = 0.0270.004 mag, Taylor 2006]. The transmission curves we used for the filters for these calculations are plotted in Fig. 2. The effective temperature varies from 500 K to 3900 K in steps of 100 K, while the gravity ranges from 4.0 dex to 6.0 dex in steps of 0.5 dex.
2.4.1 Colour-magnitude diagram
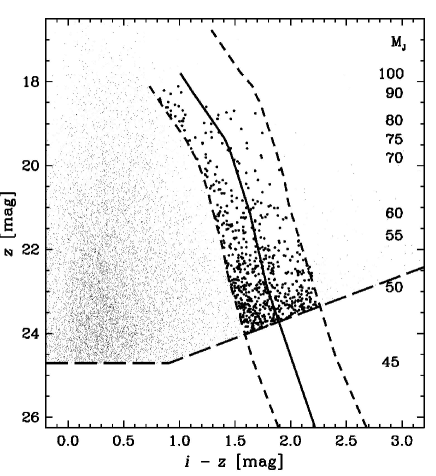
Candidates were first selected from our CMD by keeping all objects that are no more than 0.28 mag redder or bluer than the isochrones in all CMDs. This number accommodates errors in the magnitudes and uncertainties in the model isochrones. We also include the errors from the age estimate and distance to Praesepe. We additionally include objects brighter than the isochrones by 0.753 mag in order to include unresolved binaries. In Figure 4, we show the CMD where candidates were selected based on their values of versus –.
From a total of 44 209 objects above the 5 detection limit in and filters and below our saturation limit, 709 objects are retained as candidate cluster members (98.4% are rejected). Of these, 160 were detected in the NIR observations of Boudreault et al. (2010). These objects are used in the selection process described below.
2.4.2 Colour–colour diagram
From this step, The candidate selection is based on both the optical data and the NIR data. A candidate must be detected in every band.
The second stage of the candidate selection involves retaining only those objects that lie within 0.28 mag of the isochrone in the colour–colour diagram. This value accommodates the photometric errors, uncertainties in the model isochrones, and the uncertainty in the age estimation of Praesepe. The colour–colour diagram with the selection limits is shown in Figure 5, where we also plot the theoretical colours of red giants (using the atmosphere models of Hauschildt et al. 1999b) and the theoretical colours of six galaxies with redshifts from 0 to 2 (Meisenheimer et al. 2011). Neither the red giants nor the galaxies are expected to be a significant source of contamination; most of the low redshift galaxies that were not automatically discarded during PSF photometry with full-width-half-maxima (FWHMs) broader than the average stellar FWHM by 30%, were rejected by means of the visual inspection of individual cluster member candidates after selection procedures. Of the 160 objects selected in the first step, 88 are kept here.

2.4.3 Observed magnitude vs. predicted magnitude
As indicated in Section 3.2, our determinations of and mass are based on the spectral energy distribution of each object, so are independent of the assumed distance. The membership status of an object can therefore be assessed by comparing its observed magnitude in a band with its magnitude predicted from its and Praesepe’s isochrone (which assumes a distance). The predicted magnitude of a background contaminant would be lower (brighter) than its observed magnitude and higher (fainter) for a foreground contaminant. To avoid removing unresolved binaries that are real members of the cluster, we keep all objects with a computed magnitude of up to 0.753 mag brighter than the observed magnitude. We also take into account photometric errors and uncertainties in the age and distance of Praesepe. This selection procedure is illustrated in Figure 6.
Of the 88 objects selected through CMDs and colour-colour diagrams in the first two steps, 74 are retained here. After this step, we perform a direct visual inspection of the images to reject resolved galaxies and spurious detections. This inspection removes 15 objects from the photometric selection, of which seven are possibly galaxies and eight are false detections.
The remaining objects constitute our final cluster member candidates, shown as large dots in Fig. 7. Those selected using only the photometry amount to 709, and are presented in Fig. 7 as small dots. We note that employing NIR data helps us to remove a significant fraction of contaminations. At each mass bin, we calculate the number of stars removed as a result of including data in the selection, and use this to estimate the number of stars in the final mass bin where data are unavailable.
Schmidt et al. (2010) and West et al. (2011) investigated the colors of L and M dwarfs, respectively, for every spectral types using the SDSS and Two Micron All Sky Survey (2MASS) catalogues. The observed colour ranges are consistent with our computed colour ranges for M and early L dwarfs. However, the observed color range for individual L dwarfs as shown in Fig.2 in Schmidt et al. (2010) is 3.5–6.0 mag, broader and slightly redder than our model ranges (the dashes lines in our Fig.5). We note that the Hammer spectral–typing procedure employed by Schmidt et al. (2010), was developed by Covey et al. (2007), who sought to optimize only for K and M dwarfs. For L dwarfs, the uncertainties should be 2 subclasses or larger. In addition, the Hammer is designed for solar-metallicity dwarfs, while Praesepe has a metallicity of 0.270.10 dex (Pace et al. 2008), hence will be prone to significant, systematic errors (Covey et al. 2007). We therefore keep the use of our model colours alone for candidate selection for a homogeneous study. We found that if we use the observed color range from Schmidt et al. (2010) instead, the observed rise in the mass function around 60 (cf. Section 4) remains – our main conclusion remains unchanged.


| ID | RA(J2000) | DEC(J2000) | err | err | err | err | |||||||
|---|---|---|---|---|---|---|---|---|---|---|---|---|---|
| (mag) | (mag) | (mag) | (mag) | (K) | ( | (mag) | |||||||
| A01 | 8:40:12.599 | 19:56:50.33 | 20.29 | 0.03 | 19.01 | 0.06 | 18.14 | 0.05 | 17.01 | 0.05 | 3023 | 109 | 16.39 |
| A02 | 8:40:18.893 | 19:57:07.40 | 20.17 | 0.02 | 18.74 | 0.06 | 17.75 | 0.03 | 16.77 | 0.04 | 2729 | 93 | 16.90 |
| A03 | 8:40:20.624 | 19:43:40.72 | 23.42 | 0.06 | 21.75 | 0.10 | 19.55 | 0.11 | 17.88 | 0.10 | 1921 | 58 | 19.04 |
| A04 | 8:40:24.901 | 19:57:15.52 | 22.93 | 0.05 | 21.19 | 0.03 | 19.25 | 0.18 | 17.53 | 0.08 | 1940 | 59 | 18.99 |
| A05 | 8:40:25.044 | 19:41:44.56 | 19.23 | 0.02 | 18.40 | 0.02 | 17.37 | 0.02 | 16.47 | 0.03 | 3093 | 113 | 16.27 |
| A06 | 8:40:25.773 | 19:57:08.28 | 19.84 | 0.03 | 18.79 | 0.04 | 17.63 | 0.04 | 16.72 | 0.04 | 2821 | 98 | 16.74 |
| A07 | 8:40:25.981 | 19:57:07.02 | 19.72 | 0.03 | 18.69 | 0.04 | 17.55 | 0.04 | 16.63 | 0.04 | 2900 | 102 | 16.61 |
| A08 | 8:40:27.459 | 19:43:19.69 | 22.06 | 0.08 | 20.66 | 0.08 | 18.60 | 0.04 | 16.96 | 0.04 | 1997 | 61 | 18.82 |
| A09 | 8:40:32.282 | 19:43:53.72 | 25.33 | 0.15 | 23.23 | 0.07 | 20.28 | 0.20 | 18.84 | 0.24 | 1855 | 56 | 19.22 |
| A10 | 8:40:33.639 | 19:53:08.76 | 23.94 | 0.03 | 22.41 | 0.02 | 19.77 | 0.06 | 18.37 | 0.08 | 1902 | 57 | 19.09 |
| A11 | 8:40:35.313 | 19:44:54.81 | 19.72 | 0.01 | 18.80 | 0.02 | 16.66 | 0.01 | 15.83 | 0.02 | 2351 | 75 | 17.73 |
| A12 | 8:40:44.975 | 20:00:24.80 | 23.43 | 0.02 | 21.83 | 0.02 | 19.09 | 0.02 | 17.56 | 0.04 | 1842 | 55 | 19.26 |
| A13 | 8:40:49.194 | 19:59:12.88 | 23.19 | 0.02 | 21.59 | 0.03 | 19.31 | 0.04 | 18.41 | 0.08 | 2040 | 62 | 18.68 |
| A14 | 8:41:08.239 | 19:47:08.93 | 23.13 | 0.09 | 21.55 | 0.04 | 19.05 | 0.02 | 17.69 | 0.03 | 1905 | 57 | 19.08 |
| A15 | 8:41:15.526 | 19:44:11.43 | 20.49 | 0.02 | 19.20 | 0.01 | 17.00 | 0.07 | 16.13 | 0.03 | 2169 | 67 | 18.25 |
| A16 | 8:41:24.916 | 19:57:26.19 | 19.11 | 0.01 | 18.12 | 0.06 | 16.13 | 0.01 | 15.25 | 0.01 | 2356 | 75 | 17.72 |
| A17 | 8:41:26.483 | 19:51:59.73 | 21.38 | 0.01 | 20.13 | 0.02 | 18.24 | 0.02 | 17.34 | 0.02 | 2294 | 72 | 17.86 |
| B01 | 8:38:39.176 | 19:42:54.85 | 20.21 | 0.01 | 18.99 | 0.01 | 17.30 | 0.03 | 16.26 | 0.02 | 2373 | 76 | 17.68 |
| B02 | 8:38:59.208 | 20:02:32.63 | 22.99 | 0.03 | 21.31 | 0.01 | 19.29 | 0.12 | 17.95 | 0.10 | 2050 | 63 | 18.65 |
| B03 | 8:39:06.931 | 19:51:00.19 | 19.28 | 0.01 | 18.26 | 0.09 | 16.98 | 0.01 | 16.13 | 0.02 | 2712 | 92 | 16.93 |
| B04 | 8:39:28.285 | 19:44:01.63 | 19.62 | 0.01 | 18.69 | 0.09 | 17.64 | 0.04 | 16.66 | 0.03 | 3093 | 113 | 16.27 |
| B05 | 8:39:34.775 | 19:43:06.65 | 22.61 | 0.05 | 21.28 | 0.03 | 19.11 | 0.07 | 17.77 | 0.09 | 2060 | 63 | 18.61 |
| B06 | 8:39:37.010 | 19:52:30.06 | 22.20 | 0.02 | 20.72 | 0.03 | 18.32 | 0.05 | 16.68 | 0.03 | 1892 | 57 | 19.12 |
| B07 | 8:39:38.172 | 20:01:17.52 | 19.32 | 0.01 | 18.49 | 0.01 | 17.04 | 0.02 | 16.06 | 0.02 | 2674 | 90 | 17.00 |
| B08 | 8:39:51.841 | 19:50:42.94 | 22.63 | 0.02 | 20.90 | 0.03 | 18.31 | 0.05 | 16.84 | 0.03 | 1867 | 56 | 19.19 |
| B09 | 8:39:56.429 | 19:47:31.41 | 22.96 | 0.03 | 21.17 | 0.04 | 19.36 | 0.09 | 17.95 | 0.11 | 2112 | 65 | 18.44 |
| C01 | 8:38:34.501 | 19:31:08.83 | 19.27 | 0.01 | 18.44 | 0.01 | 16.81 | 0.09 | 16.13 | 0.02 | 2590 | 86 | 17.18 |
| C02 | 8:38:48.106 | 19:31:43.17 | 23.21 | 0.06 | 21.28 | 0.02 | 19.73 | 0.10 | 18.14 | 0.12 | 2181 | 68 | 18.21 |
| C03 | 8:38:49.426 | 19:16:43.34 | 23.50 | 0.03 | 21.74 | 0.02 | 18.98 | 0.06 | 17.34 | 0.05 | 1808 | 54 | 19.49 |
| C04 | 8:38:59.835 | 19:31:52.00 | 21.71 | 0.01 | 20.37 | 0.01 | 18.62 | 0.04 | 17.59 | 0.07 | 2310 | 73 | 17.83 |
| C05 | 8:39:00.756 | 19:37:38.70 | 19.08 | 0.01 | 18.21 | 0.01 | 16.70 | 0.01 | 15.77 | 0.01 | 2626 | 88 | 17.10 |
| C06 | 8:39:02.279 | 19:37:38.47 | 22.32 | 0.01 | 20.85 | 0.01 | 18.72 | 0.07 | 17.88 | 0.08 | 2159 | 67 | 18.29 |
| C07 | 8:39:11.773 | 19:36:35.63 | 21.53 | 0.01 | 20.27 | 0.01 | 18.61 | 0.10 | 17.44 | 0.06 | 2381 | 76 | 17.66 |
| C08 | 8:39:22.309 | 19:38:37.41 | 22.06 | 0.01 | 20.35 | 0.01 | 18.42 | 0.10 | 16.96 | 0.04 | 2062 | 63 | 18.61 |
| C09 | 8:39:35.180 | 19:34:13.22 | 19.97 | 0.01 | 18.94 | 0.01 | 16.50 | 0.10 | 16.41 | 0.03 | 2160 | 67 | 18.28 |
| C10 | 8:39:35.196 | 19:33:50.49 | 20.21 | 0.01 | 19.16 | 0.01 | 17.51 | 0.01 | 16.47 | 0.02 | 2462 | 79 | 17.47 |
| C11 | 8:39:36.737 | 19:34:55.25 | 24.59 | 0.12 | 22.83 | 0.03 | 20.16 | 0.18 | 18.43 | 0.13 | 1786 | 53 | 19.64 |
| C12 | 8:39:47.778 | 19:28:03.10 | 20.15 | 0.01 | 18.80 | 0.01 | 16.90 | 0.01 | 15.82 | 0.01 | 2217 | 69 | 18.09 |
| C13 | 8:39:54.504 | 19:20:09.00 | 23.06 | 0.03 | 21.55 | 0.01 | 19.16 | 0.07 | 18.16 | 0.11 | 2007 | 61 | 18.79 |
| D01 | 8:40:10.438 | 19:24:07.42 | 19.39 | 0.01 | 18.49 | 0.02 | 17.08 | 0.01 | 16.25 | 0.02 | 2683 | 91 | 16.98 |
| D02 | 8:40:13.215 | 19:27:00.51 | 24.64 | 0.07 | 22.92 | 0.04 | 20.14 | 0.19 | 18.06 | 0.11 | 1703 | 50 | 20.21 |
| D03 | 8:40:13.829 | 19:26:55.82 | 24.33 | 0.05 | 22.58 | 0.05 | 20.35 | 0.24 | 18.65 | 0.20 | 1896 | 57 | 19.11 |
| D04 | 8:40:20.994 | 19:38:46.21 | 24.11 | 0.14 | 22.15 | 0.07 | 19.72 | 0.17 | 18.10 | 0.12 | 1848 | 55 | 19.24 |
| D05 | 8:40:21.561 | 19:38:51.23 | 23.88 | 0.15 | 21.81 | 0.06 | 19.31 | 0.12 | 17.40 | 0.06 | 1760 | 52 | 19.81 |
| D06 | 8:40:25.698 | 19:36:25.68 | 19.52 | 0.01 | 18.56 | 0.04 | 16.89 | 0.01 | 16.10 | 0.02 | 2504 | 81 | 17.37 |
| D07 | 8:40:26.220 | 19:37:54.58 | 23.70 | 0.08 | 22.28 | 0.05 | 19.71 | 0.13 | 18.44 | 0.16 | 1947 | 59 | 18.97 |
| D08 | 8:40:39.292 | 19:28:39.49 | 22.04 | 0.02 | 20.44 | 0.01 | 18.07 | 0.02 | 16.76 | 0.02 | 1962 | 59 | 18.93 |
| D09 | 8:40:43.705 | 19:29:52.89 | 25.40 | 0.17 | 23.39 | 0.10 | 21.10 | 0.38 | 18.66 | 0.14 | 1705 | 50 | 20.19 |
| D10 | 8:40:50.371 | 19:29:46.29 | 22.55 | 0.05 | 21.22 | 0.04 | 18.88 | 0.05 | 17.20 | 0.04 | 1898 | 57 | 19.11 |
| D11 | 8:40:53.452 | 19:19:13.98 | 23.02 | 0.03 | 21.33 | 0.03 | 18.82 | 0.04 | 17.10 | 0.03 | 1847 | 55 | 19.25 |
| D12 | 8:40:53.559 | 19:41:00.05 | 19.85 | 0.02 | 18.60 | 0.03 | 16.82 | 0.05 | 15.61 | 0.02 | 2320 | 73 | 17.81 |
| D13 | 8:40:56.008 | 19:25:31.85 | 24.62 | 0.10 | 22.55 | 0.06 | 20.01 | 0.12 | 17.67 | 0.06 | 1682 | 50 | 20.39 |
| D14 | 8:41:00.974 | 19:32:00.88 | 23.01 | 0.08 | 21.23 | 0.06 | 19.08 | 0.06 | 17.81 | 0.07 | 2015 | 61 | 18.76 |
| D15 | 8:41:02.632 | 19:22:13.66 | 23.66 | 0.04 | 22.09 | 0.04 | 20.22 | 0.16 | 19.35 | 0.25 | 2216 | 69 | 18.10 |
| D16 | 8:41:06.062 | 19:27:47.71 | 24.41 | 0.08 | 22.88 | 0.06 | 20.26 | 0.17 | 19.41 | 0.30 | 1903 | 57 | 19.09 |
| D18 | 8:41:15.768 | 19:28:15.81 | 19.79 | 0.01 | 18.83 | 0.02 | 17.35 | 0.01 | 16.49 | 0.02 | 2588 | 86 | 17.19 |
| D19 | 8:41:17.045 | 19:28:13.46 | 22.84 | 0.02 | 21.41 | 0.02 | 19.44 | 0.08 | 18.38 | 0.12 | 2184 | 68 | 18.20 |
| D20 | 8:41:32.924 | 19:32:13.40 | 24.01 | 0.03 | 22.40 | 0.04 | 19.52 | 0.09 | 17.86 | 0.07 | 1807 | 54 | 19.49 |
| D21 | 8:41:36.404 | 19:25:06.45 | 20.71 | 0.01 | 19.60 | 0.01 | 18.01 | 0.03 | 17.24 | 0.05 | 2513 | 82 | 17.35 |
3 Results
3.1 Selected photometric candidates
We find that 59 photometric candidates survive the selection procedures (based on isochrones assuming dusty atmospheres), a density of about 100 objects per square degree. Details of all photometric candidates are listed in Table 3. The identification number (ID) of a candidate is defined according to the field in which it was found and a sequential number for that field. The last column, , is the predicted magnitude based on photometric determination of and mass.
Our survey concentrates on the substellar regime. Saturation occurs at 18 mag in band, corresponding to 100 . Therefore, most of the low mass candidates discovered in previous surveys (e.g. Pinfield et al. 1997, Hambly et al. 1995) are saturated in our LBT images. Only a few faint brown dwarfs classified by Pinfield et al. (1997), González-García et al. (2006), and Boudreault et al. (2010) are rediscovered in the current survey (cf. Table 4). These objects are M5–9 dwarfs, according to the photometric relations given by West et al. (2008).
Some of our targets were previously identified as cluster members but rejected by our selection procedures or visual inspection. For example, eleven of the 150 Boudreault et al. (2010) candidates are detected in our LBT survey (the rest are mostly saturated). However, nine of them are rejected in this work (cf. Table 5). Among them, seven are rejected on the basis of the vs. – CMD selection, because they are bluer than the isochrone area. Another one is obviously not a point-like source in the LBT image, and another is rejected because its observed magnitude is inconsistent with its model-predicted magnitude. The remaining two targets are confirmed to be cluster dwarf stars. As our current work employed more photometric bands than Boudreault et al. (2010), it is unsurprising that our selection is more conservative.
Most of our candidates are in the substellar regime, and other than the five targets listed in Table 4, no other accurate photometric observations are available from past epochs. This precludes using proper motions as a means of cluster membership assessment at this time.
| ID | RA(J2000) | DEC(J2000) | Alternative name | Ref.a |
|---|---|---|---|---|
| (hms) | (∘ ′″) | |||
| A16 | 8:41:24.916 | 19:57:26.19 | NGC2632 PHJ20 | [1] |
| A17 | 8:41:26.483 | 19:51:59.73 | J084126.5+195200 | [2] |
| C12 | 8:39:47.778 | 19:28:03.10 | Praesepe017 | [3] |
| NGC2632 PHJ11 | [1] | |||
| D12 | 8:40:53.559 | 19:41:00.05 | Praesepe001 | [3] |
| D08 | 8:40:39.292 | 19:28:39.49 | J084039.3+192840 | [2] |
3.2 Photometrically-derived masses and effective temperatures
From the evolutionary tracks and atmosphere models described previously, we obtained the magnitudes from the average flux of a star in a specific band using the equation
| (2) |
where is the magnitude observed in a given passband, the flux received on Earth in this passband, and is a constant that remains to be determined. The flux was obtained using the total transmission function of the passband for a given filter, convolved with the quantum efficiency of the CCDs (we assumed that the telescope and instrumental throughput is flat over each passband). To transform our optical and band magnitudes from the models to the Johnson photometric system, we assumed all magnitudes to be equal to 0.03 when is the average Vega flux received on Earth. The constant for each passband is then determined using the Vega flux from Colina et al. (1992). The fitted values for these constants are and mag. The values computed by Boudreault et al. (2010) for and were and mag, respectively.
The masses and effective temperatures were estimated in the way described by Boudreault & Bailer-Jones (2009)333We first normalized the energy distribution of each object to the energy distribution of the model using the filter. The energy distribution was then fitted via a least squares fit of the model magnitudes to the measured ones.. For the faintest objects where only and are available, the colour - is used to compute masses and . There are different sources of errors for the estimation of the mass and , including the photon noise, the photometric calibration, the least squares fitting (imperfect model), and the uncertainties in the age of and distance to Praesepe. The latter two are the most significant errors and give the uncertainties of 0.008 M⊙ and 263 K for a 0.05 M⊙ substellar object ( K ), 0.010 M⊙ and 260 K for a 0.06 M⊙ substellar object ( K ), and 0.008 M⊙ and 201 K for a 0.072 M⊙ object at the hydrogen burning limit ( K ).
| ID | RA(J2000) | DEC(J2000) | ||||||||
|---|---|---|---|---|---|---|---|---|---|---|
| (mag) | (mag) | (mag) | (mag) | (mag) | ( | (K) | (mag) | |||
| 005 | 8:41:08.50 | +19:54:02.0 | 20.19 | 18.70 | 19.02 | 16.58 | 15.39 | 0.088 | 2636 | 17.06 |
| 007 | 8:39:39.56 | +19:47:54.3 | 18.93 | 17.80 | 17.95 | 16.10 | 15.07 | 0.104 | 2860 | 16.58 |
| 009 | 8:39:55.84 | +19:53:14.3 | 18.05 | 17.78 | 20.29 | 17.50 | 16.54 | 0.081 | 2520 | 17.32 |
| 018 | 8:39:42.79 | +19:35:48.2 | – | – | 18.27 | 16.20 | 15.21 | 0.097 | 2782 | 16.78 |
| 022 | 8:41:04.20 | +19:31:27.8 | 20.12 | 19.15 | 18.89 | 16.67 | 15.75 | 0.092 | 2702 | 16.97 |
| 901 | 8:39:59.45 | +19:43:37.4 | 18.05 | 18.30 | 19.09 | 17.16 | 16.41 | 0.084 | 2574 | 17.20 |
| 902 | 8:39:23.72 | +19:52:01.8 | 20.41 | 19.46 | 20.15 | 17.77 | 16.88 | 0.073 | 2348 | 17.72 |
| 903 | 8:40:00.20 | +19:30:27.0 | 19.59 | 19.01 | 19.74 | 17.50 | 16.62 | 0.076 | 2409 | 17.57 |
| 914 | 8:38:52.02 | +19:35:05.3 | 19.48 | 18.69 | 19.12 | 17.25 | 16.35 | 0.085 | 2591 | 17.16 |
3.3 Contamination by non-members
As mentioned above, the three main sources of contamination are background red giants, unresolved galaxies, and Galactic M and L dwarfs. Red giants contaminate the high mass end of this study, as seen in the vs. diagram, hence can be ignored. Although some types of galaxies have similar colours to Praesepe cluster members more massive than 60 , these low-redshift galaxies are in general extended sources and therefore easily rejected by our visual inspection. Among the 74 candidates that passed our selection procedures, we identify four as galaxies on the basis of their LBT images. Other possible sources are field L dwarfs and high redshift quasars (for instance at redshift 6; Caballero et al. 2008). However, because these quasars have spectral energy distributions similar to mid-T dwarfs, whereas our faintest candidates have colours of early L dwarfs, and given that they are rare (0.25 quasars at in a 0.59 deg2 survey, Stern et al. 2007), the MF should not be affected by quasar contamination.
The contamination by field dwarfs is not negligible. Caballero et al. (2008) identified possible field dwarf contaminants covering spectral types from M3 to T8 from the literature and presented the spatial density in the solar neighbourhood in their Table 3. From this, the spatial density of field dwarfs in the vicinity of Praesepe can be easily inferred, given the Galactic latitude of Praesepe of deg and its distance of 190 pc, assuming an exponential decrease for stellar density perpendicular to the Galactic disk with a scale height of 500 pc. The absolute band magnitude range constrained by our selection procedures is mag, as shown in Fig. 6, corresponding to a certain distance interval and a survey ‘volume’, which is defined by the product of survey area and depth. We calculated the number of contaminants by multiplying the survey volume by spatial density at each mass bin. The result is shown in Table 6. The first column gives the central value of log in each interval, while the second and third columns present the corresponding and values at that mass. The fourth column is the number density of cluster member candidates (also shown Fig. 8 as filled triangles) after applying all corrections (except for in the lowest two bins, where contaminations are too high to be corrected). The final two columns give the number density of field dwarf contaminants and corresponding fraction. We found that the field dwarf contaminants do not affect the MF shape. The contamination is significant for mag. At this magnitude, the Boudreault et al. (2010) band has a completeness of 88%. Therefore, below this magnitude, the mass functions we derived are probably upper limits.
| log | N(cand.) | N(cont.) | Fraction | ||
|---|---|---|---|---|---|
| () | (K) | (mag) | (deg-2) | (deg-2) | |
| 1.625 | 1412 | 23.29 | 13 | 195 | 1500% |
| 1.675 | 1692 | 20.28 | 27 | 41 | 150% |
| 1.725 | 1839 | 19.27 | 18 | 3.3 | 15% |
| 1.775 | 1981 | 18.87 | 33 | 4.8 | 13% |
| 1.825 | 2244 | 18.01 | 38 | 2.3 | 5.7% |
| 1.875 | 2361 | 17.71 | 17 | 3.2 | 16% |
| 1.925 | 2479 | 17.43 | 8.4 | 1.7 | 17% |
| 1.975 | 2668 | 17.01 | 8.4 | 1.6 | 16% |
We conclude that the various contaminants are either negligible, or do not affect the MF shape in the range that we can investigate quantitatively, i.e., from about 53 to 94 .
4 Mass function of very low mass and substellar population of Praesepe
The mass function, (log10M), we present here is the total number of objects per square degree in each logarithmic mass interval log10M to log10M + 0.1. Since we do not make any corrections for binaries, we compute here a system MF.
As our candidates have been selected only from their photometric properties, cluster membership confirmation via spectroscopy is desirable. However, these observations will not be feasible in the near future because of the faintness of our candidates. The following discussion is therefore based on the assumption that the MF of candidates is similar to that of ‘real’ cluster members. The assumption is possibly valid because our derived MF is consistent with that given by Boudreault et al. (2010) in the common mass bin, and the contamination by field dwarfs, giants, and galaxies should not affect the shape of the MF significantly.
To account for the survey detection efficiency, we use a simple simulation. For example, to calculate the detection efficiency of candidate A01 in band, we select a bright but unsaturated star in the band CCD image in which A01 resides, scale it down to the magnitude of A01 (i.e., ), and randomly cast this ‘fake’ star in the CCD image 100 times. We then search and re-measure the ‘fake’ star with our procedures. The detection efficiency is the fraction of ‘fake’ stars that have been re-discovered. We run this test for each filter () and multiply the detection efficiencies together (as we need a detection in every filter) to evaluate the overall detection efficiency for each candidate. This detection efficiency (or recovery rate) is about 90% for the brightest candidates and drops very quickly to 10% for the faintest candidates.
We mentioned in Section 2 that our optical photometry reaches lower masses than the NIR photometry that we used. To compute the MF of Praesepe to the lowest mass bin reached without optical data, we first computed a MF444Note that this is an inaccurate ‘MF’, because of serious contaminations. using only the optical photometry. This ‘MF’ is presented in Fig. 8 as filled dots. We computed a second MF from the list of candidates that pass the three selection criteria and are also detected in the survey of Boudreault et al. (2010) in the NIR and bands (presented on Fig. 8 as filled triangles). For each mass bin, we computed the number of objects removed as a result of adding the and filters to our selection process and mass determination procedure (plotted as a function of mass in Fig. 8, top panel). We fitted a linear function to estimate the number of objects that would be removed if we had additional and photometry to 40–45 , which is our lowest mass data point in Fig. 8. However, as shown in Table 6, the contamination in the two lowest mass bins is so overwhelming that the MFs in these two bins can only be regarded as upper limits and are no longer discussed in the paper.

Our derived MF (presented in Fig. 8, 9, & 10) shows a rise from 105 to 67 and then a turn-over at 67 . This turn-over occurs well above the 5 of either bands or bands (e.g. at 67 , 22) and we note that we have corrected the incompleteness of our survey and field dwarf contaminations. We therefore believe that this feature is genuine. This is the first time a clear rise in the substellar MF in an old open cluster has been observed.
The MF of Praesepe near the hydrogen-burning limit was previously obtained in several studies. However, only Boudreault et al. (2010) provide a common mass range for comparison, as shown in Fig. 9. In the first substellar mass bin (80 ) we see that, both surveys give consistent results within their error bars. However, for the second bin at 70 , our MF is much higher than that of Boudreault et al. (2010); the discrepancy is smaller when considering the MF from that work using the dusty atmosphere (open dots), which is still a reasonable model for such low mass stars (M9/L0). This may indicate that some faint candidates are missing in the Boudreault et al. (2010) survey, as these authors did not make any corrections for the detection efficiencies.
We emphasize that our LBT survey covers the very central 0.59 deg2 of Praesepe, while the 2k survey by Boudreault et al. (2010) covers a much wider area (3.1 deg2). If no significant candidates are missing in the 2k survey, this discrepancy may suggest that the very low mass cluster members are mostly concentrated in the cluster centre, in contrast to what is expected from a ‘dynamical evaporation’ of brown dwarf in open clusters. The basic idea of dynamical evaporation is that lower mass stars in a cluster have higher speeds according to equipartition of energy, so are able to move higher in the gravitational potential well of the cluster. Hence the fraction of low mass stars should increase with increasing distance from the cluster centre. By comparing the Praesepe and Hyades MFs, Boudreault et al. (2010) concluded that Praesepe might have been less affected by dynamical evolution.
Owing to its large distance and old age, no other published MF determination of Praesepe has reached masses below 70 . We therefore compare our results with those from other clusters in Fig. 10. This includes IC 2391 from Boudreault & Bailer-Jones (2009), ONC from Hillenbrand & Carpenter (2000), Orionis from (Caballero et al. 2007; Bihain et al. 2009), and the Hyades from Bouvier et al. (2008). The MF of Praesepe is quite different from both IC 2391 (age of 50 Myr) and the Hyades (625 Myr). Either the ‘dynamical evaporation’ does not have (or has not yet had) the same effect on these three clusters, or they had different initial mass functions. Another possibility is that Praesepe has a different binary fraction. Employing different cluster member selection criteria may also account for the observed MF discrepancies among clusters. Further studies are necessary to clarify these points.
The continuing rise of the MF into the substellar regime that we observe has also been observed in young clusters (as shown in Fig. 10), especially in Orionis (Bihain et al. 2009), Trapezium (turn-over at 10–20 , Muench et al. 2002), Oph (MF rising to 10 , Marsh et al. 2010), and in the very low luminosity young cluster in S 106, where the MF increases or at least remains flat down to 10 (Oasa et al. 2006). If we assumed a universal IMF, then it seems that the substellar MF of Praesepe has not evolved significantly since the cluster formed.


5 Conclusions
We have carried out the deepest survey to date of the old open cluster Praesepe, covering the central 0.59 deg2 in the bands. The survey probed a mass range from 100 to 40 at 5 detection limit, with which we have derived the very low mass and substellar mass function of this cluster.
We compared our optical -bands data, combined with the 2k NIR ( and ) band observations from Boudreault et al. (2010), with theoretical loci of cluster members based on a dusty atmosphere (the AMES-Dusty model), to select cluster member candidates. Our final sample comprises 59 photometric candidates. We estimate that the contamination by field dwarfs is about 15%, and that this does not affect the shape of MF. The contamination by galaxies and red giants is believed to be negligible. About two thirds of our cluster members have theoretical masses below the hydrogen-burning limit at 0.072 , and are therefore brown dwarf candidates. We emphasize that to claim cluster memberships for the candidates, follow-up astrometric or spectroscopic observations are required. However, given that the candidates are generally faint and these observations are very time-consuming, none of them has yet been confirmed in this way. The discussion in this contribution therefore refers to the mass function of photometric cluster member candidates.
The mass function we have inferred for the central 0.59 deg2 of Praesepe is consistent with that inferred for a wider area by Boudreault et al. (2010) at a mass just below the substellar boundary, but deviates by 0.6 dex in the next lowest mass bin, which may indicate that there is either a significant number of objects missing in the Boudreault et al. 2010 survey, or a higher concentration of substellar objects in the centre of Praesepe (as the Boudreault et al. survey is at a larger cluster radius). The latter possibility suggests that the dynamical evolution of very low mass stars is inefficient in this cluster, as proposed by Boudreault et al. (2010) for explaining the discrepancy between the Praesepe MF and Hyades MF.
The steady rise in the Praesepe MF down to 70 and a turn-over there were unexpected for this old cluster. Such a significant peak has never been observed in any other cluster older than 50 Myr, but has been observed in several very young open clusters such as Orionis or clusters in star–forming regions (e.g., Trapezium). This suggests that the dynamical interactions in Praesepe have very little effect on MFs, if we assume there is a universal initial MF.
Acknowledgements.
This project was supported by DFG-Sonderforschungsbereich 881 “The Milky Way System”. Some of the observations on which this work is based were obtained during LBT programme ”LBT-F08-02”. Some data analysis in this article has made use of the freely available R statistical package, http://www.r-project.org. This research has made use of the SIMBAD database, operated at CDS, Strasbourg, France. This publication makes use of data products from the Two Micron All Sky Survey, Sloan Digital Sky Survey, and United Kingdom Infrared Telescope Infrared Deep Sky Survey.References
- Allard et al. (2001) Allard, F., Hauschildt, P. H., Alexander, D. R., et al., 2001, ApJ, 556, 357
- Bailer-Jones & Mundt (2001) Bailer-Jones, C. A. L., & Mundt, R. 2001, A&A, 367, 218
- Bastian et al. (2010) Bastian, N., Covey, K. R. & Meyer, M. R., 2010, ARA&A, 48, 339
- Bihain et al. (2009) Bihain, G., Rebolo, R., Zapatero Osorio, M. R., et al., 2009, A&A, 506, 1169
- Bouvier et al. (2008) Bouvier, J., Kendall, T. T., Meeus, G., et al., 2008, A&A, 481, 661
- Boudreault & Bailer-Jones (2009) Boudreault, S. & Bailer-Jones, C. A. L., 2009, ApJ, 706, 1484
- Boudreault et al. (2010) Boudreault, S., Bailer-Jones, C. A. L., Goldman, B., et al., 2010, A&A, 510, 27
- Caballero et al. (2007) Caballero, J. A., Béjar, V. J. S., Rebolo, R., et al. 2007, A&A, 470, 903
- Caballero et al. (2008) Caballero, J. A., Burgasser, A. J., & Klement, R. 2008, A&A, 488, 181
- Chabrier (2003) Chabrier, G., 2003, PASP, 115, 763
- Chabrier et al. (2000) Chabrier, G., Baraffe, I., Allard, F. & Hauschildt, P., 2000, ApJ, 542, 464
- Chappelle et al. (2005) Chappelle, R. J., Pinfield, D. J., Steele, I. A., Dobbie, P. D., & Magazzù, A. 2005, MNRAS, 361, 1323
- Colina et al. (1992) Colina, L., Bohlin, R. & Castelli, F., 1996, Instrument Science Report CAL/SCS, 8, 1
- Covey et al. (2007) Covey, K. R., et al. 2007, AJ, 134, 2398
- Dahn et al. (2002) Dahn, C. C., Harris, H. C., Verba, F. J., et al., 2002, AJ, 124, 1170
- Fossati et al. (2008) Fossati, L., Bagnulo, S., Landstreet, J., et al., 2008, A&A, 483, 891
- Friel & Boesgaard (1992) Friel, E. D. & Boesgaard, A. M., 1992, ApJ, 387, 170
- González-García et al. (2006) González-García, B. M., Zapatero Osorio, M. R., Béjar, V. J. S., et al., 2006, A&A, 460, 799
- Hambly et al. (1995) Hambly, N. C., Steele, I. A., Hawkins, M. R. S. & Jameson, R. F., 1995, Ap&SS, 109, 29
- Hauschildt et al. (1999b) Hauschildt, P. H., Allard, F., Ferguson, J., Baron, E. & Alexander, D. R., 1999, ApJ, 525, 871
- Hill et al. (2006) Hill, J. M., Green, R. F., Slagle, J. H., 2006, SPIE, 6267, 31
- Hillenbrand & Carpenter (2000) Hillenbrand, L. A.& Carpenter, J. M., 2000, ApJ, 540, 236
- Hodgkin et al. (1999) Hodgkin, S. T., Pinfield, D. J., Jameson, R. F., et al., 1999, MNRAS, 310, 87
- Lawrence et al. (2007) Lawrence, A., et al. 2007, MNRAS, 379, 1599
- van Leeuwen (2009) van Leeuwen, F. 2009, A&A, 497, 209
- Magazzù et al. (1998) Magazzù, A., Rebolo, R., Zapatero Osorio, M. R., Martín, E. L., Hodgkin, S. T., 1998, & Hodgkin, S. T. 1998, ApJ, 497, L47
- Marsh et al. (2010) Marsh, K. A., Plavchan, P., Kirkpatrick, J. D., Lowrance, P. J., Cutri, R. M., & Velusamy, T. 2010, arXiv:1006.2506
- Meisenheimer et al. (2011) Meisenheimer, K., Wolf, C. & Nicol, M.-H., 2011, in prep.
- Muench et al. (2002) Muench, A. A., Lada E. A., Lada, C. J., & Alves, J., 2002, ApJ, 573, 366
- Oasa et al. (2006) Oasa, Y., Tamura, M., Nakajima, Y., Itoh, Y., Maihara, T., Iwamuro, F., Motohara, K., Hayashi, S. S., Hayashi, M., Kaifu, N., 2006, AJ, 131, 1608
- Pace et al. (2008) Pace, G., Pasquini, L., & François, P. 2008, A&A, 489, 403
- Pinfield et al. (1997) Pinfield, D. J., Hodgkin, S. T., Jameson, R. F., et al., 1997, MNRAS, 287, 180
- Schmidt et al. (2010) Schmidt, S. J., West, A. A., Hawley, S. L., & Pineda, J. S. 2010, AJ, 139, 1808
- Speziali et al. (2008) Speziali, R., et al. 2008, Proc. SPIE, 7014, 158
- Stern et al. (2007) Stern, D., et al. 2007, ApJ, 663, 677
- Taylor (2006) Taylor, B. J. 2006, AJ, 132, 2453
- West et al. (2008) West, A. A., Hawley, S. L., Bochanski, J. J., Covey, K. R., Reid, I. N., Dhital, S., Hilton, E. J., & Masuda, M. 2008, AJ, 135, 785
- West et al. (2011) West, A. A., et al. 2011, AJ, 141, 97
- York et al. (2000) York, D. G., et al. 2000, AJ, 120, 1579