Star formation in M33 (HerM33es)
Abstract
Within the key project “Herschel M33 extended survey” (HerM33es), we are studying the physical and chemical processes driving star formation and galactic evolution in the nearby galaxy M33, combining the study of local conditions affecting individual star formation with properties only becoming apparent on global scales. Here, we present recent results obtained by the HerM33es team. Combining Spitzer and Herschel data ranging from 3.6 m to 500m, along with H i, H, and GALEX UV data, we have studied the dust at high spatial resolutions of 150 pc, providing estimators of the total infrared (TIR) brightness and of the star formation rate. While the temperature of the warm dust at high brightness is driven by young massive stars, evolved stellar populations appear to drive the temperature of the cold dust. Plane-parallel models of photon dominated regions (PDRs) fail to reproduce fully the [C ii], [O i], and CO maps obtained in a first spectroscopic study of one subregion of M33, located on the inner, northern spiral arm and encompassing the H ii region BCLMP 302.
1 Introduction
M33 is a nearby galaxy located at only 840 kpc with a moderate inclination of , actively forming stars. It has been studied at radio, optical and X-ray wavelengths. Its metallicity is about half solar, similar to the LMC. Using Herschel, M33 provides an exceptional physical resolution of pc at 158m allowing us to resolve the various morphological components of the galaxy. The absence of an active nucleus excludes one possible dust heating mechanism and the shallow metallicity gradient limits the influence of the radial evolution of the metallicity on the emission of the dust. In a first step to study the interstellar medium and its interplay with star formation, we mapped the dust spectral energy distribution over the entire galaxy using SPIRE and PACS (Kramer et al. 2010, Verley et al. 2010, Braine et al. 2010, Boquien et al. 2010, 2011).
In a second step, we have started to use PACS and HIFI to map the emission of [C ii] and other strong far-infrared (FIR) lines along the major axis of M33 (Mookerjea et al. 2011). Observing an extended strip, will allow us to study the ionized, atomic, and molecular phases of the interstellar medium, its life cycle and thermal balance, tracing the formation of molecular clouds and of stars.
Here, we summarize the major results obtained in two recently submitted papers of the HerM33es team. But note that only 8 hours out of the total granted 191 hours of Herschel observing time were observed till end of 2010.
2 Dust heating sources in galaxies: the case of M33
Dust emission in galaxies can have several unrelated origins: (1) Massive stars in star-forming regions heat the dust. (2) A large scale diffuse emission due to cirrus being heated by (a) energetic radiation escaping from individual star-forming regions and/or (b) the general radiation field of evolved stars. (3) Hot grains in the photosphere or circumstellar atmosphere of mass-loosing stars also contribute.
IR emission acts as a star-formation tracer even at high redshifts. As the diffuse emission can represent up to nearly 90% of the IR flux in Sa galaxies, it can lead to an error on the SFR up to an order of magnitude depending on its origin.
In Boquien et al. (2011), we have used Herschel PACS and SPIRE observations in combination with Spitzer IRAC and MIPS data, GALEX FUV data, as well as ground-based H and HI maps of M33, in order to characterize the warm and cold dust populations. Given the high spatial resolution of even the longest wavelength bands (pc at 500m), we perform a pixel-to-pixel analysis of the data in order to constrain the dust heating sources. To do so, we have convolved all the data to the resolution of the SPIRE 500m band. The maps have then been registered to common pixels of a size of . For the analysis, only pixels with a signal-to-noise ratio of at least 3 have been selected. The limiting factor is here the PACS bands which are relatively shallow. In the subsequent analysis at least pixels have been selected in each case.
We have studied the evolution of the dust colors both as a function of the position in the galaxy (including the radial distance) and the brightness.
To determine the TIR luminosities, we have fitted the models of Draine & Li (2007) to the SED of each spatial pixel from 8m to 500 m and integrated the model from 1 m to 1 mm. In addition, we derived the star formation rate (SFR) from Calzetti et al. (2007) combining H and the 24 m emission. Plotting the derived SFR against just one IR band, we find that the emission at 8 m is sublinear, confirming previous results. The emission near the peak of the emission between 70 m and 160 m is a linear estimator of the SFR. Finally, the emission in SPIRE bands is an increasingly super linear estimator of the SFR with an ever larger scatter around the best fit.
In summary, we found the following results:
-
1.
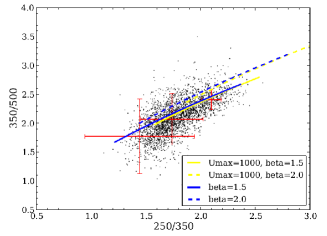
The colors of the warm and cold dust components seem to be predominantly driven by the evolution of the radiation field.
-
2.
Combining any set of Spitzer and Herschel bands, we have provided correlations to estimate both the TIR brightness and the SFR, extending the results of Boquien et al. (2010) and Verley et al. (2010), which is of importance for the study of high redshift galaxies.
-
3.
The color trends of the warm and the cold dust show that they are heated by different sources. At higher SFR, the warm dust temperature seems to be driven by star formation. As star formation weakens, the temperature is increasingly driven by another component, most likely the evolved stellar populations. The cold dust temperature seems to be driven by the old stellar population, with a tight correlation with the local stellar mass.
3 [C ii] and [O i] at 50 pc scales in the northern arm of M33
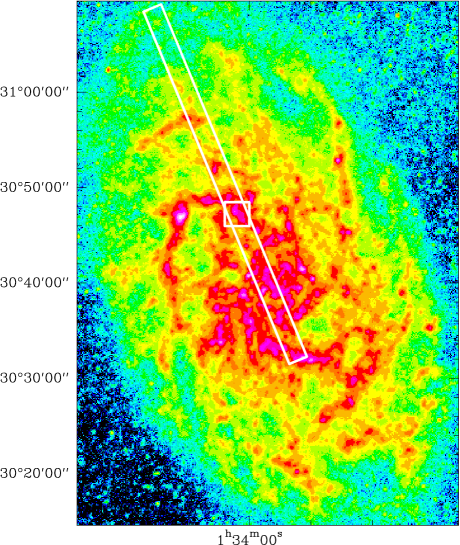
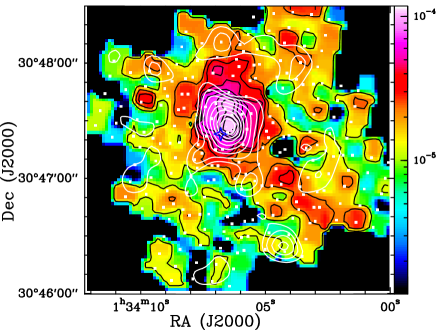
In Mookerjea et al. (2011), we have used PACS on Herschel to observe the emission of the far-infrared lines [C ii] (158 m), [O i] (63 m), [N ii] (122 m), [N iii] (57 m) in a region of the northern spiral arm of M 33, centered on the H ii region BCLMP 302 (Figure 3).
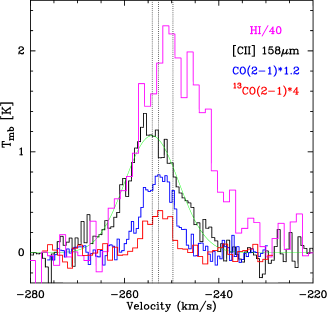
At the peak of H emission, we have observed in addition a velocity resolved [C ii] spectrum using HIFI (Figure 4). The aim of this work is to understand the relative contributions of the different phases of the ISM to [C ii] cooling, as well as the correlation of the [C ii] emission with the star formation rate (SFR), derived from H and 24 m emission observed with Spitzer, at scales of corresponding to pc, i.e. at scales of individual giant molecular clouds (GMCs). We have obtained the distribution of [C ii] and [O i] (63 m) emission from the spiral arm and the inter-arm regions, and detected the [N ii](122 m) and [N iii](57 m) lines at several positions. These data are quantitatively compared with continuum maps observed with PACS 100 & 160 m and of CO and H i data, at the same resolution.
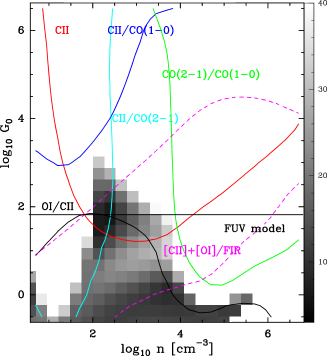
The [C ii] emission shows strong correlation with the TIR intensity only within the H ii region and is well correlated with SFR along the spiral arm. The gas heating efficiency, estimated as the ratio between [C ii] and the TIR continuum, varies between 0.07 and 2%. We used the CLOUDY models of ionized and photon dominated regions (Ferland et al. 1998) and the known properties of BCLMP 302, to estimate that upto 30% of the [C ii] emission stems from the H ii region. Next, we used plane-parallel constant density PDR models of Kaufman et al. (1999), to interpret the observed intensities of far-infrared and millimeter lines at the H position (Figure 5). Both, the FIR continuum and results of PDR modeling indicate that a FUV field of G0 is heating the dust and gas at the H peak position. Over the surface of the studied region, the bulk of [C ii] emission originates from PDRs at cloud surfaces, while the contributions from the atomic and molecular medium account for less than 10% of the observed [C ii] emission.
The rather poor fit of the intensity ratios towards the H peak shows the shortcomings of a plane-parallel single density PDR model. First tests using KOSMA- PDR models (Röllig et al. 2006) of spherical clumps with density gradients do better reconcile the observations. In a forthcoming paper, we shall discuss new HIFI [C ii] data at other positions in the BCLMP 302 region using much more detailed PDR models, also taking into account the effects of sub-solar metallicity.
References
- [2010] Boquien, M., Calzetti, D., Kramer, C. et al. 2010, A&A, 518, 70
- [2011] Boquien, M., Calzetti, D., Combes, F. et al. 2011, AJ, submitted
- [2010] Braine, J., Gratier, P., Kramer, C. et al. 2010, A&A, 518, 69
- [Calzetti et al.(2007)] Calzetti, D., Kennicutt, R.C., Engelbracht, C.W. et al. 2007, ApJ, 666, 870
- [Draine et al.(2007)] Draine, B.T., Li, A. 2007, ApJ, 657, 810
- [Ferland et al.(1998)] Ferland, G. J., Korista, K. T., Verner, D. A., et al. 1998, PASP, 110, 761
- [Kaufman et al.(1999)] Kaufman, M. J., Wolfire, M. G., Hollenbach, D. J., et al. 1999, ApJ, 527, 795
- [2010] Kramer, C., Buchbender, C., Xilouris, E.M. et al. 2010, A&A, 518, 67
- [2011] Mookerjea, B., Kramer, C., Buchbender, C. et al. 2011, A&A, submitted
- [Röllig et al.(2006)] Röllig, M., Ossenkopf, V., Jeyakumar, S. et al. 2006, A&A, 451, 917
- [2010] Verley, S., Relaño, M., Kramer, C. et al. 2010, A&A, 518, 68