Trans-Canada Slimeways: Slime mould imitates the Canadian transport network
Abstract.
Slime mould Physarum polycephalum builds up sophisticated networks to transport nutrients between distant part of its extended body. The slime mould’s protoplasmic network is optimised for maximum coverage of nutrients yet minimum energy spent on transportation of the intra-cellular material. In laboratory experiments with P. polycephalum we represent Canadian major urban areas with rolled oats and inoculated slime mould in the Toronto area. The plasmodium spans the urban areas with its network of protoplasmic tubes. We uncover similarities and differences between the protoplasmic network and the Canadian national highway network, analyse the networks in terms of proximity graphs and evaluate slime mould’s network response to contamination.
Keywords: biological networks, vehicular transport networks, slime mould, bio-inspired computing
1. Introduction
The increase of long-distance travel and subsequent reconfiguration of vehicular and social networks [14] requires novel and unconventional approaches towards analysis of dynamical processes in complex transport networks [7], routing and localisation of vehicular networks [21], optimisation of interactions between different parts of a transport network during scheduling road expansion and maintenance [26], and shaping of transport network structure [8]. In the present paper we attempt to build viable analogies between biological and human-made transport networks and project behavioural traits of biological networks onto existing vehicular transport networks.
While choosing a biological object we want it to be experimental laboratory friendly, easy to cultivate and handle, and convenient to analyse its behaviour. Ants would indeed be the first candidate, and a great deal of impressive results has been published on ant-colony inspired computing [10, 24], however ant colonies require substantial laboratory resources, experience and time in handling them. Actually very few, if any, papers were published on experimental laboratory implementation of ant-based optimisation, the prevalent majority of publications being theoretical. There is however an object which is extremely easy to cultivate and handle, and which exhibits remarkably good foraging behaviour and development of transport networks. This is the plasmodium of Physarum polycephalum.
Plasmodium is a vegetative stage of acellular slime mould P. polycephalum, a syncytium, that is, a single cell with many nuclei, which feeds on microscopic particles [25]. The plasmodium is a unique user-friendly biological substrate from which experimental prototypes of massive-parallel amorphous biological computers are designed [4]. During its foraging behaviour the plasmodium spans scattered sources of nutrients with a network of protoplasmic tubes. The protoplasmic network is optimised to cover all sources of food and to provide a robust and speedy transportation of nutrients and metabolites in the plasmodium body. The plasmodium’s foraging behaviour can be interpreted as computation. Data are represented by spatial configurations of attractants and repellents, and results of computation by structures of a protoplasmic network formed by the plasmodium on the data sets [16, 18, 4]. The problems solved by plasmodium of P. polycephalum include shortest path [16, 18], implementatiton of storage modification machines [1], Voronoi diagram [23], Delaunay triangulation [4], logical computing [29], and process algebra [22]; see overview in [4].
Previously [2] we have evaluated a road-modeling potential of P. polycephalum, however no conclusive results were presented back in 2007. A step forward, namely, biological-approximation, or evaluation, of human-made road networks was done in our previous papers on approximation of motorways/highways in the United Kingdom [3], Mexico [5] and the Netherlands [6] by plasmodium of P. polycephalum. For all three countries we found that, in principle, the network of protoplasmic tubes developed by plasmodium matches, at least partly, network of human-made transport arteries. The shape of a county and the exact spatial distribution of urban areas (represented by source of nutrients) may play a key role in determining the exact structure of the plasmodium network. Also we suspect that a degree of matching between Physarum networks and motorway networks is determined by original government designs of motorways in any particular country. This is why it is so important to collect data on development of plasmodium networks in all major countries, and then undertake a comparative analysis.
What are unique properties of the Canadian transport system? The Canadian Highway System gives us a good example of a logically designed transportation system whose key goal is to connect all the provinces together by highways. The highway network was built as a federal-provincial territorial cooperative effort with great effort taken in coordinating work on different parts. Another attractive property of the highway system is that it was designed to provide an access to remote areas where no spots of high population density exist.
The paper is structured as follows. We present experimental techniques used in Sect. 2. Properties of protoplasmic networks built by P. polycephalum are discussed in Sect. 3. We compare slime mould networks with the Canadian highway network in Sect. 4 and slime mould and human-made networks with proximity graphs in Sect. 5. In Sect. 6 we show how the slime mould transport network restructures in response to a spreading contamination.
2. Methods
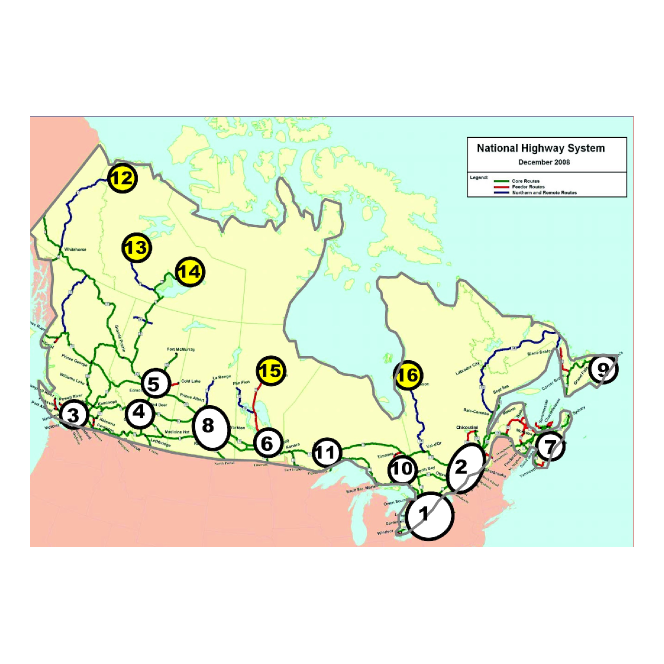
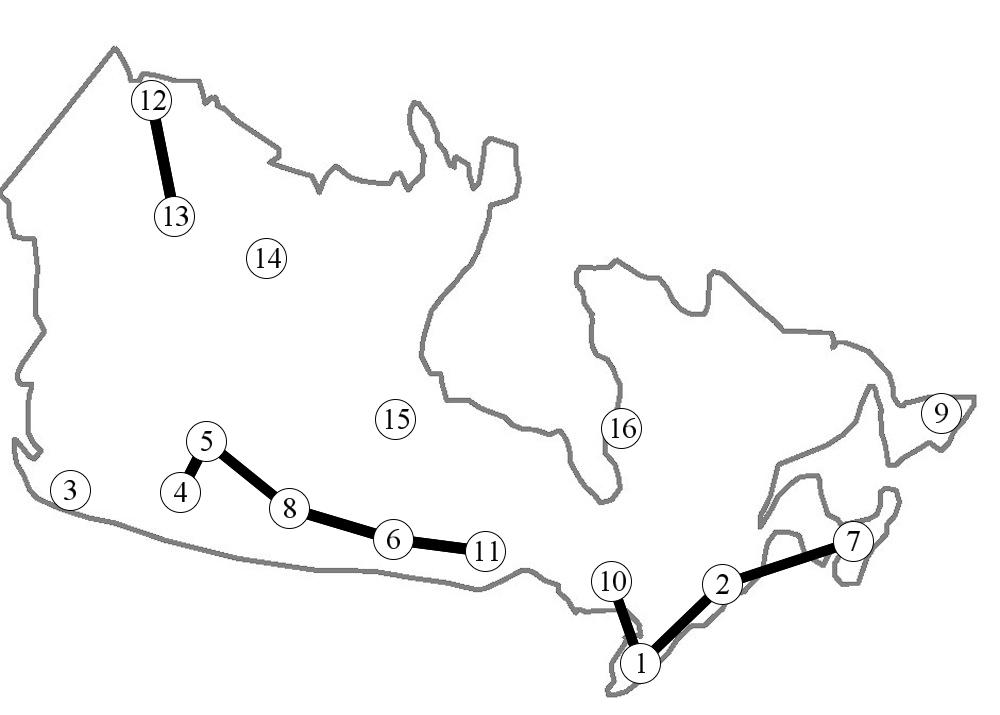
The plasmodium of P. polycephalum is cultivated in plastic containers, on paper kitchen towels sprinkled with still drinking water and fed with oat flakes (Asda’s Smart Price Porridge Oats). For experiments we use cm polyestyrene square Petri dishes. Agar plates, 2% agar gel (Select agar, Sigma Aldrich), are cut in a shape of Canada. We consider the elven most populated urban areas of Canada (Fig. 1a) and five transport nodes:
-
(1)
Toronto area (including Hamilton, London, St. Catharines Niagara, Windsor, Oshawa, Barrie, Guelph, and Kingston)
-
(2)
Montreal area (incuding Ottawa Gatineau, Quebec City, Sherbrooke, Trois-Rivieres)
-
(3)
Vancouver area (including Victoria, Abbotsford, Kelowna)
-
(4)
Calgary
-
(5)
Edmonton
-
(6)
Winnipeg
-
(7)
Halifax-Moncton
-
(8)
Saskatoon-Regina
-
(9)
St. John’s
-
(10)
Sudbury
-
(11)
Thunder Bay
-
(12)
Inuvik
-
(13)
Wrigley
-
(14)
Yellowknife
-
(15)
Thompson
-
(16)
Radisson
The last five entries from Inuvik to Radisson, are not highly populated urban areas. They are transport nodes added for completeness, i.e. to present slime mould with the same number of principle transport nodes as the human-made highways system (Fig. 1a). Some transport nodes as Fort McMurray, La Ronge, Flin Flon, and so on, are not included in the list due to their proximity to already chosen major urban areas.
To project regions of onto agar gel we place oat flakes in the positions of these regions of (Fig. 1). In each experiments we tried to match the size and shape of areas in (Fig. 1) by selecting rolled oat of corresponding size and shape. At the beginning of each experiment a piece of plasmodium, usually already attached to an oat flake in the cultivation box, is placed in the Toronto area (region 1 in Fig. 1a). The Petri dishes with plasmodium are kept in darkness, at temperature 22-25 C, except for observation and image recording. Periodically (usually in 12 h or 24 h intervals) the dishes are scanned in Epson Perfection 4490. We undertook 23 experiments.
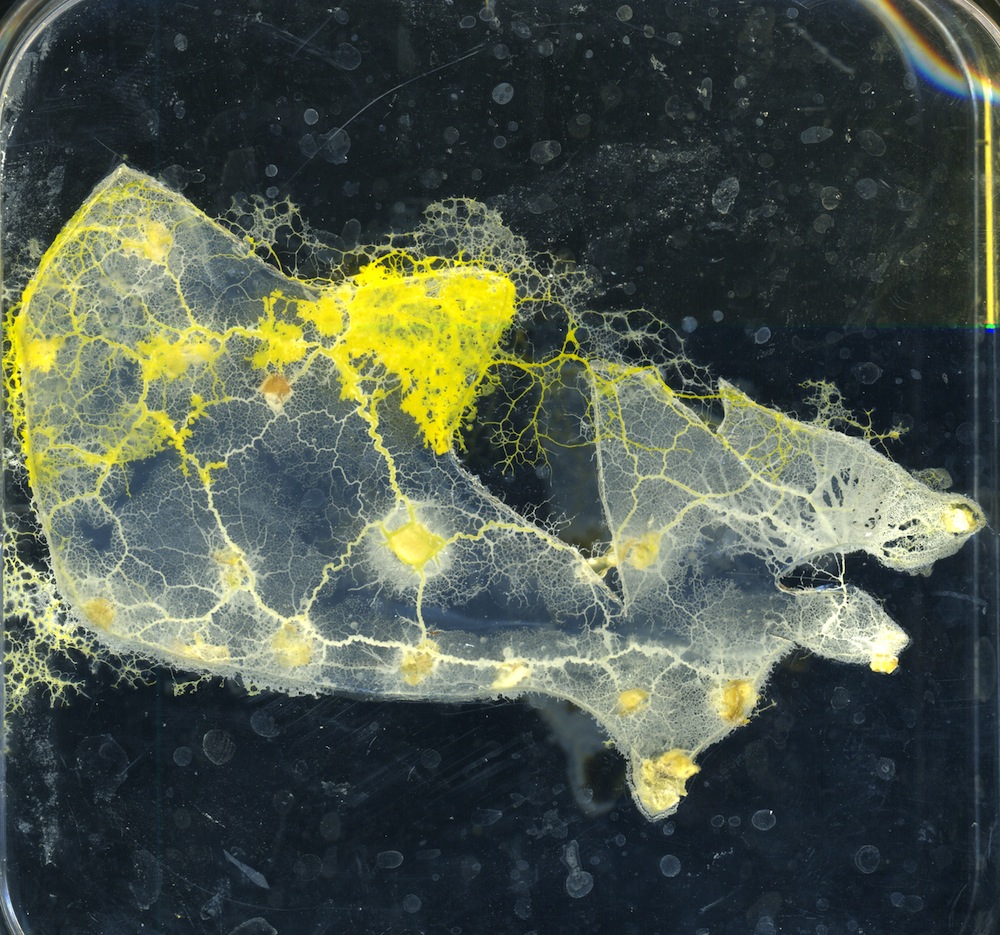
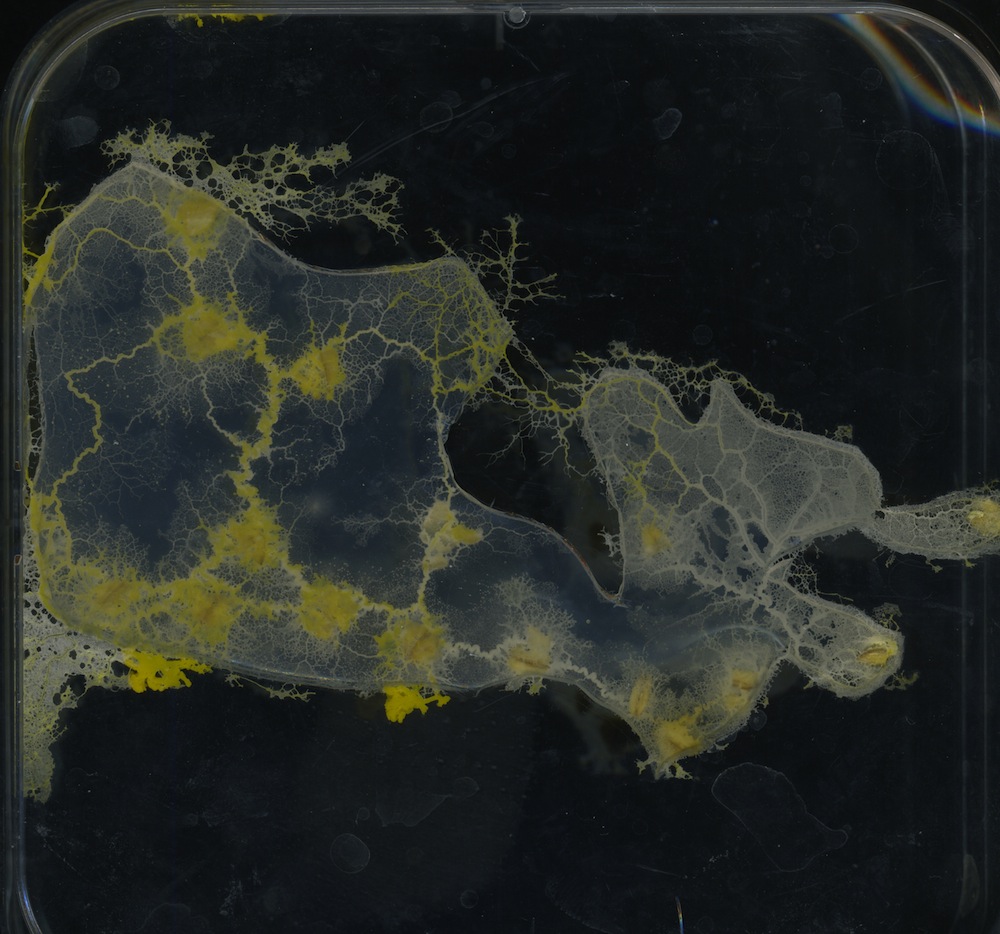
3. Foraging on urban areas
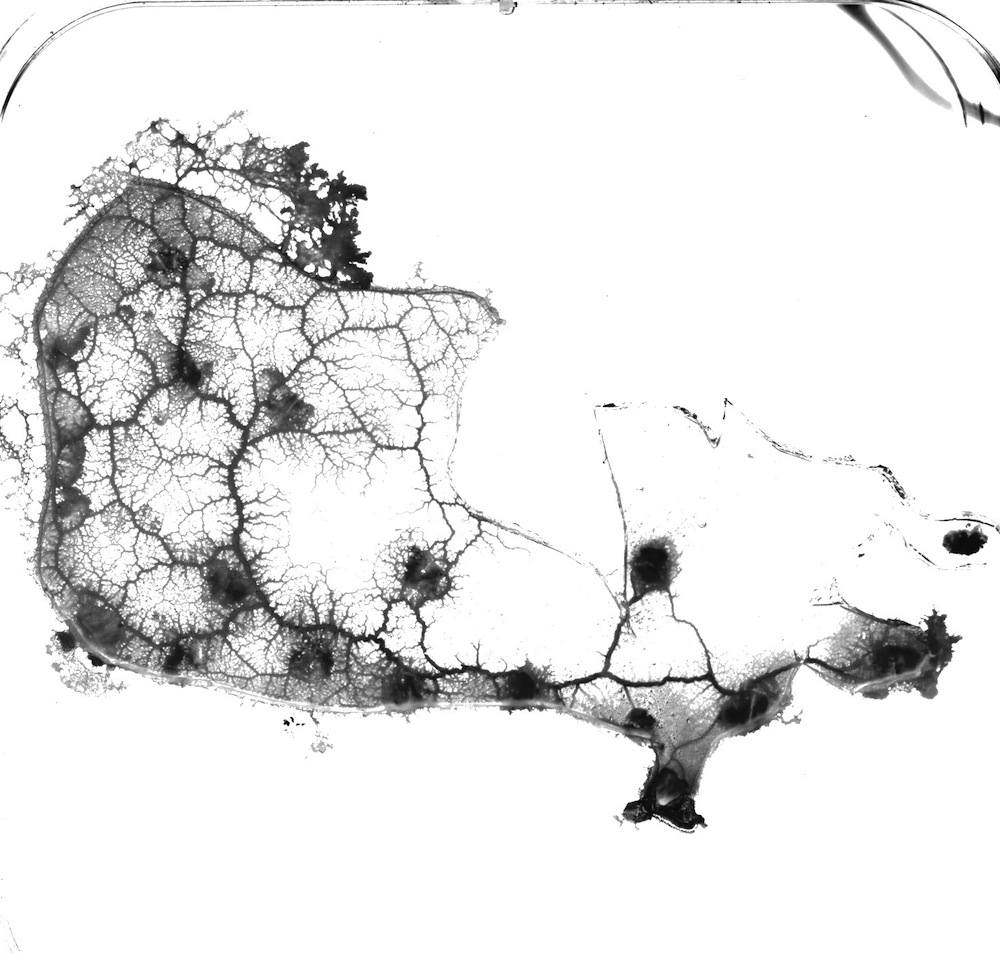
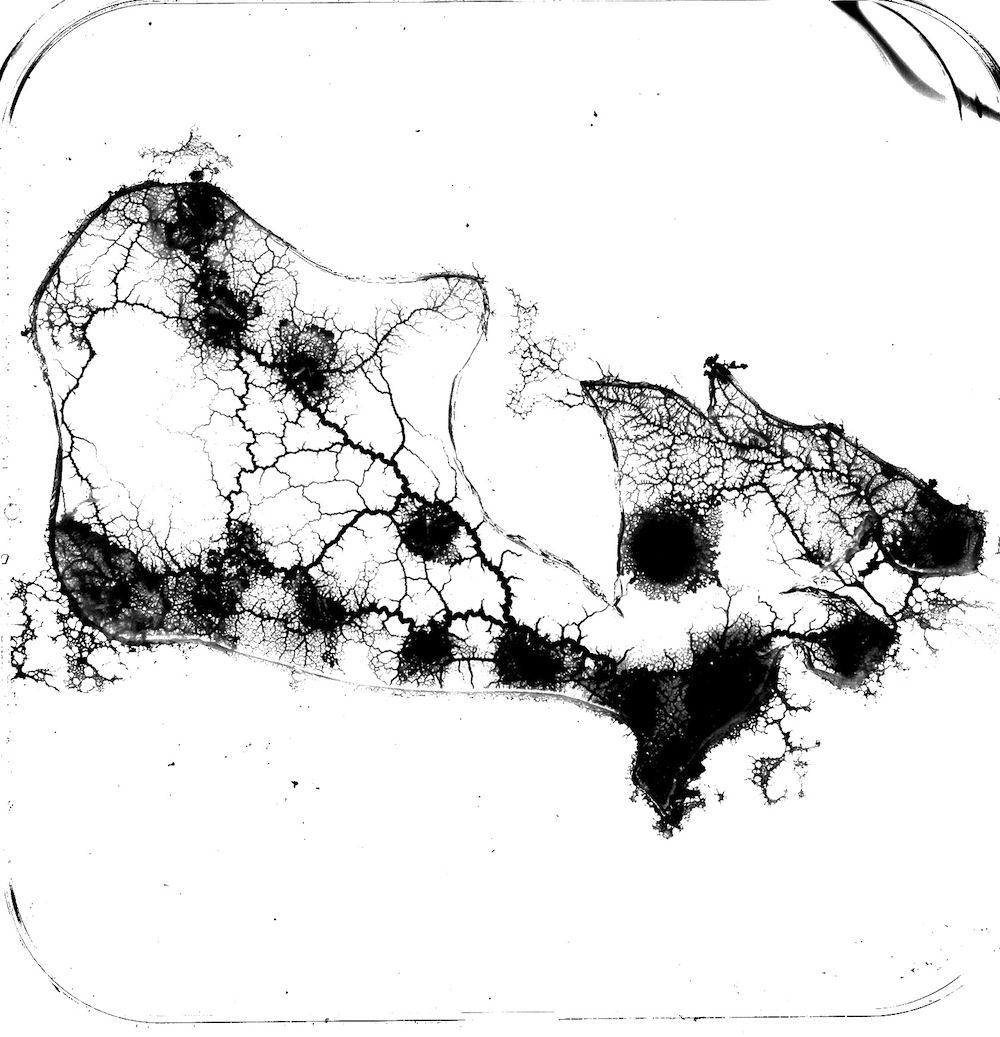
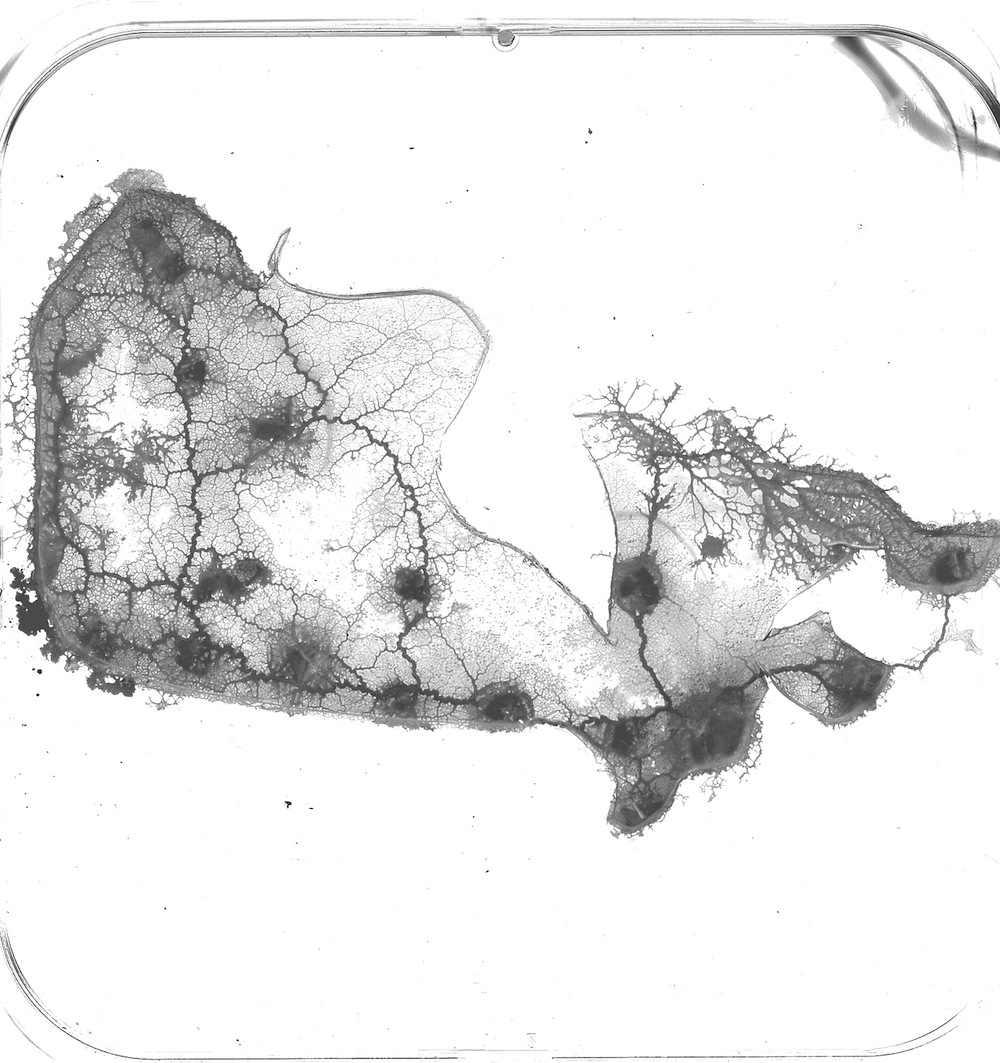
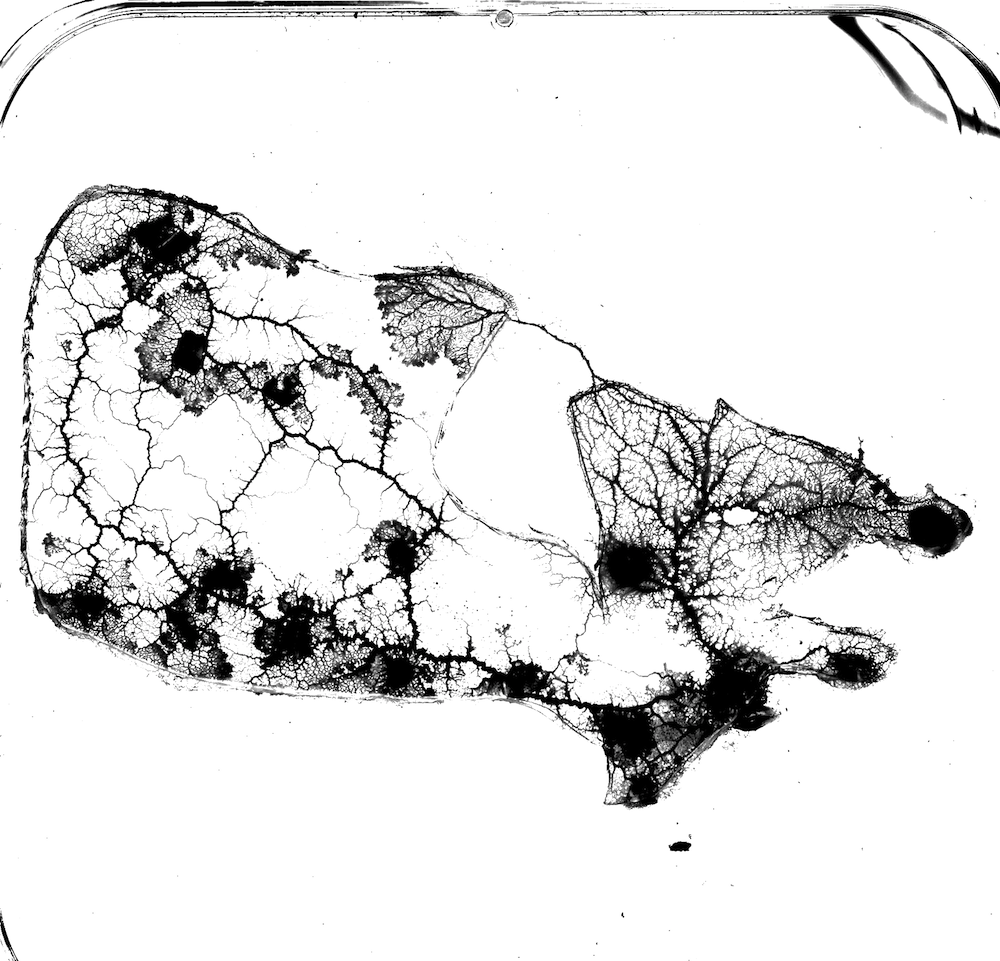
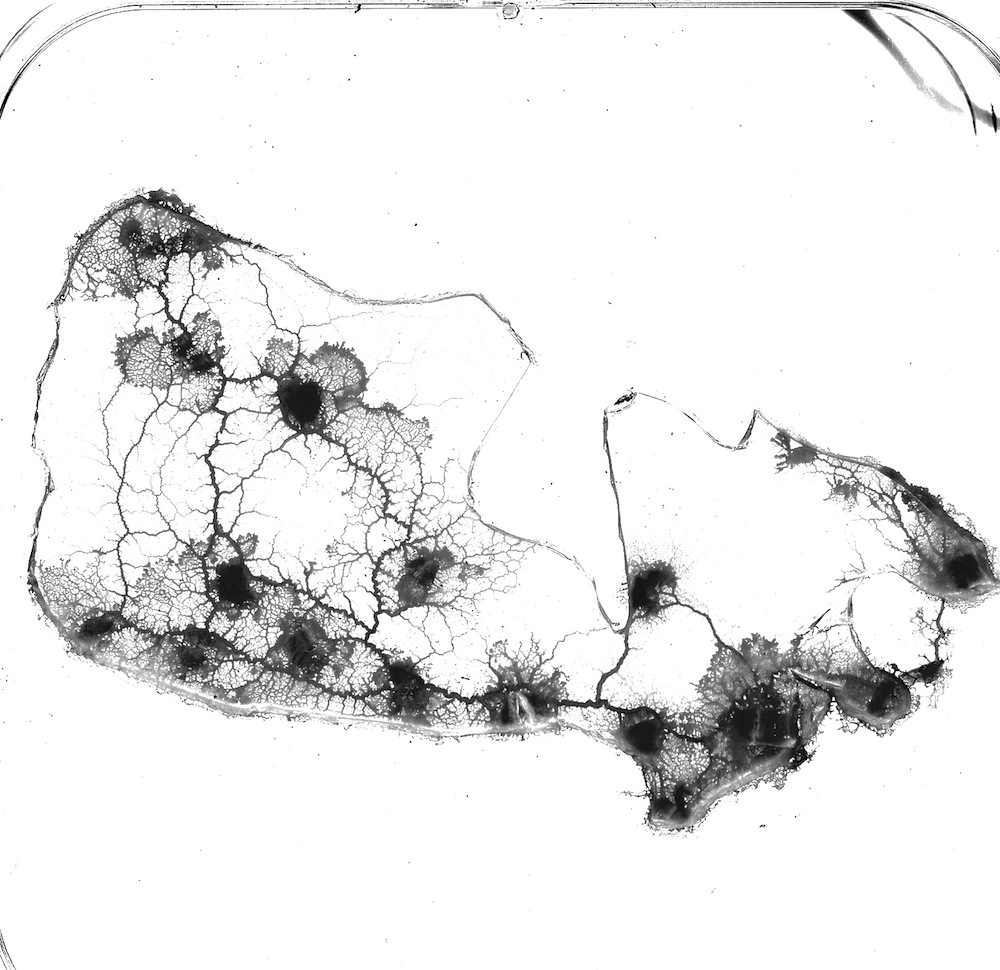
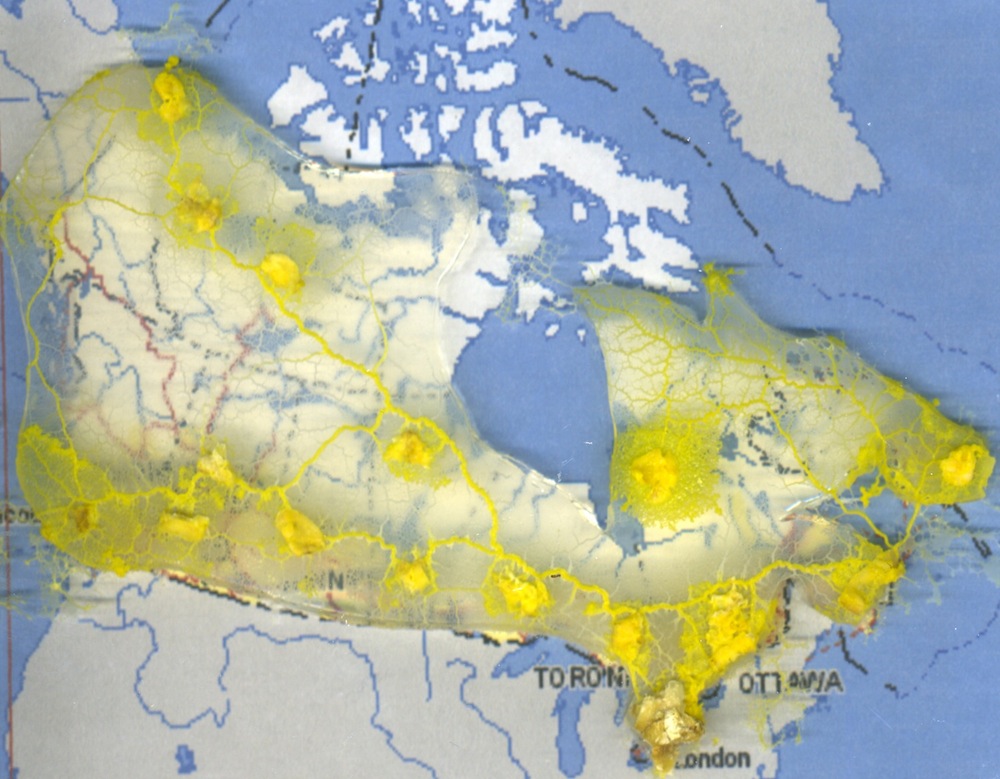
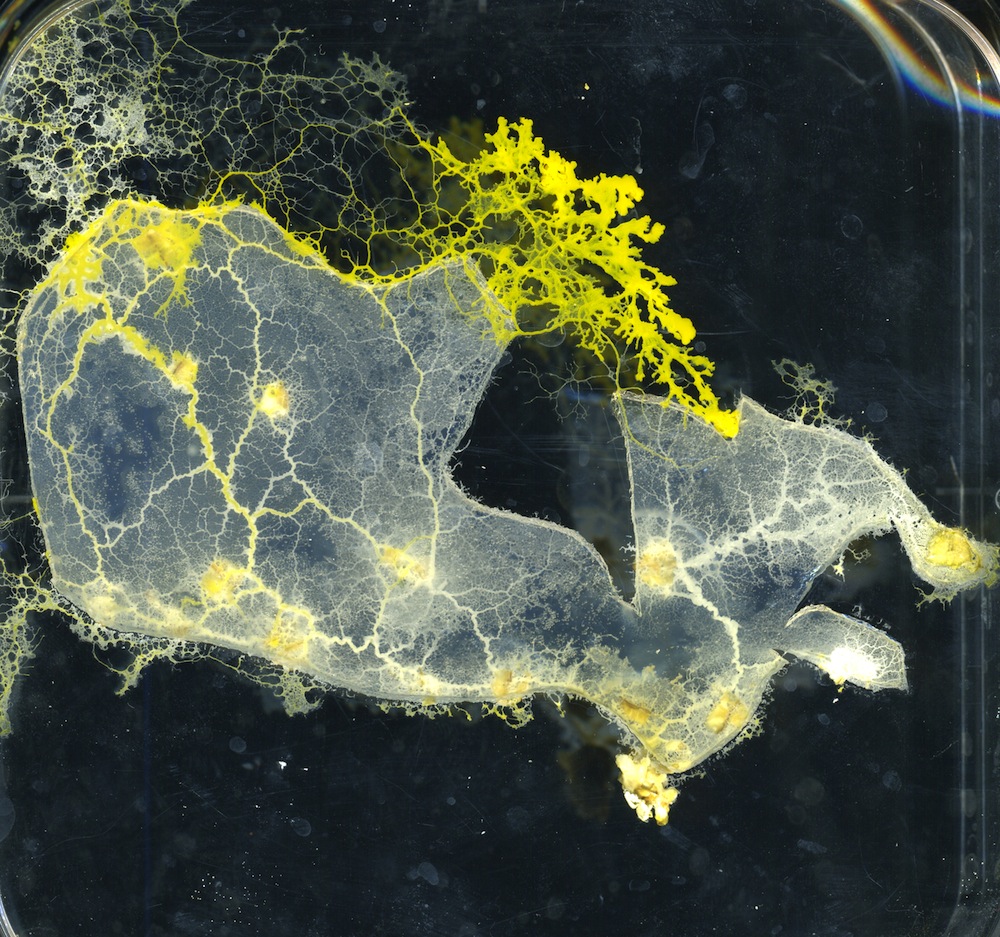
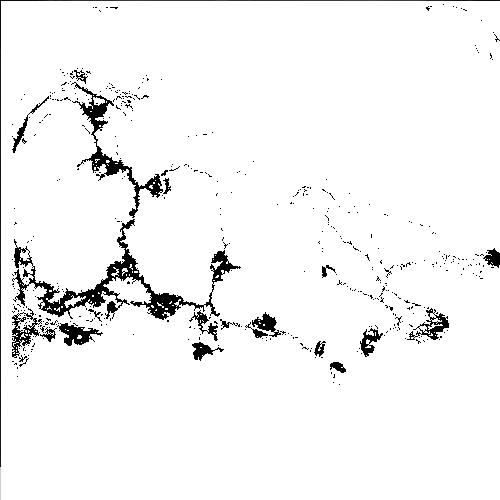
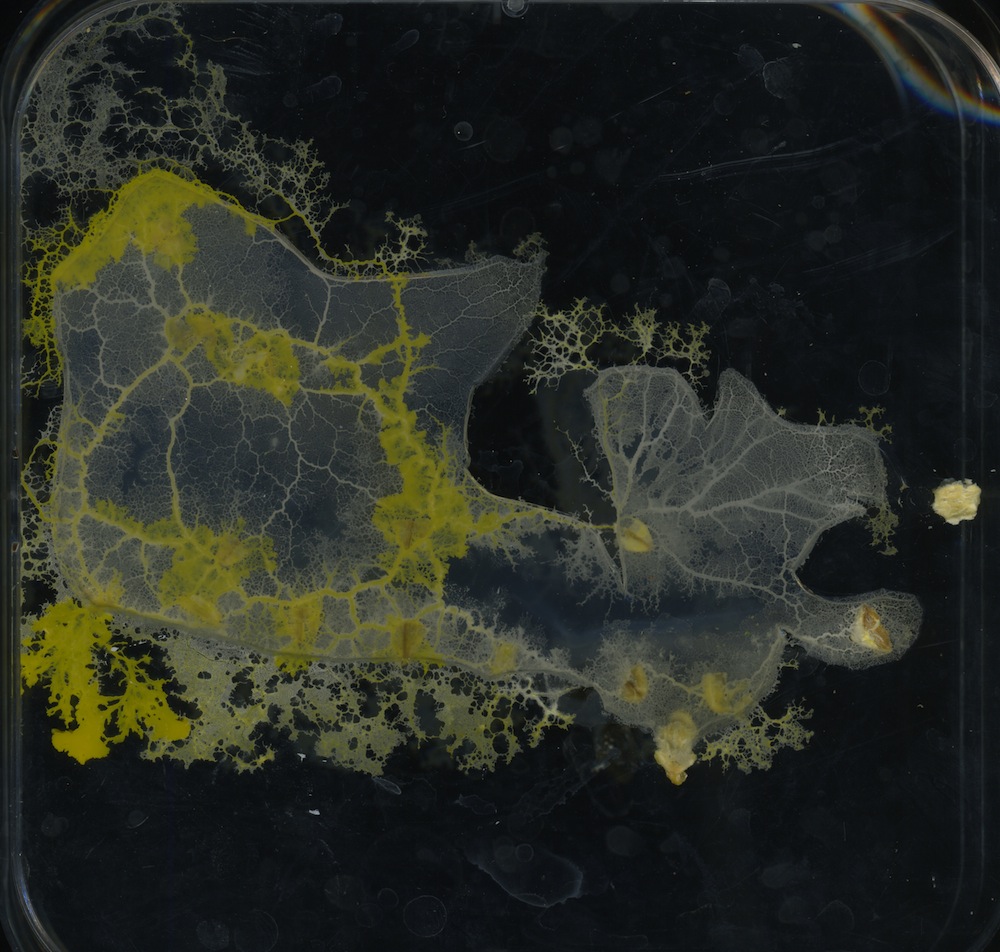
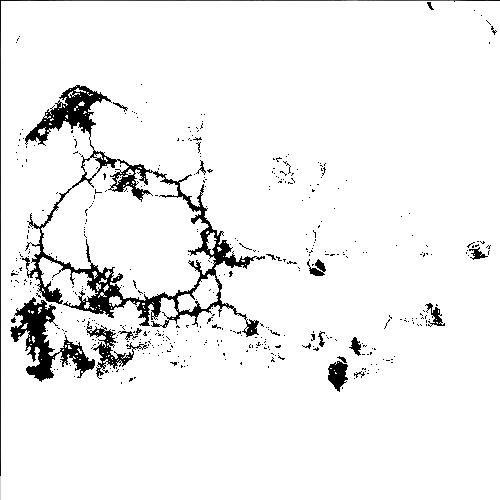
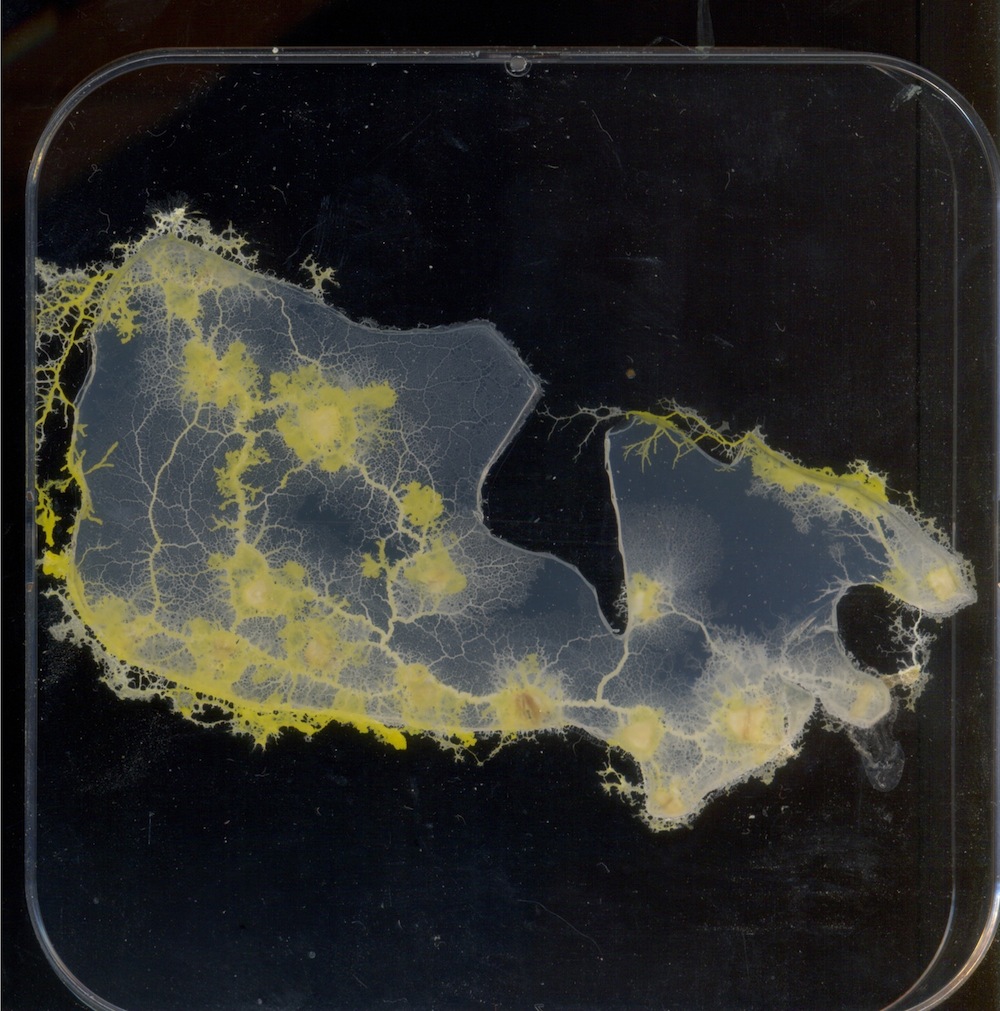
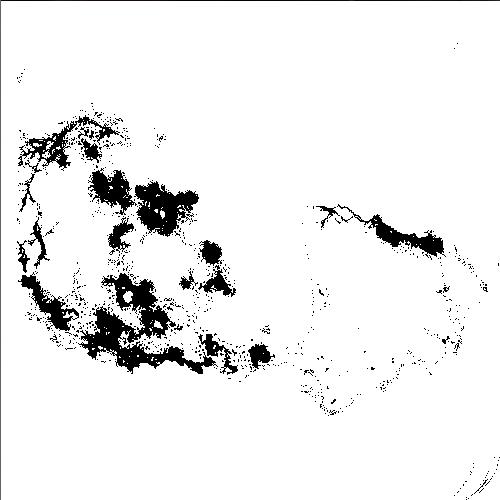
It usually takes the plasmodium of P. polycephalum 2-5 days to span all urban areas. How fast the plasmodium colonises the space depends on many unknown factors, including seasonal variations, plasmodium’s age, etc. ’Younger’ plasmodia, which were just recently ’woken up’ from the sclerotium phase do usually colonise the experimental arena quicker than old plasmodia, which were replanted several times in culture boxes. Images of protoplasmic networks presented in the paper are taken when all oat flakes, representing , were colonised by plasmodium. Examples of the protoplasmic networks are shown in Fig. 2.
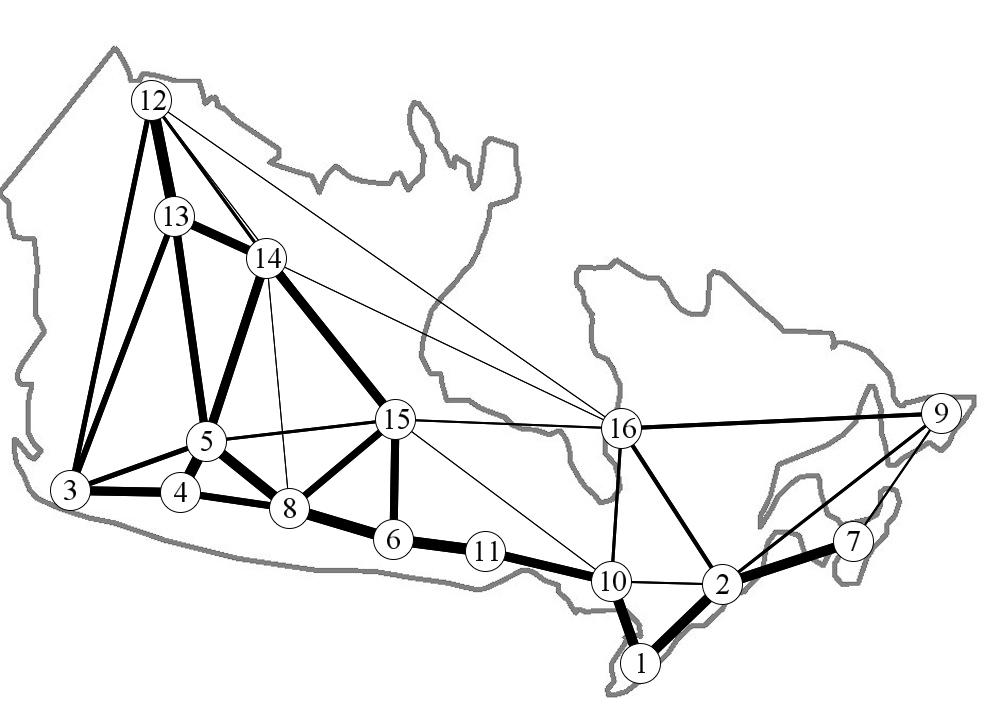

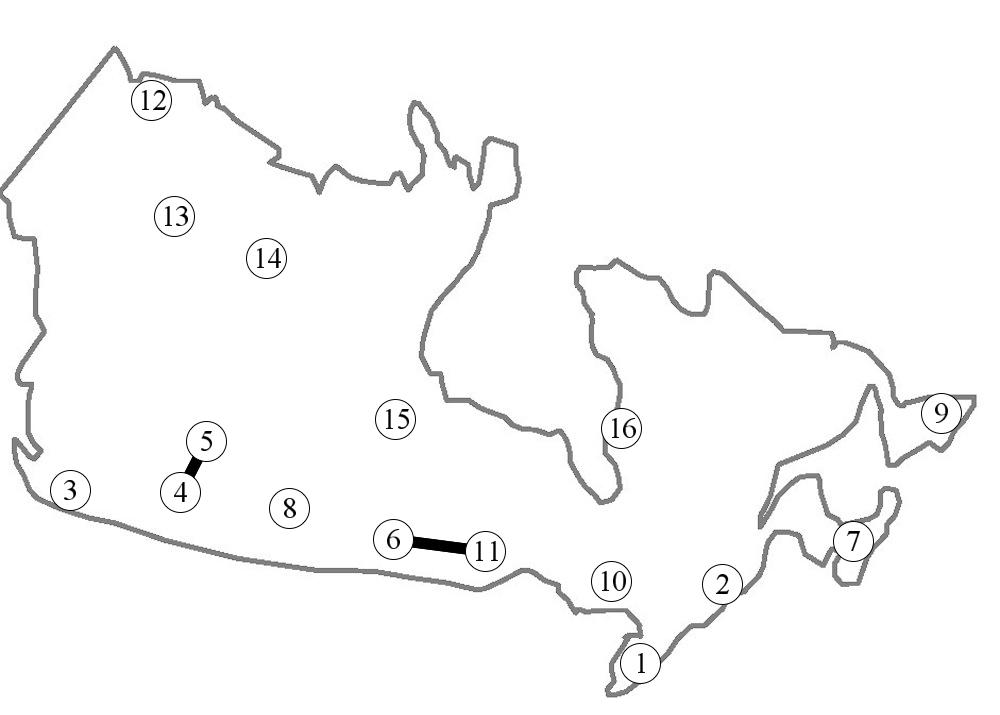
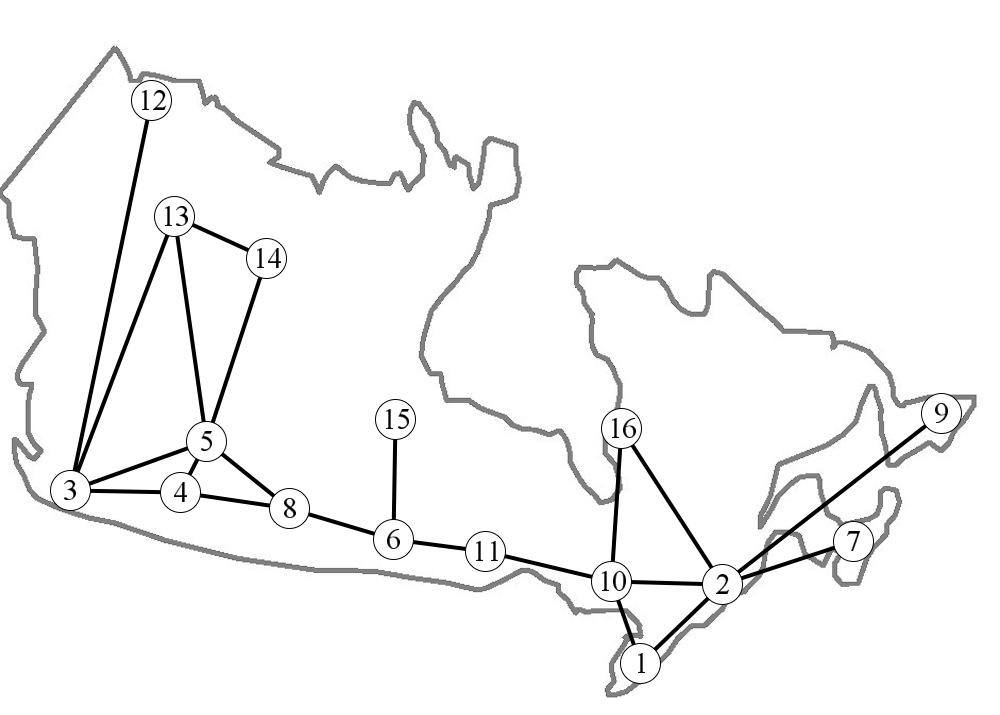
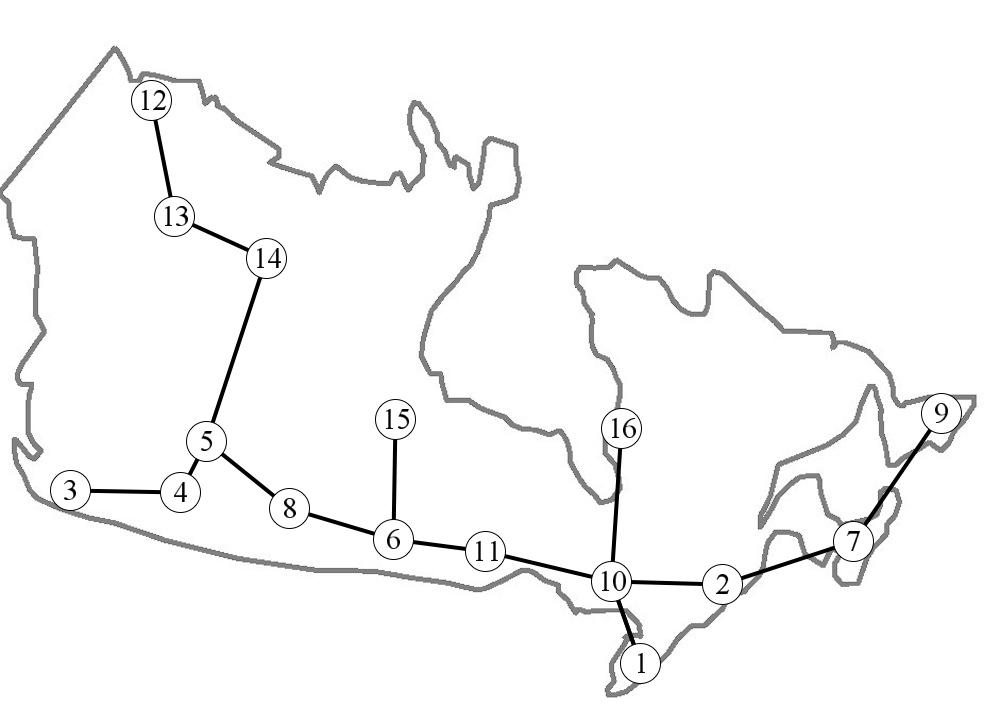
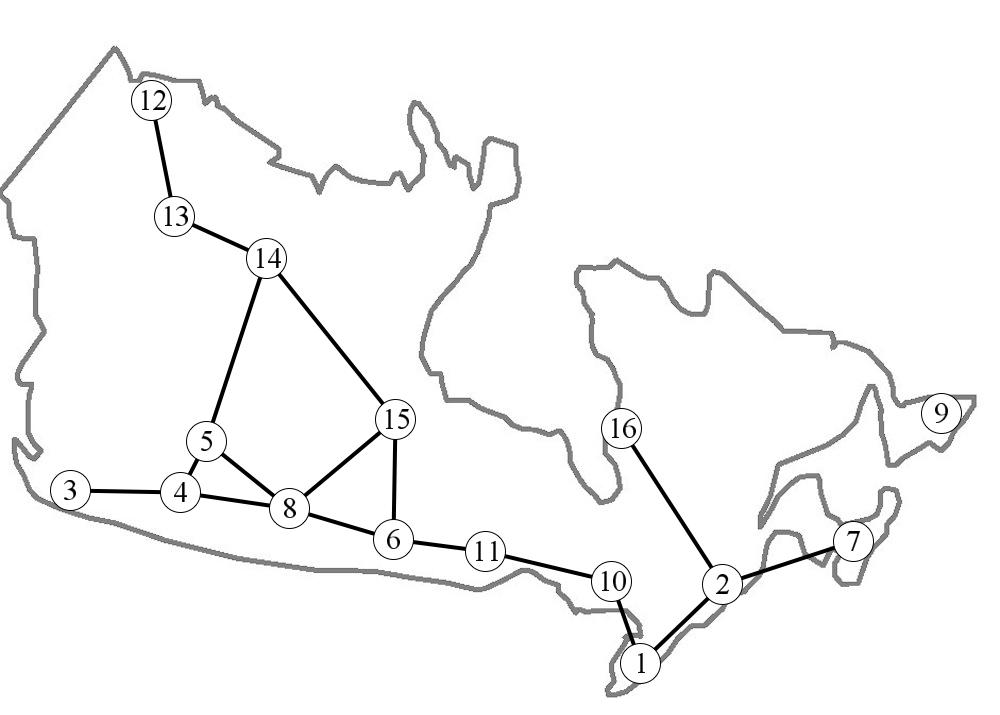
As every living creature does, the plasmodium of P. polycephalum rarely repeats its foraging pattern, and almost never builds exactly the same protoplasmic network twice. To generalise our experimental results we constructed a Physarum graph with weighted-edges. A Physarum graph is a tuple , where is a set of urban areas, is a set edges, and associates each edge of with a probability (or weights). For every two regions and from there is an edge connecting and if a plasmodium’s protoplasmic link is recorded at least in one of experiments, and the edge has a probability calculated as a ratio of experiments where protoplasmic link occurred in the total number of experiments . For example, if we observed a protoplasmic tube connecting areas and in 5 experiments, the weight of edge will be . We do not take into account the exact configuration of the protoplasmic tubes but merely their existence. Further we will be dealing with threshold Physarum graphs . The threshold Physarum graph is obtained from Physarum graph by the transformation: . That is all edges with weights less than or equal to are removed. Examples of threshold Physarum graphs for various values of are shown in Fig. 3.
A ’raw’ Physarum graph is a non-planar graph due to the presence of protoplasmic tube connecting Saskatoon-Regina (8) with Yellowknife (14) (Fig. 3a). It also exhibits two cross-Canada transport links Inuvik (12) to Radisson (16) and Sudbury (10) to Yellowknife (14). Nevertheless, these are links that might be considered as senseless from a geographical point of view because they are crossing massive of mountains and forests.
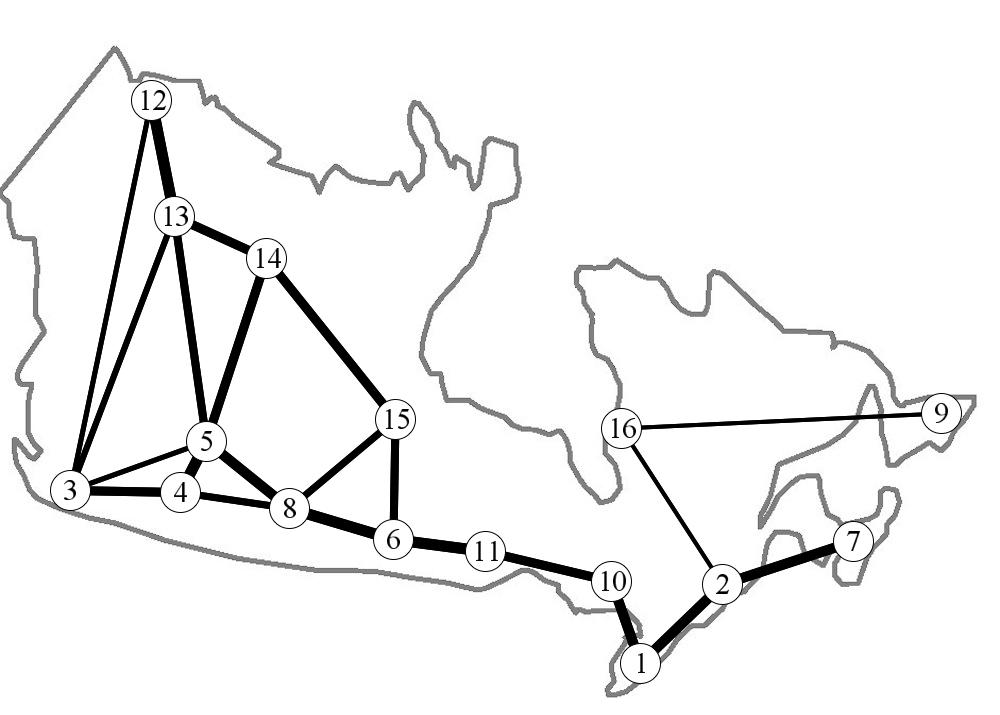
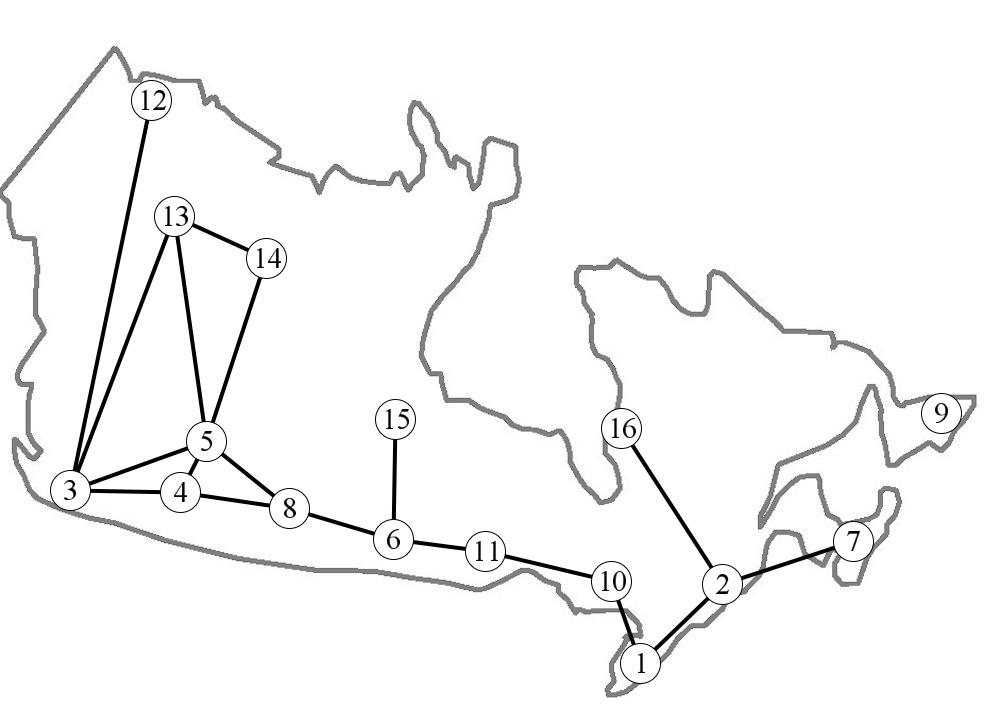
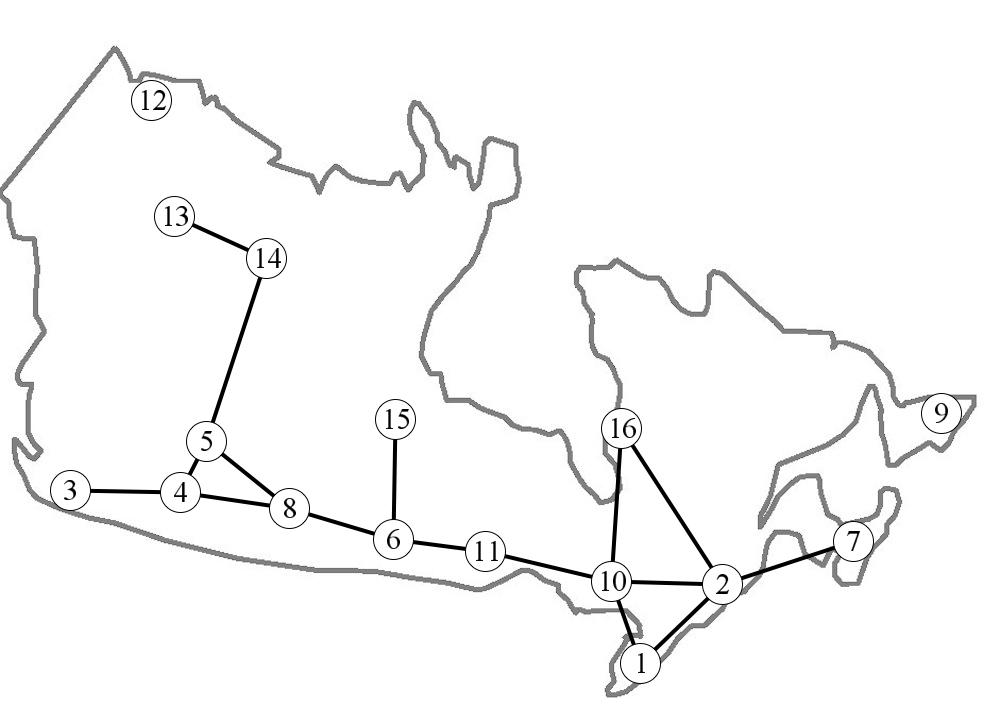
All three links disappear when we increase to 8 (Fig. 3b). Four more links become trimmed off when : Sudbury (10) — Thompson (15), Montreal area (2) — Sudbury (10), Sudbury (10) — Radisson (16), Montreal area (2) — St. John’s (9).
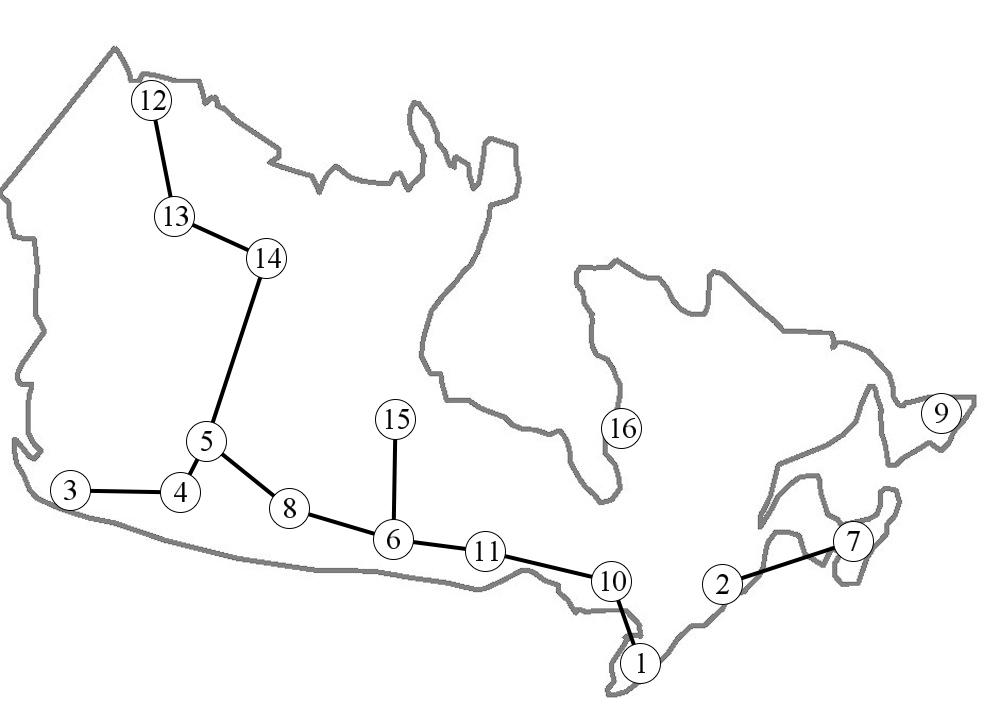
is the last connected graph in a series of threshold Physarum graphs, , . Urban areas St. Johns’s (9) and Radisson (16) become isolated in due to the disappearance of transport links from the Montreal area (2) to Radisson (16) and from Radisson to St. John’s (9) (Fig. 3c).
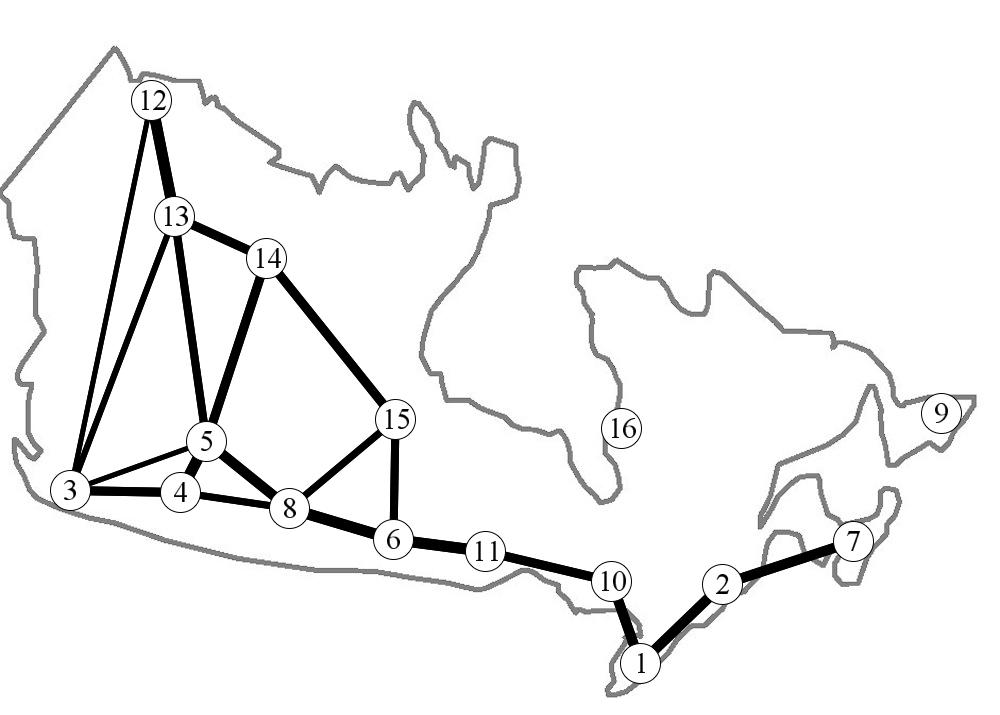
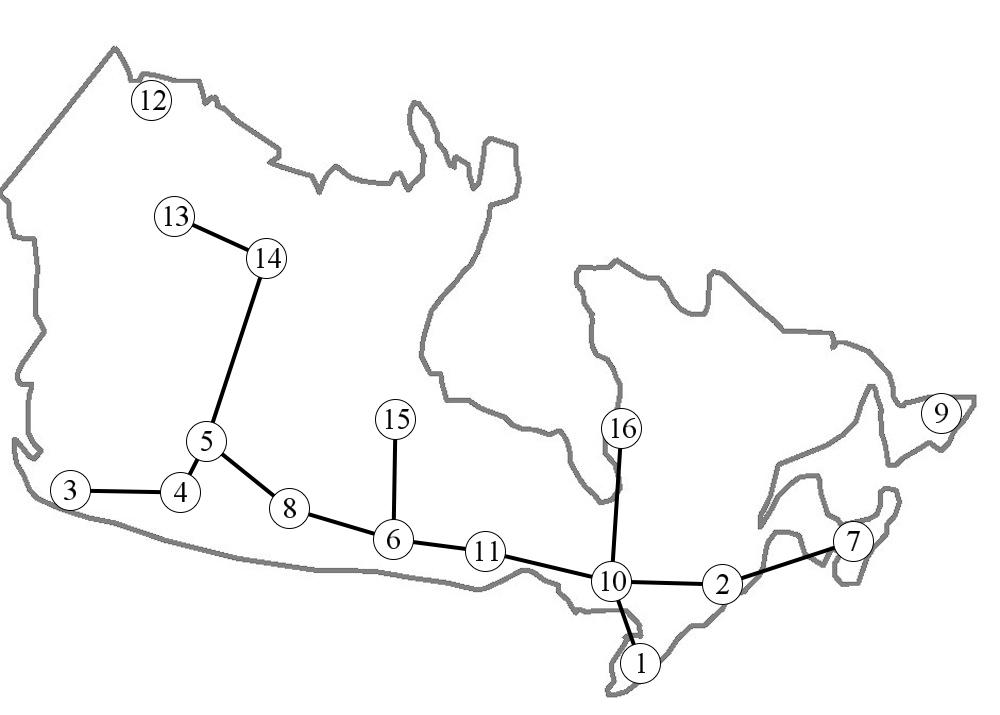
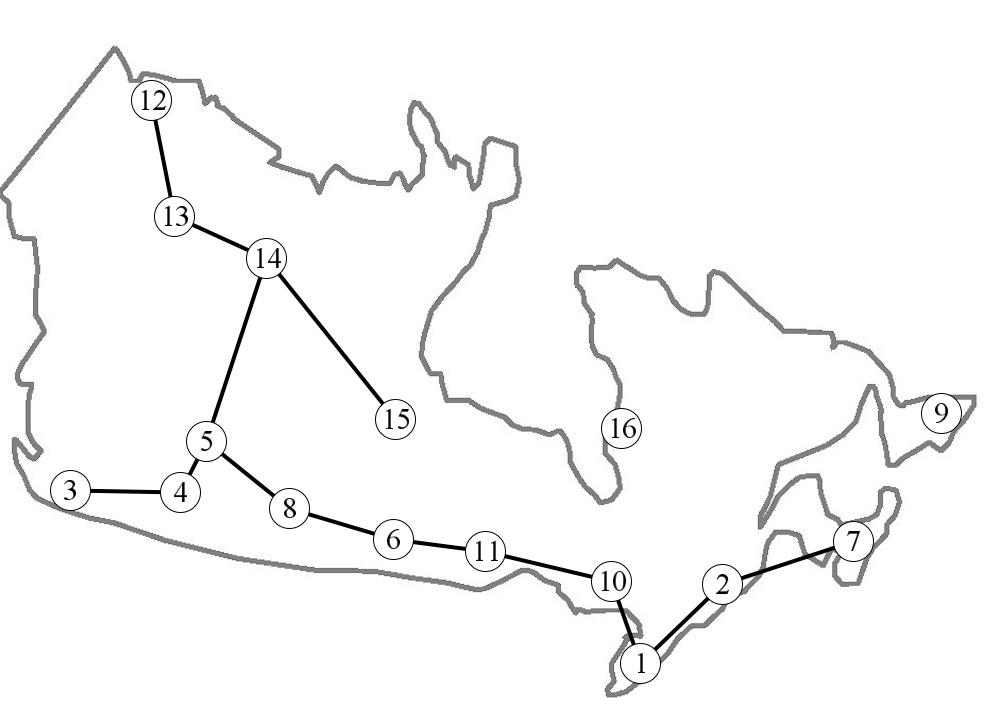
The Physarum graph splits into a tree and two isolated nodes for (Fig. 3d). Five long distance routes from urban areas to transport nodes are removed: Vanvouver area (3) – Inuvik (12), Vancouver area — Wrigley (13), Edmonton (5) — Wrigley, Saskatoon-Regina (8) — Thompson (15), Winnipeg (6) — Thompson; and, two short-distance routes between major urban areas: Vancouver area (3) — Edmonton (5) and Calgary (4) — Saskatoon-Regina (8).
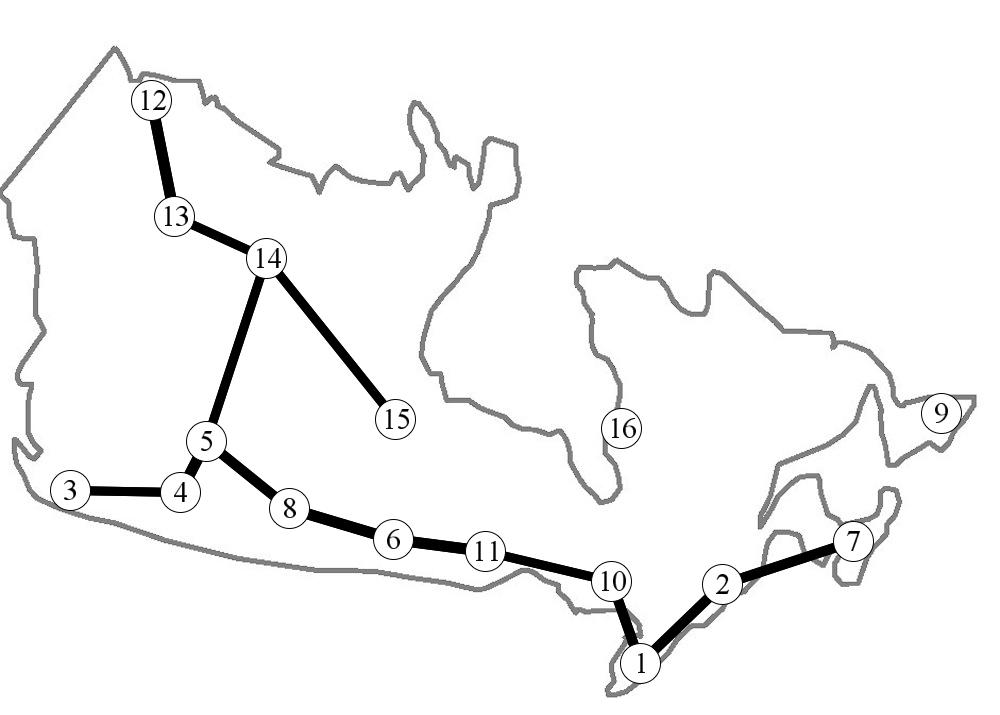
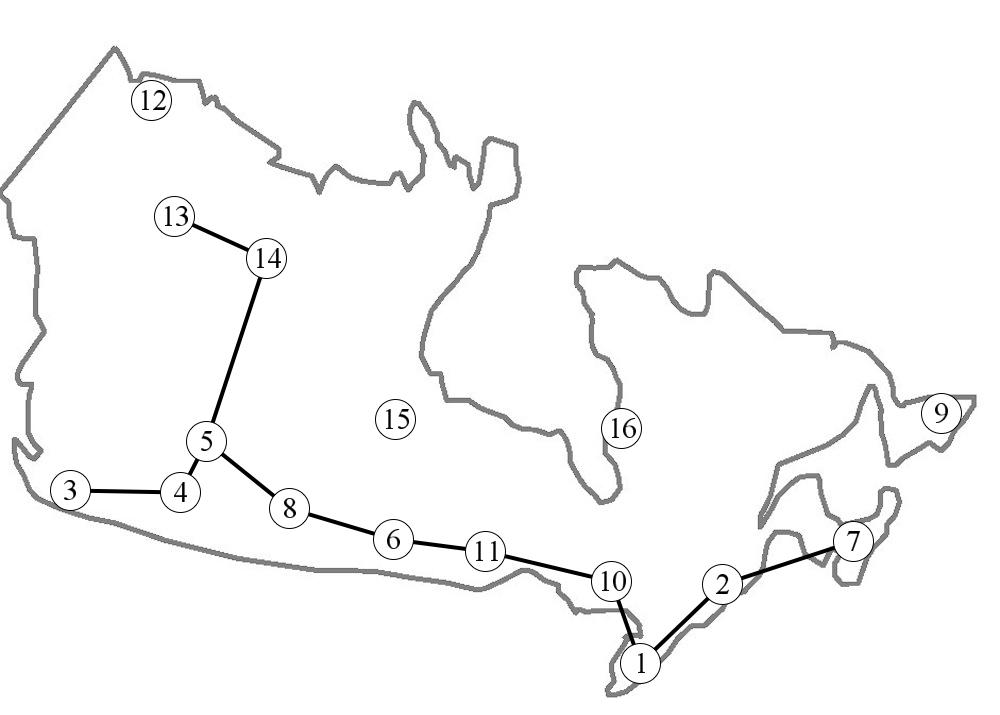
The graph consists of several disconnected components: two isolated nodes, St. John’s and Sudbury, two-node segment Inuvik — Wrigley, and a tree spanning the rest of the urban ares (Fig. 3e). A further increase of to (Fig. 3f) leads to the formation of
-
•
five isolated nodes: Vancouver area, St. John’s, Yellowknife, Thompson, Winnipeg;
-
•
a segment: Inuvik — Wrigley;
-
•
a chain: Calgary — Edmonton — Saskatoon-Regina — Winnipeg — Thunder Bay;
-
•
a chain: Sudbury — Toronto area — Montreal area — Halifax-Moncton.
Only segment-routes Calgary to Edmonton and Winnipeg to Thunder Bay are represented by protoplasmic tubes in almost all experiments (Fig. 3g).
4. Physarum network vs highway network
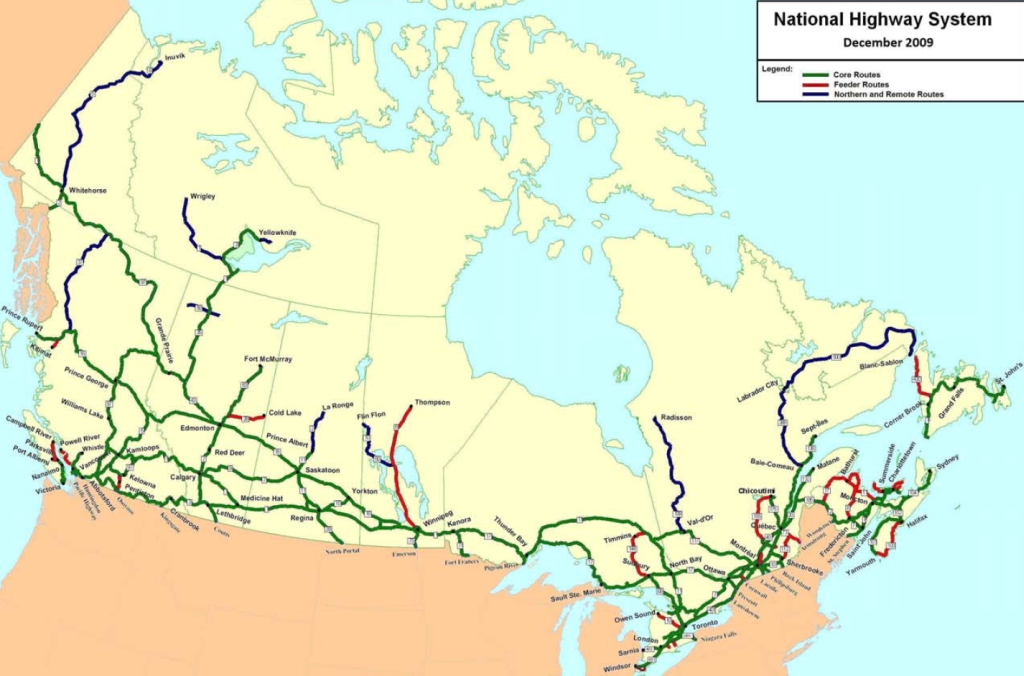
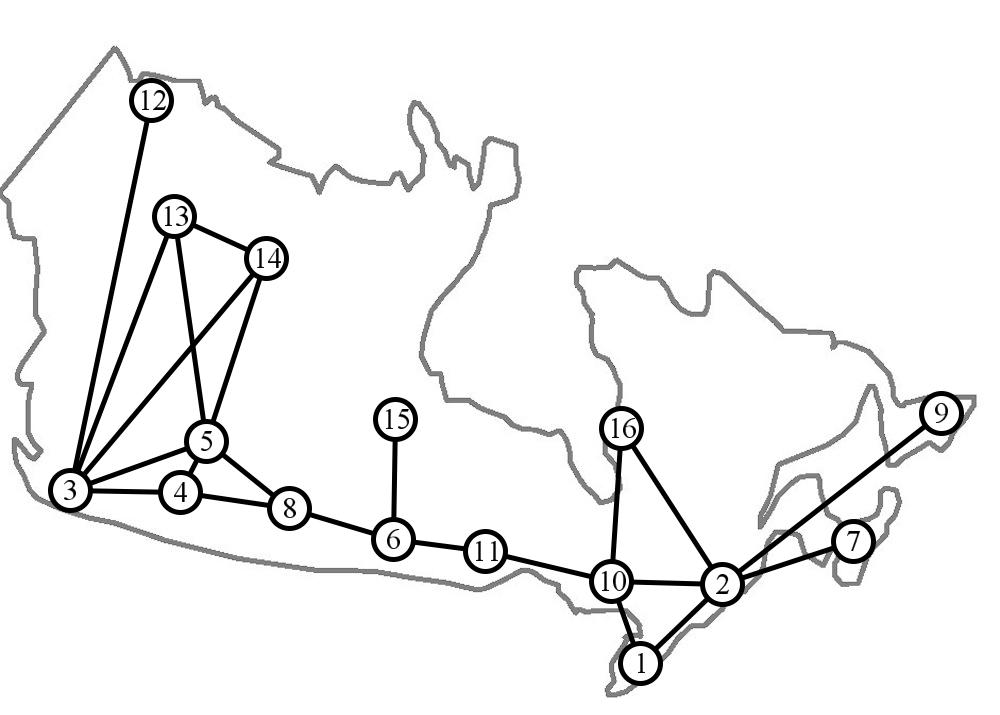
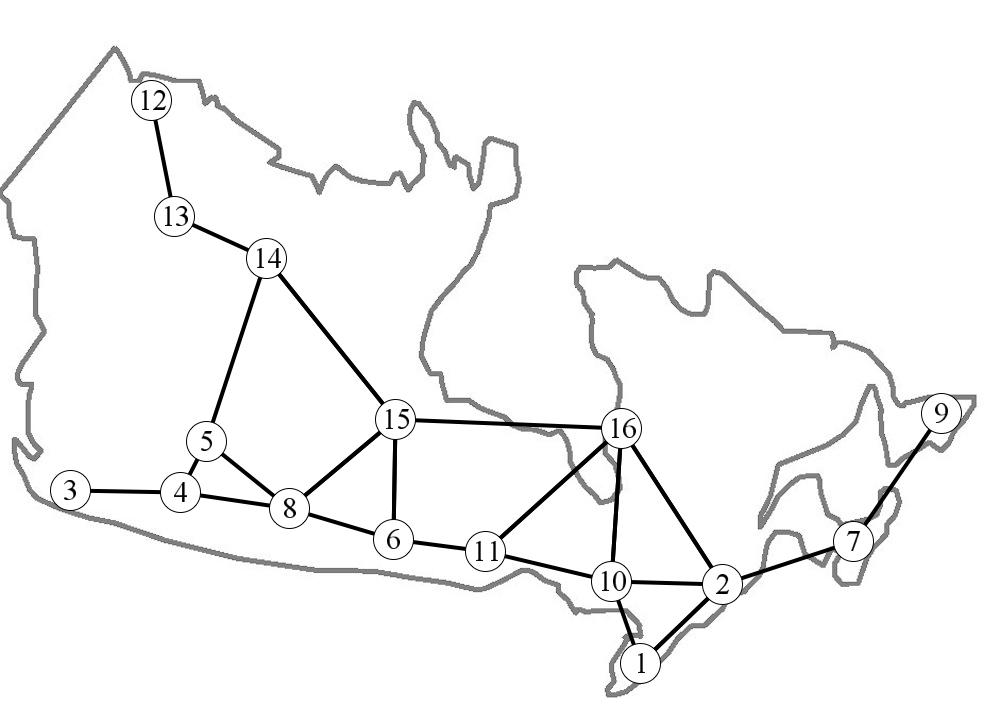
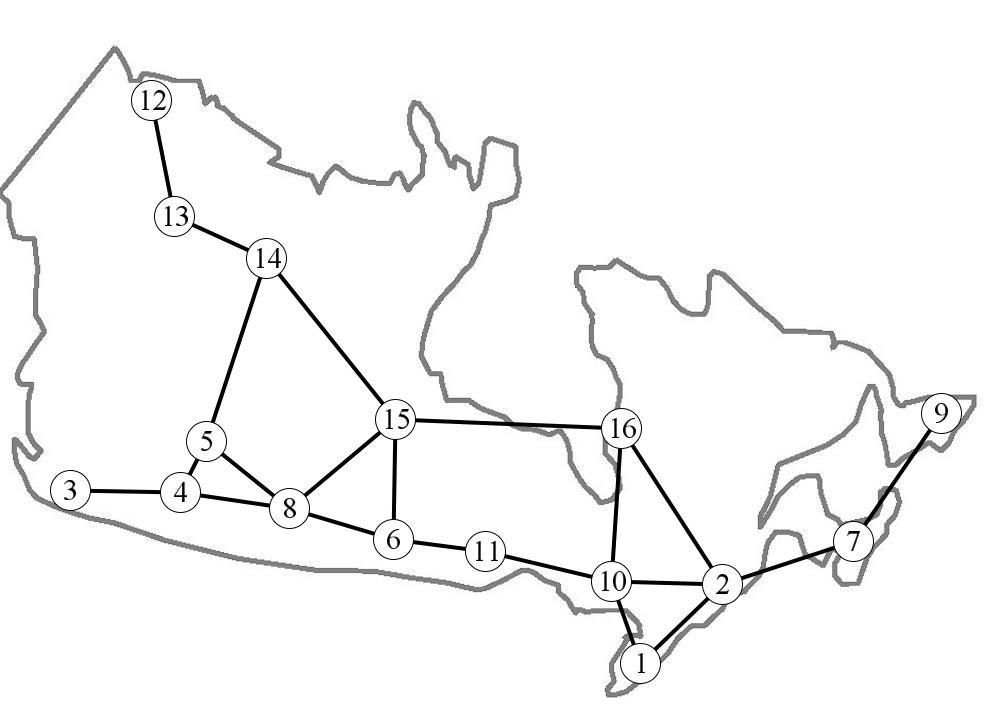
We construct the highway graph as follows. Let be a set of urban regions, for any two regions and from , the nodes and are connected by an edge (, ) if there is a motorway starting in the vicinity of and passing in the vicinity of and not passing in the vicinity of any other urban area . Highway graph shown in Fig. 4b is extracted from a scheme of the Canadian transport network (Fig. 4a).
in the vicinity of a and passing in the vicinity of b and not passing in the vicinity
Finding 1.
Physarum almost approximates the Canadian highway network.
’Raw’ Physarum graph approximates 21 of 22 edges of highway graph . Only one edge, Vancouver area to Calgary, of the highway graph is not represented by protoplasmic tubes in any of the 23 experiments undertaken (Fig. 4c). The ’raw’ physarum graph gives us a rather relaxed approximation because it includes even links which occurred just once in a set of experiments. Let us look at which represents links which occurred in over 35% of experiments. Physarum graph approximates 18 of 22 edges of (Fig. 4d). The only edges of not represented in are Vancouver area to Yellowknife, Sudbury to Radisson, Sudbury to Montreal area, and St. John’s to Montreal area.
Finding 2.
A core component of the Physarum transport network and the Canadian highway network consists of a chain passing along the south border from Halifax-Monctron area to Edmonton, and a fork attached to Edmonton; the south branch of the fork is Edmonton — Calgary — Vancouver area and the north branch is Edmonton – Yellowknife – Wrigley.
The component above is the only connected component in the intersection of with (Fig. 4e).
5. Proximity graphs
A planar graph consists of nodes which are points of the Euclidean plane and edges which are straight segments connecting the points. A planar proximity graph is a planar graph where two points are connected by an edge if they are close in some sense. A pair of points is assigned a certain neighbourhood, and points of the pair are connected by an edge if their neighbourhood is empty. Here we consider the most common proximity graph as follows.
- •
- •
- •
Finding 3.
For a given configuration of nodes of .
The finding implies that the configuration of urban areas of is ’spanning friendly’.
Finding 4.
Let be a minimum spanning tree rooted in node then for any .
We demonstrated this by direct computation of all possible spanning trees on .
Finding 5.
St. John’s and Inuvik urban areas are isolated in and .
Finding 6.
/{(Inuvik — Wrigley), (Halifax-Moncton — St. John’s)}
This means that Canadian highway network is almost optimal (Fig. 5de).


Intersections of Physarum graphs for principle values of threshold with the Gabriel graph and the minimum spanning tree are shown in Fig. 6.
Finding 7.
/{(Inuvik — Wrigley), (Thunder Bay — Radisson)}
Finding 8.
’Raw’ Physarum includes an ’ideal’ acyclic spanning network . This somehow characterises a good quality of a slime mould approximation of a transport network. The minimum spanning tree is not included in the high-threshold Physarum graph . However, there is a ’strong’ component of which is included in the high-threshold Physarum graph (Fig. 6). The strong component is a tree rooted in the Toronto area. The tree’s stem is Toronto — Winnipeg — Saskatoon-Regina — Edmonton. It has three branches. A small branch Winnipeg — Thompson, and two end branches Edmonton — Calgary — Vancouver area and Edmonton — Yellowknife — Wrigley — Inuvik.
6. Response to contamination
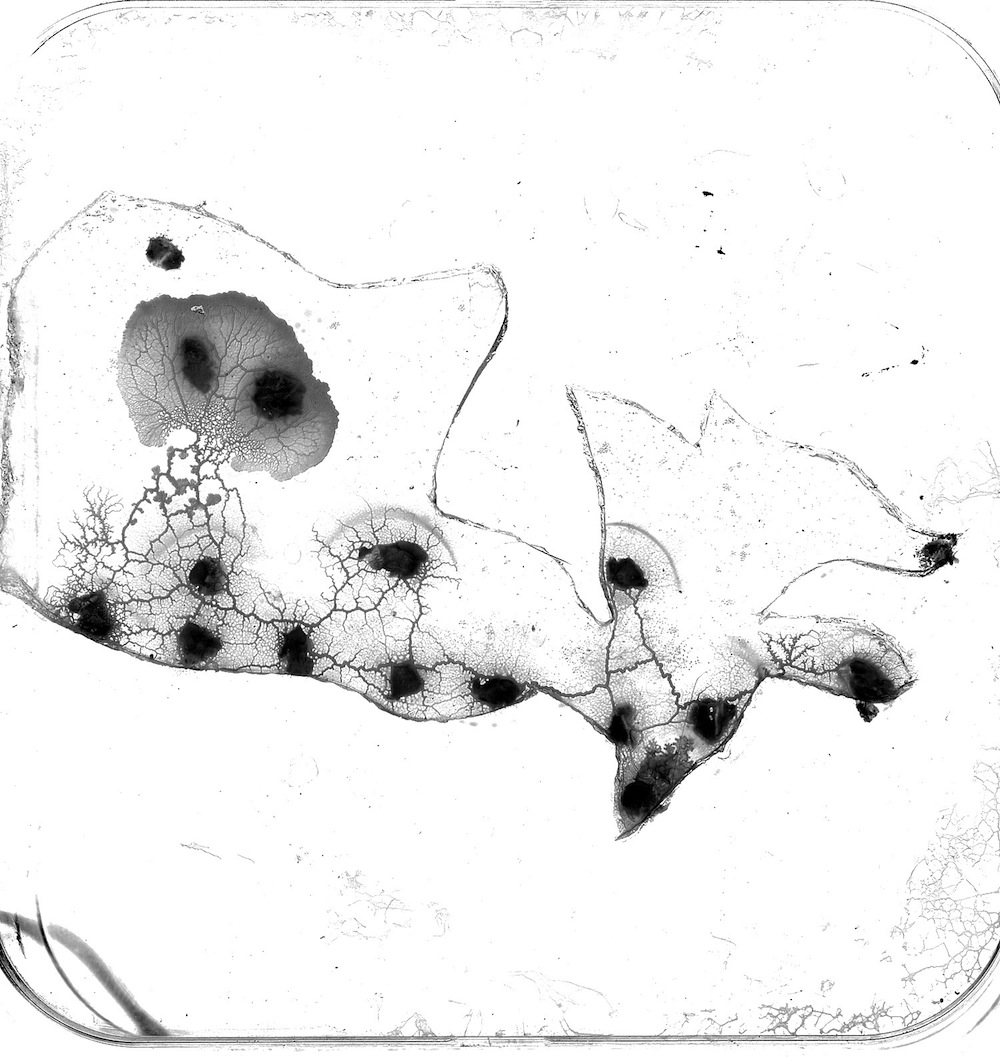
To imitate propagating contamination we place a crystal of sea salt (SAXA Coarse Sea Salt, a crystal weight around 20 mg), in the place of Bruce Nuclear Power station. Inorganic salts are chemo-repellents for P. polycephalum therefore sodium chloride diffusing in agar gel causes plasmodium to retreat from a contaminated zone. We studied plasmodium’s response circa 24 h after initiation of contamination. During 24 h a contamination zone expands as far as Winnipeg an Thompson in the west and St. John’s in the east. In some cases contamination spreads till Saskatoon-Moncton. In a few experiments plasmodium colony occupying St. Jonn’s remains unaffected.
Finding 9.
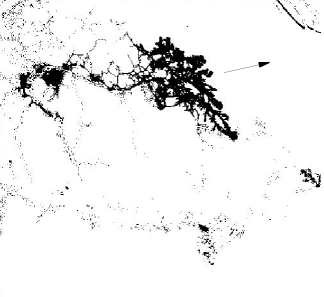
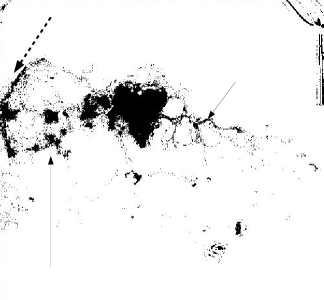
In response to contamination propagating from Bruce Nuclear Power station, the plasmodium of P. polycephalum takes one or more of the following actions: migrates outside Canada, enhances the transport network outside the contaminated zone, sproutes indiscriminately from urban areas and transport links.
The plasmodium’s reactions are illustrated in Figs. 7 and 8. Four types of responses are observed in laboratory experiments.
-
•
Plasmodium migrates outside Canada (Fig. 7ab). Typical waves of migration are from Nunavut towards Baffin Bay and Greenland and from British Columbia towards Washington and Oregon in USA. Due to the growth substrate being an agar plate cut in the shape of Canada, the plasmodium ends up on the bare plastic bottom of a Petri dish, therefore it does not migrate far away from Canada.
-
•
Plasmodium enhances it foraging and colonisation activity in the parts unaffected by contamination (Fig. 7c–f), mainly in Alberta, British Columbia, Northern Territories, Yukon and Nunavut. Protoplasmic tubes themselves are often increased in size and intensity of their colours, which reflects increased propagation of cytoplasm inside the tubes. For example, in Fig. 7cd plasmodium clearly shows hyper-activity in the Nunavut area, with the whole territory covered by spreading plasmodium. Fig. 7cd illustrates hyper-activation of transport routes, particularly links Inuvik — Wrigley, Yelloknife — Wrigley, Edmonton — Wrigley, Edmonton — Vancouver area, Saskatoon-Regina — Edmonton, and Winnipeg — Saskatoon.
- •
7. Discussion
To imitate transport networks in Canada we represented major urban areas and transport nodes with oat flakes, inoculated plasmodium of Physarum polycephalum, allowed the plasmodium to span all oat flakes with its network of protoplasmic tubes and analysed the structure of the protoplasmic network. We found that in over 75% of experiments P. polycephalum an acyclic transport network consisting of a chain spanning urban areas along the south boundary of Canada, from Halifax-Moncton to Vancouver area, with branches Edmonton to Yellowknife to Wrigley to Inuvik and Yellowknife to Thompson. In all experiments slime mould approximates all but Vancouver to Calgary links of Canadian highways networks. Both slime mould and Canadian highway networks have a strong spanning tree component and thus can be thought of as optimal transport networks. In laboratory experiments with slime mould we also detailed possible scenarios of transport network restructuring in a response to a spreading contamination. We believe our results make a substantial contribution towards nature-inspired analyses and design of human-made transport networks. Further experiments are necessary to determine how natural and geographical conditions, especially terrain, affect the exact topology of developing transport networks.
References
- [1] Adamatzky A. Physarum machine: implementation of a Kolmogorov-Uspensky machine on a biological substrate. Parallel Processing Letters 17 (2007) 455–467.
- [2] Adamatzky A. From reaction-diffusion to Physarum computing. Invited talk at Los Alamos Lab workshop “Unconventional Computing: Quo Vadis?” (Santa Fe, NM, March 2007).
- [3] Adamatzky A. and Jones J. Road planning with slime mould: If Physarum built motorways it would route M6/M74 through Newcastle Int J Bifurcaton and Chaos (2010). http://arxiv.org/abs/0912.3967
- [4] Adamatzky A. Physarum Machines (World Scientific, 2010).
- [5] Adamatzky A., Martinez G. J., Chapa-Vergara S. V., Asomoza-Palacio R., Stephens C. R. Approximating Mexican highways with slime mould (2010) arXiv:1010.0557v1 [nlin.PS] http://arxiv.org/abs/1010.0557
- [6] Adamatzky A. and Sloot P. Bio-development of motorway networks in the Netherlands: Slime mould approach (2010).
- [7] Barrat A., Barthelemy M., Vespignani A. Dynamical processes in complex networks. Cambridge University Press (2008)
- [8] Beuthe M., Himanen V., Reggiani A., Zamparini L. (Eds.) Transport Developments and Innovations in an Evolving World Springer, 2004.
- [9] Canada s National Highway System. Condition Report 2008. Council of Ministers Responsible for Transportation and Highway Safety, 2009.
- [10] Dorigo M. and Statzle T. Ant Colony Optimization. Bradford Books, 2004.
- [11] Gabriel K. R. and R. R. Sokal. A new statistical approach to geographic variation analysis. Systematic Zoology, 18 (1969) 259–278.
- [12] Jaromczyk J. W. and G. T. Toussaint, Relative neighborhood graphs and their relatives. Proc. IEEE 80 (1992) 1502–1517.
- [13] Kirkpatrick D. G. and Radke J. D. A framework for computational morphology. In G. Toussaint, editor, Computational Geometry (1985) 217–248.
- [14] Larsen J., Urry J., Axhausen K. Mobilities, Networks, Geographies. Ashgate Publishing, 2006.
- [15] Matula D. W. and Sokal R. R. Properties of Gabriel graphs relevant to geographical variation research and the clustering of points in the same plane. Geographical Analysis 12 (1984) 205–222.
- [16] Nakagaki T., Yamada H., Ueda T. Interaction between cell shape and contraction pattern in the Physarum plasmodium, Biophysical Chemistry 84 (2000) 195–204.
- [17] Nakagaki T., Smart behavior of true slime mold in a labyrinth. Research in Microbiology 152 (2001) 767- 770.
- [18] Nakagaki T., Yamada H., and Toth A., Path finding by tube morphogenesis in an amoeboid organism. Biophysical Chemistry 92 (2001) 47 -52.
- [19] Nakagaki T., Iima M., Ueda T., Nishiura y., Saigusa T., Tero A., Kobayashi R., Showalter K. Minimum-risk path finding by an adaptive amoeba network. Physical Review Letters 99 (2007) 068104.
- [20] Nesetril J., Milkova E., Nesetrilova H., Otakar Boruvka on minimum spanning tree problem, Discrete Mathematics 233 (2001) 3–36.
- [21] Olariu S., Weigle M.C. Vehicular Networks: From Theory to Practice. Chapman and Hall/CRC, 2009.
- [22] Schumann A. and Adamatzky A. Physarum spatial logic. In: Proc. 1th Int. Symp. on Symbolic and Numeric Algorithms for Scientific Computing (Timisoara, Romania, September 26-29, 2009).
- [23] Shirakawa T., Adamatzky A., Gunji Y.-P., Miyake Y. On simultaneous construction of Voronoi diagram and Delaunay triangulation by Physarum polycephalum. Int. J. Bifurcation and Chaos (2009), in press.
- [24] Solnon C. Ant Colony Optimization and Constraint Programming. Wiley-ISTE, 2010.
- [25] Stephenson S. L. and Stempen H. Myxomycetes: A Handbook of Slime Molds. (Timber Press, 2000).
- [26] Taplin J. H. E. Qiu M., Han R. Cost-Benefit Analysis And Evolutionary Computing: Optimal Scheduling of Interactive Road Projects Edward Elgar Publishing, 2005.
- [27] Tero A., Kobayashi R. and Nakagaki T., Physarum solver: A biologically inspired method of road-network navigation. Physica A 363 (2006) 115–119.
- [28] Toussaint G. T., The relative neighborhood graph of a finite planar set, Pattern Recognition 12 (1980) 261–268
- [29] Tsuda S., Aono M., Gunji Y.-P. Robust and emergent Physarum logical-computing. Biosystems 73 (2004) 45–55.