Broadband Dielectric Spectroscopy on Human Blood
Abstract
Background
Dielectric spectra of human blood reveal a rich variety of dynamic processes. Achieving a better characterization and understanding of these processes not only is of academic interest but also of high relevance for medical applications as, e.g., the determination of absorption rates of electromagnetic radiation by the human body.
Methods
The dielectric properties of human blood are studied using broadband dielectric spectroscopy, systematically investigating the dependence on temperature and hematocrit value. By covering a frequency range from 1 Hz to 40 GHz, information on all the typical dispersion regions of biological matter is obtained.
Results and conclusions
We find no evidence for a low-frequency relaxation (”-relaxation”) caused, e.g., by counterion diffusion effects as reported for some types of biological matter. The analysis of a strong Maxwell-Wagner relaxation arising from the polarization of the cell membranes in the 1-100 MHz region (”-relaxation”) allows for the test of model predictions and the determination of various intrinsic cell properties. In the microwave region beyond 1 GHz, the reorientational motion of water molecules in the blood plasma leads to another relaxation feature (”-relaxation”). Between - and -relaxation, significant dispersion is observed, which, however, can be explained by a superposition of these relaxation processes and is not due to an additional ”-relaxation” often found in biological matter.
General significance
Our measurements provide dielectric data on human blood of so far unsurpassed precision for a broad parameter range. All data are provided in electronic form to serve as basis for the calculation of the absorption rate of electromagnetic radiation and other medical purposes. Moreover, by investigating an exceptionally broad frequency range, valuable new information on the dynamic processes in blood is obtained.
keywords:
dielectric spectroscopy , blood , relaxation , specific absorption rate , dielectric loss , dielectric constant1 Introduction
Blood is a highly functional body fluid, it delivers oxygen to the vital parts, it transports nutrients, vitamins, and metabolites and it also is a fundamental part of the immune system. Therefore the precise knowledge of its constituents, its physical, biological, and chemical properties and its dynamics is of great importance. Especially its dielectric parameters are of relevance for various medical applications [1], like cell separation (e.g., cancer cells from normal blood cells [2]), checking the deterioration of preserved blood [3], and dielectric coagulometry [4]. In addition, the precise knowledge of the dielectric properties of blood is prerequisite for fixing limiting values for electromagnetic pollution (via the conductivity in the specific absorption rate (SAR))[5, 6, 7, 8].
Early measurements of the electrical properties of blood contributed significantly to unravel the constitution of red blood cells (RBC). For example, the results by Höber [9] provided the first indications of a dispersion (i.e. frequency dependence), caused by the membrane of RBCs, in the radio frequency (RF) spectrum of the dielectric properties of blood. This relaxation process is nowadays identified as being of Maxwell-Wagner type [10, 11] and termed -relaxation in biophysical literature [12, 13].
Various early works [14, 15, 16, 17, 18, 19, 20, 21] were followed by measurements at very high frequencies [22, 23, 24, 25]. Some of them revealed an additional dispersion with a relaxation rate near 18 GHz, which can be assigned to the reorientation of water molecules and which is named -dispersion. Furthermore, a third relaxation, termed -relaxation and located in the low-frequency regime, kHz was detected in some biological materials [26, 27]. However, interestingly, an -relaxation seems to be absent in whole blood [28] and only is found in hemolyzed blood cells [27]. This was speculated to be due to a higher ion permeability of the membranes in the latter case, shifting the relaxation spectrum into the experimental frequency window [27]. The origin of the -relaxation is a matter of controversy; most commonly it is assumed to arise from counterion diffusion effects [13, 29]. Finally, a dispersion with low dipolar strength located in the frequency regime between the - and -dispersion was identified by Schwan [12]. The origin of the -dispersion and the possible role of bound water in its generation is controversially discussed [30, 31, 32, 33, 34, 35, 36, 37, 38].
Taking together all these results, it is clear that there are three main dispersion regions in the dielectric frequency spectrum of blood between some Hz and 50 GHz, termed , , and [12, 13]. This nomenclature should not be confused with that used in the investigation of glassy matter like supercooled liquids or polymers. Within the glass-physics community the terms -, -relaxation, etc. are commonly applied to completely different phenomena than those considered above (see, e.g., refs 39 and 40). In the present work we follow the biophysical nomenclature.
A lot of additional research has been done until the early 1980s [1, 41, 42, 43, 44] and a detailed review was given in 1983 by Schwan [13]. Later on, in the course of the upcoming debates about electromagnetic pollution, dielectric properties of body tissues and fluids received renewed interest as they determine the SAR, a measure for the absorption of electromagnetic fields by biological tissue [8, 45, 46, 47, 48]. But also various other important medical questions can be addressed by dielectric spectroscopy [1, 2, 3, 4, 49]. In the last two decades, a number of papers on dielectric spectroscopy on blood and erythrocyte solutions were published [35, 50, 51, 52, 53, 54, 55, 56, 57], most of them treating special aspects only.
On the theoretical side, a number of models for the description of cell suspensions have been proposed. Most models focus on the -relaxation [12, 14, 15, 16, 17, 20, 58, 59, 60, 61, 62, 63, 64], including the often employed Pauly-Schwan model [12, 58], discussed below. Some of them also account for the non-spherical shape of cells [14, 15, 16, 17, 61]. It seems clear that diluted solutions and whole blood with a hematocrit value of 86% have to be treated differently. The Bruggeman-Hanai model [20, 59] was specially developed for highly concentrated suspensions. A recent summary of various models can be found in ref. [61].
Concluding this introduction, it has to be stressed that, after more than one century of research, many aspects of the dielectric properties of blood (e.g., the presence and origins of - and -dispersion) are still unclear. It should be noted that, in addition to the three main dispersion effects, from a theoretical viewpoint a number of further relaxation features may show up in blood. For example, it is well known that RBC’s are far from being of spherical shape and in principle for shelled ellipsoidal particles up to six relaxations can be expected [61]. Furthermore, the hemoglobin molecules within the RBC’s should show all the typical complex dynamics as found in other proteins. Based on the available literature data (e.g., [13]), it seems that most, if not all, of these additional processes do not or only weakly contribute to the experimentally observed spectra. However, one should carefully check for possible deviations from the simple three-relaxation scenario mentioned above, which may well be ascribed to these additional processes.
Maybe the best and most cited broadband spectra of blood covering several dispersion regions are those by Gabriel et al [46], taken at 37 C, which are commonly used for SAR calculations and for medical purposes. However, even these data are hampered by considerable scatter and they are composed from data collected by different groups on different samples. Clearly, high-quality spectra covering a broad frequency range measured on identical samples are missing. A systematic investigation of the hematocrit and temperature dependence is essential to achieve a better understanding of the different dispersion contributions of blood. The present work provides the dielectric constant , the loss , and the conductivity of human blood in a broad frequency range (1 Hz to 40 GHz), by using a combination of different techniques of dielectric spectroscopy applied to identical samples. In addition, the temperature (280 K - 330 K) and hematocrit value (0 - 86%) dependence is thoroughly investigated.
2 Models and Data Analysis
Dielectric spectroscopy is sensitive to dynamical processes that involve the reorientation of dipolar entities or displacement of charged entities, which can cause a dispersive behavior of the dielectric constant and loss. However, also non-intrinsic Maxwell-Wagner effects caused by interfacial polarization in heterogeneous samples can lead to considerable dispersion [10, 11, 65]. As mentioned above, biological matter shows various dispersions in the frequency regime 1 Hz to 40 GHz, which have different microscopic and mesoscopic origins and therefore have to be described differently.
2.1 Intrinsic Relaxations
Intrinsic processes like, e.g., the cooperative reorientation of dipolar molecules are often described by the Debye formula [66]:
| (1) |
The relaxation strength is given by . and are the limiting values of the real part of the dielectric constant for frequencies well below and above the relaxation frequency , respectively. This frequency is characterized by an inflection point in the frequency dependence of the dielectric constant and a peak in the dielectric loss. If taking into account an additional dc-conductivity contribution, the conductivity shows a steplike increase close to . The Debye theory assumes that all entities do relax with the same relaxation time . In reality, a distribution of relaxation times often leads to a considerable smearing out of the spectral features [67, 68]. Those can be described, e.g., by the Havriliak-Negami formula, which is an empirical extension of the Debye formula by the additional parameters and [69, 70]:
| (2) |
Special cases of this formula are the Cole-Cole formula [71] with and and the Cole-Davidson formula [72, 73] with and .
In most materials with intrinsic relaxations, the inevitable dc conductivity arising from ionic or electronic charge transport cannot be neglected. Usually it leads to a divergence in the loss at frequencies below the loss peak and can be taken into account by including a further additive term in Eq. 2 ( denotes the permittivity of free space, is the circular frequency).
2.2 Maxwell-Wagner Relaxations
The -dispersion in biological matter is commonly accepted to be of Maxwell-Wagner type [12, 13, 44, 47, 48]. As shown by Maxwell and Wagner [10, 11], strong dispersive effects mimicking those of intrinsic dipolar relaxations can arise in samples composed of two or more regions with different electrical properties (e.g., plasma, cytoplasma, and cell membranes in the case of RBCs). It should be noted that this dispersion can be completely understood from the heterogeneity of the investigated samples without invoking any frequency-dependent microscopic processes within the involved dielectric materials. If one of the regions in the sample is of interfacial type and relatively insulating, e.g., an insulating surface layer [65] or the membranes of biological cells [12, 13], very high apparent values of the dielectric constant are detected at low frequencies. A straightforward approach for understanding the dielectric behavior of heterogeneous systems is an equivalent-circuit analysis. Here any interfacial layer can be modeled by a parallel RC element with the resistance and capacitance of the interfacial element much higher than the corresponding bulk values [65]. This leads to a relaxation spectrum where the low-frequency capacitance and conductance are dominated by the interface. For the calculation of from the measured capacitance, usually the overall geometry of the sample is used instead of that of the thin interfacial layer (i.e., the assumed is much smaller than that of the layer). Thus, an artificially high dielectric constant is detected at low frequencies. At high frequencies, the interface capacitor becomes shorted and the bulk properties are detected. This leads to the steplike decrease of and increase of with increasing frequency, typical for relaxational behavior. The increase of arises from the fact that the bulk conductance usually is much higher than the interface conductance (the cell membrane in the case of RBCs), the latter being shorted by the interface capacitor at high frequencies.
Instead of an equivalent-circuit analysis [65], for biological matter it is common practice to treat the -relaxation analogous to an intrinsic relaxation process, i.e., to fit it with the Debye equation or its extensions (Eqs. 1 and 2). A variety of models have been developed to connect the obtained fitting parameters with the intrinsic dielectric properties of the different regions of the samples (see section 2.5) and a lot of modeling work of experimental data was performed [12, 14, 15, 16, 17, 20, 57, 58, 59, 60, 61, 62, 63, 64, 74, 75, 76, 77, 78, 79].
2.3 Electrode Polarization
Blood exhibits strong ionic conductivity. At low frequencies the ions arrive at the metallic electrodes and accumulate in thin layers immediately below the sample surface [80, 81, 82, 83]. The frequency, below which this effect sets in, critically depends on electrode distance and ionic mobility and in biological matter typically is located in the kHz - MHz region. These insulating layers represent large capacitors leading to an apparent increase of and decrease of at low frequencies, quite similar to the Maxwell-Wagner effects discussed above. These non-intrinsic contributions can hamper the unequivocal detection of the parameters of the -relaxation. Various experimental techniques have been applied to avoid the influence of electrode polarization (see, e.g., refs. 28, 50, 81). An alternative way is the exact modeling of these non-intrinsic contributions. The most common models are a parallel RC circuit or a so-called constant-phase element, both connected in series to the bulk sample [81, 82, 83].
A parallel RC circuit corresponds to an additional impedance
| (3) |
which has to be added to the bulk impedance. and are the resistance and capacitance of the insulating layers, respectively. From the resulting total impedance, the total capacitance and conductance (and thus and ) can be calculated resulting in a behavior equivalent to a Debye-relaxation (this scenario corresponds to a conventional Maxwell-Wagner relaxation). Alternatively a ”constant phase element”, which is an empirical impedance function, given by (refs 82, 83), can be used. When defining , Eq. 3 formally has the same mathematical structure as Eq. 1. Thus, in analogy to Eq. 2 a distributed RC-circuit can be introduced by writing
| (4) |
We want to emphasize, that in contrast to Eq. 3, which leads to a frequency dependence identical to that of a Debye relaxation, an equivalent-circuit evaluation using Eq. 4 does not lead to fit curves identical to those of a Havriliak-Negami relaxation: For the latter case, the relaxation time in Eq. 1 is assumed to be distributed. In the equivalent-circuit case, the corresponding quantity, determining, e.g., the loss peak position, is with the bulk resistance [65]. However, the distributed quantity in the equivalent-circuit case is , thus leading to different curve shapes.
2.4 Temperature Dependence
The fitting of relaxation spectra directly provides the relaxation times (), the width parameters ( and ), the relaxation strengths (), the dielectric constant for (), and the dc conductivity () (see section 2.1). For the temperature dependence of and , thermally activated behavior
| (5) |
and
| (6) |
can be assumed. is a prefactor. and denote the hindering barriers for the relaxational process and the diffusion of the charge carriers (i.e., dissolved ions of the plasma in the present case), respectively. is an inverse attempt frequency, often assumed to be of the order of a typical phonon frequency. Equation 6, with the extra term, is derived by considering the difference of the forward and backward hopping probabilities of an ion between two sites in a potential that becomes asymmetric due to the external field [84]. Here the field drives the ionic motion. In contrast, for dielectric relaxations, within the framework of the fluctuation-dissipation theorem it is assumed that the dielectric measurement is sensitive to reorientational fluctuations, which are present even without field. Thus, in Eq. 5 is proportional to the inverse of the reorientation probability of a molecule experiencing a hindering barrier, which is just given by the exponential term.
The temperature dependence of the dielectric strength of dipolar relaxation mechanisms often can be characterized by the Curie law [85, 86]:
| (7) |
Deviations from the Curie law are usually thought to signify dipole-dipole interactions.
For most dielectric materials, the broadening of the loss peak diminishes with increasing temperature, i.e., and for high temperatures. This finding can be ascribed to the fast thermal fluctuations, which cause every relaxing entity ”seeing” the same environment [39], thus leading to an identical relaxation time for each entity, which implies Debye-like behavior.
2.5 Cell Models
Two commonly employed models for the description of the -dispersion of cell suspensions and tissue will be introduced now and applied to the experimental data in section 4.3.2. Both models are claimed to be applicable to high cell concentrations and thus are especially suited for the samples of the present work. Based on the Maxwell-Wagner model [10, 11], the Pauly and Schwan takes into account the membranes of cells [58, 48]. Using appropriate approximations (e.g., a negligible membrane conductance) some simple relations are derived:
| (8) |
and
| (9) |
Equation 8 allows the calculation of the membrane capacitance per area unit, , from the relaxation strength of the -dispersion, , and the volume fraction and radius of the suspended particles. Via Eq. 9, the conductivity of the suspending medium (plasma in the case of blood), , can be determined from the volume fraction and the measured dc conductivity of the suspension, i.e. the limiting low frequency conductivity of the -dispersion, . Moreover, resolving the expression for the -relaxation time [58],
| (10) |
one can approximate the conductivity of the cell interior (cytoplasma), by
| (11) |
An alternative access to is provided by the following relation [58]:
| (12) |
Here denotes the high-frequency plateau of the step in . Also the dielectric constant of the cytoplasma, , can be determined [58]:
| (13) |
is the limiting high-frequency dielectric constant of the -relaxation (cf. in Eq. 1) and is the dielectric constant of the suspending medium (plasma).
The Pauly-Schwan model includes correction factors for high concentrations (e.g., the factor in eq. 8) and is claimed to be valid for all values of (see, e.g., ref. [48]). Another model, especially developed for highly concentrated suspensions, is the one by Bruggemann [20] and Hanai [59, 62, 63] taking into account the polarization of particles in the presence of neighboring ones. The model leads to the equations
| (14) |
and
| (15) |
for the dielectric properties and of the particles. It should be mentioned that this model assumes homogeneous particles (i.e. without shell) and Eqs. 14 and 15 can be considered providing average values of the whole cell only.
One should note that the exact solution of the dielectric theory of suspensions of ellipsoidal particles leads to the prediction of six separate relaxation processes, namely two per ellipsoid axis, arising from the Maxwell-Wagner relaxation of the shell and of the particle interior [61]. For spheroids, i.e. ellipsoids with two equal semi-diameters, which may be a good approximation of RBCs, still four relaxations are expected. Usually in the application of the Maxwell-Wagner model to cell suspensions, including the above treated models, various reasonable approximations are made (e.g., that the membrane thickness is much smaller than the cell radius) that lead to the prediction of a single relaxation only.
3 Materials and methods
To determine the complex dielectric permittivity and conductivity in a broad frequency range (from 1 Hz to 40 GHz), different measurement techniques were combined [87]. In the frequency range 1 Hz - 10 MHz, high precision measurements were performed by means of a Novocontrol Alpha-A Analyzer. This frequency response analyzer directly measures the sample voltage and the sample current by the use of lock-in technique. The ac voltage is applied to a parallel-plate capacitor made of platinum containing the sample material (diameter 5 mm, plate distance 0.6 mm). In our earlier measurements of various materials, platinum was found to minimize contributions from dissolved ionic impurities arising from the electrode material. The capacitor is mounted into a N2-gas cryostat (Novocontrol Quatro) for temperature-dependent measurements. For the measurements in the frequency range 1 MHz - 3 GHz a coaxial reflection method was used employing the Agilent Impedance/Material Analyzer E4991A. Here the sample, again placed in the same parallel-plate capacitor, is connected to the end of a specially designed coaxial line, thereby bridging inner and outer conductor [88]. For additional measurements between 40 Hz-110 MHz, the autobalance bridge Agilent 4294A was used. Its measurement range overlaps with that of the other devices. In all the measurements described above, the applied ac voltage was 0.1 V. The Agilent ”Dielectric Probe Kit” 85070E using the so called ”performance probe” with an E8363B PNA Series Network Analyzer covered the high frequency range from 100 MHz to 40 GHz. It uses a so-called open-end coaxial reflection technique, where the end of a coaxial line is immersed into the sample liquid. The applied ac voltage was 32 mV. Calibration was performed with the standards Open, Short, and Water. As any contributions from parasitic elements are excluded by this technique, the obtained absolute values were used to correct the results obtained with the low-frequency techniques, discussed above, for contributions from stray capacitance.
Blood samples from a healthy person were taken at the hospital ”Klinikum Augsburg”. All blood samples were taken from the same person and various vital parameters of the blood samples were checked. All samples were taken before a meal, at the same time of the day. We did not find any significant difference in the measurement results obtained on samples taken at different days. To avoid clotting, the samples were prepared with EDTA (ethylenediaminetetraacetic acid). The influence of different coagulation inhibitors on the dielectric properties were tested and found to be insignificant. Besides the whole blood, which was measured as taken from the body, four other samples with different hematocrit values () were prepared. is given by the ratio of volume fraction of the corpuscles (erythrocytes, leukocytes, and thrombocytes) of the blood and the total volume. The whole blood used in the present work was found to have . After centrifugation of the whole blood, the corpuscular parts could be separated from the plasma by pipetting. By remixing with the plasma obtained in this way, four additional samples were prepared: plasma () and blood with , 0.57, and 0.86. The exact values were determined by taking hemograms with a Beckman-Coulter Hematology Analyzer at the hospital. For each measurement run with the different devices fresh blood samples were used.
One may suspect that sedimentation of RBCs and other cells during the temperature-dependent measurement runs could influence the measurements. Covering the whole investigated temperature range with the different measurement devices did take about 2-3 hour only. In the high-frequency measurements with the ”open-end” coaxial technique, where relatively large amounts of material (about 25 ml) held in transparent test tubes were used, visible inspection revealed no indications of sedimentation even after much longer time. Nevertheless the sample material was thoroughly stirred before each frequency sweep at the different temperatures. The results did well match those at lower frequencies, where small sample amounts of about 0.01 ml contained in a platinum capacitor were used. With this capacitor, up to three separate temperature-dependent measurement runs were performed, using different devices and partly using different thermal histories. All the results did match very well. Finally, the measurements usually were done by first cooling the sample from room temperature and subsequently heating it up to the highest temperatures. The results from the cooling and heating runs, which were done at differently aged samples, did always agree within experimental resolution.
The integrity of the erythrocytes was retained during most of the dielectric measurements, which was checked by a comparison of the room temperature results before and after cooling or heating. However, as expected this was no longer the case when the samples were subjected to the highest temperatures investigated, extending up to 330 K. Therefore these measurements were performed at the end of each temperature-dependent measurement run.
If not otherwise indicated, the experimental data points shown in the plots of the present work have errors that are not exceeding the size of the symbols.
4 Results and Discussion
4.1 Broadband Spectra
Figure 1 shows the broadband spectra of the different samples at body temperature ( K), extending from 1 Hz to 40 GHz.
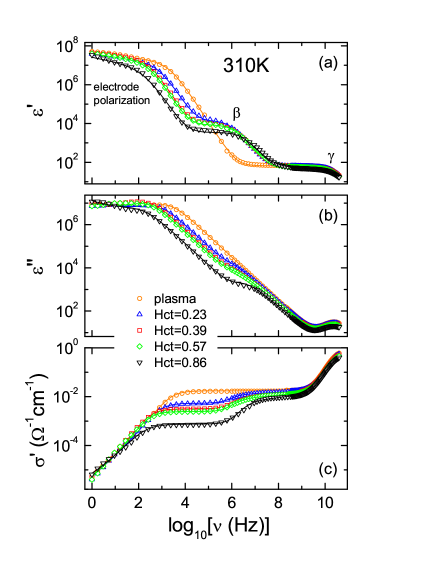
The dielectric constant of the blood plasma (Fig. 1(a), orange circles) reveals a low-frequency plateau between 1 and 100 Hz, followed by a steplike decrease towards higher frequencies that passes into another plateau between about 1 MHz and 10 GHz. The behavior below about 1 MHz can be ascribed to electrode polarization (see section 4.2 for a detailed discussion). At frequencies beyond about 1 GHz a further decrease of indicates the beginning -dispersion arising from the reorientational motion of the water molecules (see section 4.4). shows a plateau at low frequencies, followed by a strong decrease above about 300 Hz and the -relaxation peak at ca. 20 GHz. Accordingly, the conductivity exhibits a strong increase at low frequencies, followed by a plateau between 1 kHz and 1 GHz. At GHz another strong increase at the end of the measured spectrum shows up, again corresponding to the -relaxation.
Just as the plasma, the dielectric spectra of the other samples also show a -relaxation and a electrode-polarization contribution, the latter leading to a strong increase of below about 10 - 100 kHz and decrease of below about 1 - 10 kHz. However, between these two features, a further process shows up, the well-known -dispersion, located at about 1 - 100 MHz in . It is caused by the Maxwell-Wagner relaxation arising from the heterogeneity of the solute/cell system (see section 2.2). It is evidenced by a steplike decrease in the dielectric constant at about 1 - 100 MHz, an s-shaped bend in the decrease of the dielectric loss around 1 MHz, and a steplike increase in the conductivity around 1 MHz. Comparing the different samples, it becomes evident that the absolute values of , , and decrease with increasing hematocrit value over almost the whole frequency range. A detailed analysis of the -dispersion will be provided in section 4.3. The -dispersion, which is supposed to be located in the frequency range between the - and -relaxation cannot be detected on this scale and will be treated in section 4.5 below.
In the present work the complete broadband spectra are fitted by combining several relaxational dispersions and the electrode-polarization contribution. In addition, the dc conductivity has to be included in the fitting routine, since the blood plasma contains free ions that contribute to the conductivity. The lines shown in Fig. 1 are fits with the sum of two relaxational dispersions described by Eq. 2 (with ) and the dc-conductivity, which are assumed to be connected in series to the electrode impedance given by Eq. 4 (with ). The fits were simultaneously performed for real and imaginary part of the permittivity. A qualitative inspection of Fig. 1 reveals that an excellent match of the experimental spectra could be achieved in this way, which also is the case for the other temperatures investigated. In the following sections, we discuss the different contributions to the spectra and the resulting relevant fit parameters in detail. To serve for SAR calculations and medical purposes, the fit curves for all temperatures and hematocrit values investigated in the present work are provided in electronic form.
4.2 Electrode polarization and -Dispersion
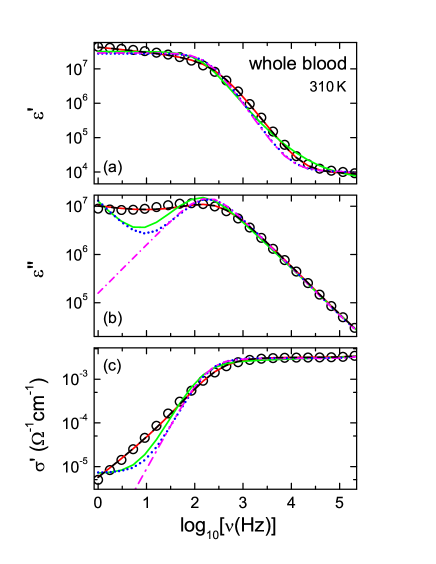
To examine the contributions from electrode polarization to the spectra in more detail, as an example in Fig. 2 the spectra of whole blood at 310 K are shown in the low frequency range, 1 Hz - 200 kHz. As demonstrated by the dash-dotted magenta line, the observed relaxationlike feature cannot be satisfactorily fitted by assuming a simple RC equivalent circuit (Eq. 3) in series to the bulk sample, which leads to a symmetric loss peak just like an intrinsic Debye relaxation (see section 2.3). The deviations are strongest in below the peak frequency, where the measured obviously varies far too weakly with frequency to be describable by the strongly increasing fit curve. Using a Debye relaxation function (Eq. 1) with an additional conductivity contribution , which leads to a minimum in below the peak frequency, also cannot account for the experimental data (dotted blue line). Replacing the Debye by a Cole-Cole function (Eq. 2 with ; green line) only leads to a marginal improvement of the fits. Instead, a distributed RC equivalent circuit as described by Eq. 4 with but (Cole-Cole case) was found to provide very accurate fits of the measured spectra (solid red line). The same can be said for the other blood samples with different hematocrit values investigated in the present work. A constant phase element in series with the bulk also very well accounts for the experimental data (black dashed line). However, in our further analysis we decided to use the distributed RC circuit instead because its parameters seem to have more physical signification than those of the constant phase element.
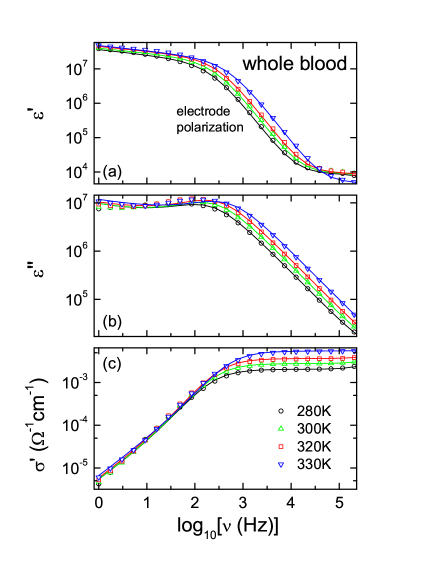
Good fits with this approach can also be achieved for the results obtained at different temperatures. As an example, Fig. 3 shows the dielectric quantities of whole blood in the frequency range, dominated by electrode polarization, for selected temperatures. The lines represent the fits of the complete broadband spectra (cf. Fig. 1) where a distributed RC circuit, Eq. 4, was used for the description of the low-frequency data. In all cases the agreement of fits and experimental curves are excellent. The onset of the electrode effects, i.e. the increase of and the decrease of when lowering the frequency, is found to shift to lower frequencies with decreasing temperature. This can be ascribed to the reduced mobility of the ionic charge carriers at low temperatures, which thus arrive at the electrodes for smaller frequencies only. As revealed by Fig. 1, for increasing hematocrit value the onset of the electrode effects shifts to lower frequencies, too. This is in accord with the well-known increase of the viscosity of blood with increasing hematocrit value, corresponding to a reduction of ion mobility.
The fits reveal a width parameter close to 0.15 and nearly independent of temperature and hematocrit value (not shown), except for , where is found, slightly increasing with temperature. characterizes the distribution of relaxation times of the RC equivalent circuit that describes the electrode polarization (see section 2.3). The deviations from Debye behavior may be explained, e.g., by the surface roughness of the electrodes [89, 90, 91]. The fits reveal electrode capacitances of the order of 10 F. is found to be only weakly temperature dependent and it shows a tendency to decrease with increasing hematocrit value. This can be ascribed to the mentioned reduction of the ionic mobility leading to a less effective formation of the insulating electrode layers. The fits do not reveal reliable information on the electrode resistance as no clear low-frequency plateau in is seen (cf. Fig. 1 and Fig. 3).
From the presented results, it is clear that the electrode polarization is the dominant effect in the low frequency spectrum of blood. The equivalent-circuit description in terms of a distributed RC circuit provides nearly perfect fits of the experimental data. The typical deviations between fit and measured data are around 10 or less, which is negligible compared to the many decades the dielectric quantities vary with frequency. Thus the presence of an additional contribution from a possible -relaxation seems unlikely but due to the mentioned deviations, a weak -relaxation cannot be fully excluded. However, it should be noted that in earlier investigations also no indications for an -relaxation in blood were found [28].
4.3 -Dispersion
4.3.1 Phenomenological Evaluation
Figure 4 shows the spectra of whole blood in the frequency range of the -dispersion (10 kHz to 200 MHz) at different temperatures. Except for the plasma, not containing any RBC’s that would cause a -process, all samples show a similar relaxational behavior and temperature dependence in this frequency regime (see Fig. 1). Just as for intrinsic relaxations, the permittivity curves in the -dispersion regime shift to higher frequencies with increasing temperature. The lines in Fig. 4 again represent the fits of the complete broadband spectra (cf. Fig. 1) using a Cole-Cole function (Eq. 2 with ) for the -relaxation. As discussed in detail in section 2.2, the -relaxation is generated by the heterogeneity of the sample material, which is composed of plasma and RBC’s. exhibits the typical steplike decrease with increasing frequency (Fig. 4(a)). Its additional increase towards the lowest frequencies observed in Fig. 4(a) corresponds to the onset of the electrode-polarization effects (cf. Fig. 3), well taken into account in the fits by the distributed RC equivalent circuit (see section 4.2). In a loss peak is expected but only its high-frequency flank can be seen (Fig. 4(b)). Its low-frequency part is superimposed by the strong ionic dc conductivity, which leads to a contribution . Thus, instead of a loss peak, only a slight shoulder at about 3 MHz is revealed.
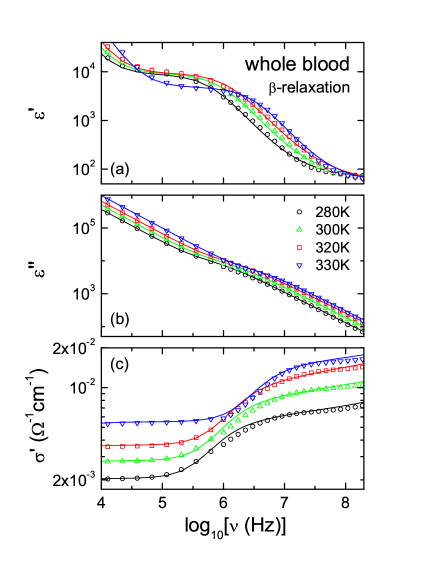
The dc conductivity also leads to the low-frequency plateau in (Fig. 4(c)) while the shoulders observed around 3 MHz arise from the relaxation. Via the relation , the nearly Debye-like behavior of the -relaxation (implying on the high frequency side of the peaks) leads to the nearly frequency independent at MHz. The low- and high-frequency plateaus of are labeled as and , respectively. The steplike increase of from to can be qualitatively understood assuming a shorting of the cell membrane capacitances at high frequencies. Thus, at high frequencies the RBC’s no longer obstruct the current path and an enhanced conductivity is detected. Therefore can be regarded as good approximation of the intrinsic conductivity of the plasma, denoted as in section 2.5 (in fact it is a mixture of plasma and cytoplasma conductivity, which we here assume to be of not too different magnitude). This is nicely corroborated by the approximate agreement of this plateau value with the conductivity of the pure plasma as seen in Fig. 1(c) for all values (the small deviations for higher values are due to the larger volume fraction of cytoplasma having somewhat lower conductivity; see section 4.3.2). The absolute values of both conductivity plateaus revealed in Fig. 4(c) increase with increasing temperature, mirroring the thermally activated ionic charge transport in the plasma.
As mentioned above, the best fitting results of the -relaxation were achieved by using a Cole-Cole function. Only for the highest hematocrit values, significant deviations of fits and experimental data were observed, which will be treated in section 4.5. The temperature dependence of the width parameter , the relaxation strength , and the relaxation time obtained from the fits are shown in Fig. 5. The present fitting of the complete broadband spectra, including the contributions from electrode polarization and the -relaxation, minimizes the influence of any additional processes on the obtained fit parameters.
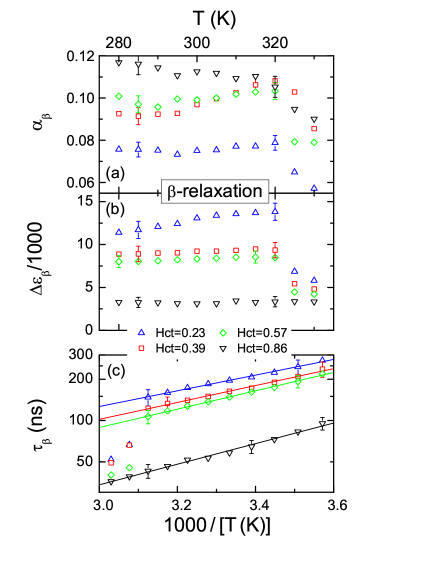
The width parameter (Fig. 5(a)), which for intrinsic relaxations usually is assumed to arise from a distribution of relaxation times [67, 68], is almost temperature independent. As assumes rather small values between 0.07 and 0.11, the process shows nearly Debye-like behavior. The width parameter increases with increasing RBC content, i.e., the deviations from the Debye case become stronger. According to the Pauly-Schwan model (see section 2.5, Eq. 10) the relaxation time depends on the conductivity outside () and inside of the cell () and on the membrane capacitance (). It is unlikely that the cell parameters or should be influenced by the hematocrit value and thus a distribution of the outer plasma conductivity seems the most likely cause of the non-Debye behavior. But also an alternative explanation seems possible: implies a shallower high-frequency flank of the -peak. This flank is essentially determined by the intrinsic plasma conductivity and corresponds to the high-frequency plateaus seen in Fig. 4(c). Thus implies an increase of with frequency, which is typical for hopping conductivity as commonly found for ionic charge transport [92, 93, 94, 95]. Finally, it has to be mentioned that additional relaxations arising from the other cell types in blood could also influence the observed -relaxation. As RBCs are by far the dominating cell species (e.g., volume fraction about 45% vs. of white blood cells), these contributions can be expected to be small. Nevertheless, it cannot be excluded that they may contribute to the observed deviations from Debye behavior.
As revealed by Fig. 5(b), the relaxation strength of the -relaxation is nearly temperature independent. Thus, according to Eq. 8, the membrane capacity also can be assumed to be temperature independent. The strong drop of at K, observed for all samples except for , is most likely due to the hemolysis of the RBC’s at high temperatures. This assumption is supported by the fact that no such deviations can be found for the -relaxation (see section 4.4), which is independent of the RBC’s. However, it is not clear why the sample with the highest RBC content (black triangles in Fig. 5(b)) remains unaffected. Possibly, cell-cell interactions prevent hemolysis at high Hct.
Figure 5(b) also reveals a decrease of the relaxation strength with increasing content of erythrocytes. This is a rather surprising result and cannot be explained within the proposed theories. Especially, it contradicts the increase of with predicted by Eq. 8. In literature, suspensions of erythrocytes and other cells using non-plasma solvents, like phosphate buffered saline, quite generally show a continuous increase of with [50, 57, 96, 97, 98]. However, blood samples (i.e. with the suspending medium being plasma) can show more complex behavior, especially for higher values [56, 99] and as shown in ref 54, substitution of plasma by some other solute can strongly influence . In the framework of a simple equivalent-circuit picture, is determined by a complex superposition of the membrane capacitances of all RBCs. Increasing the number of RBCs could lead to an increase or decrease of depending on whether parallel or series connections of the cell capacitances (relative to the field direction) are prevailing. The latter seems to be the case in our blood samples. The reason is unclear but cell aggregation as, e.g., rouleaux formation may play a role here [54, 99, 100, 101].
According to Eq. 10, the -relaxation time should depend on , , and . It was shown above that the membrane capacitance is nearly temperature independent. Thus, the conductivities should dominate the temperature dependence of . Indeed the Arrhenius representation of Fig. 5(c) reveals that is in accord with the expected thermally activated behavior, typical for ionic conductivity. The hindering barriers , calculated from the slopes in Fig. 5(c) (cf. Eq. 5), seem to slightly increase with growing and barriers varying between 0.11 and 0.15 eV were obtained. However, due to the rather small temperature region that could be covered in these biological samples (compared, e.g., to supercooled liquids [39, 40]), the significance of these values should not be overemphasized. In addition, Fig. 5(c) reveals a decrease of the relaxation times with increasing hematocrit value. In principle, such a behavior seems to be consistent with Eq. 10 but the observed variation by about a factor of three is stronger than expected. However, one should be aware that the relaxation time is directly proportional to (Eq. 10) while itself is proportional to (Eq. 8). Thus it is clear that the observed rather strong -dependent variation of is directly connected to that of revealed by Fig. 5(b).
To compare the results on the -relaxation parameters presented above with earlier publications only partly is possible, because (to the best knowledge of the authors) no such systematic (temperature and hematocrit dependent) and broadband research on human blood has been done before. Moreover, the available literature values deviate quite strongly from each other. For various erythrocyte suspensions, the reported values of the relaxation time are, for example, 254 ns (, room temperature) [50], 29 ns (, K) [102], or 230 ns (, K) [52, 103]. In blood the following values were found: ns (sheep blood, K) [46], ns (human blood K, ) [25], and ns (bovine blood, room temperature, ) [13]. The values in the present work vary between 35.9 ns (, K) and 274.1 ns (, K). The literature results for the relaxation strength also show rather strong variation. In ref 52, literature values between 1100 and 5000 were reported. Fricke found, dependent on , for dog, rabbit, and sheep blood [96]. For human blood, Pfützner published values between approximately 2000 and 6000 () [99]. In the present work we have obtained (for , K and , K, respectively). Even less data are available for the width parameter , because often other fitting functions were used. But mostly they are around 0.1 [46, 52, 104], similar to the values in the present work.
4.3.2 Application of Cell Models
As mentioned in section 2.5, by using appropriate models it should be possible to determine intrinsic cell parameters as the membrane capacitance or the conductivity of the cytoplasma from the parameters of the -relaxation. Using the fitting parameter and Eq. 8, the membrane capacitance can be calculated. As discussed in the previous section, the experimentally determined dielectric strength decreases with increasing , in contrast to the increase predicted by Eq. 8. The use of Eq. 8 therefore would imply a strongly -dependent membrane capacitance (see Table 1 for the results at 310 K). This can hardly be interpreted in a physical way. Literature values vary between 0.17 F/ (ref 102) and 3 F/ (ref 54). However, most authors assume a membrane capacity of about 1 F/ [52, 96, 97, 105, 106], whereas some report -dependent membrane capacities [51, 56]. Possible reasons for the unexpected behavior of and thus of were discussed in the previous section. It seems that Eq. 8 is not able to account for the observations in ”real” blood samples, in contrast to suspensions of erythrocytes in common solvents.
| ) | ||||
|---|---|---|---|---|
| 0.23 | 11 () | 0.79 () | 0.75 () | 36.9 () |
| 0.39 | 4.9 () | 0.63 () | 0.50 () | 41.5 () |
| 0.57 | 3.5 () | 0.74 () | 0.78 () | 42.0 () |
| 0.86 | 1.2 () | 0.78 () | 0.83 () | 44.7 () |
Using Eq. 9 should allow for the calculation of the conductivity of the suspending medium from the dc conductivity of the blood samples. also can be directly determined from the dc conductivity of the plasma, measured in the present work ( at 310 K). The calculated values are provided in Table 1. While being nearly -independent as expected, they differ from the directly measured value by a factor of about two. Again cell aggregation causing a lowering of the experimentally observed may explain this finding.
Via Eq. 11, the conductivity of the cell interior can be calculated from , , and the measured -relaxation times. However, as determined from Eq. 8 shows an unphysical dependence (Table 1), also an unreasonable dependence of would result. An alternative determination of is provided by Eq. 12. Using the experimentally determined and at 310 K we arrive at the values for listed in Table 1. Literature results are distributed around [41, 42, 54, 56, 57, 98, 105, 106, 107]. Deviating results were reported by Cook [24, 25] (ca. ) and Asami [108] (ca. ). Our values for are by about a factor 2-3 smaller than the measured conductivity of the plasma, . It seems reasonable that the conductivity of the cytoplasma should be lowered by the presence of the large hemoglobin molecules and their bound water shells within the RBCs (about 37% volume fraction [41]), if compared to the conductivity of the outer plasma (see following discussion of Fig. 6 for a quantitative treatment). Indeed such behavior was found previously [42, 54, 56]. The reported ratios between about 1.5 and 2.7 are consistent with our findings. Obviously, Eq. 12 is able to provide reasonable estimates for . It is based on the determination of , which is read off at high frequencies, where the cell membranes are shorted and thus cell aggregation has no effect on the results.
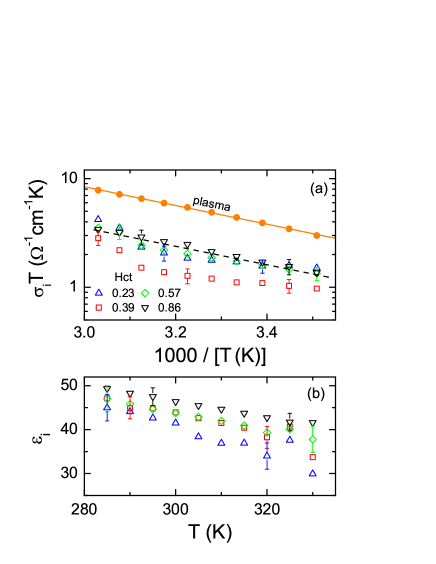
In Fig. 6(a) the temperature dependence of is shown in the Arrhenius type of presentation ( vs ) commonly used for ionic conductivity (cf Eq. 6). For comparison, also the dc conductivity determined from fits of the spectra of pure blood plasma (cf. Fig. 1) is included. In the determination of via Eq. 12, for the plasma dc conductivity was used and was calculated from the fit parameters of the -relaxation shown in Fig. 5. As the -relaxation shows slight deviations from Debye behavior, exhibits a slight increase in the region of its high-frequency plateau (see, e.g., Fig. 4(c)). As an estimate of , we used the value of at a frequency 1.5 decades above the peak frequency. Except for whole blood, the temperature dependence of is nearly independent of and seems to follow thermally activated behavior (dashed line in Fig. 6(a)). The deviations at the two highest temperatures are directly related to similar problems in the -relaxation parameters (Fig. 5). As discussed in section 4.3, this may arise from an onset of hemolysis of the RBCs. Interestingly, the energy barrier of 0.17 eV, deduced from the slope of the linear fit curve of the plasma data (solid line) is in good accord with the results on the blood samples (dashed line). Nevertheless, the absolute values of the conductivity of the cytoplasma are about a factor of 2-3 lower than those of the plasma. As mentioned in the previous paragraph, this can be explained by the presence of the hemoglobin molecules within the cell. For a quantitative estimate one can use Maxwell’s mixture equation for the effective conductivity of a suspension of particles with volume concentration [10]:
| (16) |
Here and are the conductivity of the solute and the particle, respectively. If we regard the hemoglobin molecules as insulating particles (i.e., ) suspended in plasma with the same conductivity as the extracellular plasma, we arrive at the following ratio of solute conductivity () and effective conductivity () [41]:
| (17) |
Using (ref 41), a ratio of about two is obtained, which is in quite reasonable agreement with the findings of Fig. 6(a). The energy barrier of 0.17 eV for charge transport within the intra- and extracellular plasma is of the same order of magnitude as the one deduced from (0.11 - 0.15 eV, see previous section). This seems reasonable as the temperature dependence of should be mainly governed by the conductivity of inner and outer plasma (Eq. 10). In any case one should bear in mind that the absolute values of the energy barriers have rather high uncertainty due to the restricted temperature range.
The dielectric constant of the cell interior was calculated using Eq. 13. The results for 310 K are listed in Table 1 and the temperature dependence is shown in Fig. 6(b). One should be aware that is the dielectric constant at frequencies below the onset of the -relaxation. As expected, the obtained values are smaller than the dielectric constant of the suspending medium ( - for - K, respectively), deduced from the fits of the spectra of pure plasma (see Fig. 1 for 310 K). This difference is reasonable because the main contribution to the of the plasma arises from the highly dipolar water molecules ( of water at 310 K (ref 109)) and the additional constituents of the cytoplasma (mainly hemoglobin) should lower its permittivity. In literature, values ranging around 40-70 were reported [41, 106, 107, 108]. The calculation of by Eq. 13 should provide the same results for each hematocrit value. However, as revealed by Table 1 and Fig. 6(b), the calculated increases by about 20% with increasing , pointing out the limits of the model. Similar behavior was also reported in ref 107. The decrease of with increasing temperature revealed by Fig. 6(b) is consistent with Curie behavior (Eq. 7) expected for the dielectric strength (and thus approximately also for the static dielectric constant) of dipolar materials. Here one should be aware that represents the static dielectric constant of a -like relaxation of the cell interior that will take place at higher frequencies and in fact this relaxation contributes to the actually observed -relaxation of blood (see section 4.4). The uncertainty of the data in Fig. 6(b) is too large to allow for a quantitative evaluation in terms of Eq. 7. Overall, Eq. 13 seems to lead to reasonable values of the dielectric constant of the cytoplasma. It is based on the determination of the plasma dielectric constant (experimentally determined) and , which is not influenced by possible cell aggregation effects.
An alternative determination of the dielectric properties of the RBCs is provided by the Hanai-Bruggemann model, Eqs. 14 and 15, which was especially proposed for highly concentrated suspensions. From Eq. 15 the cell conductivity was calculated, leading, however, to negative values. Using Eq. 14, the dielectric constant of the cell is found to vary between 34 () and 42 () at room temperature. Those values are slightly smaller than the ones calculated from the Pauly-Schwan theory. This is a reasonable result since the Hanai-Bruggemann model does not account for the shelled structure of the cells and thus the obtained values represent the average of cell membrane and interior. The dielectric constant of the membrane can be expected to be much lower than that of the cytoplasma (in contrast to its capacitance, which is high due to its small thickness), which leads to the reduced values of the total dielectric constant.
4.4 -Dispersion
.
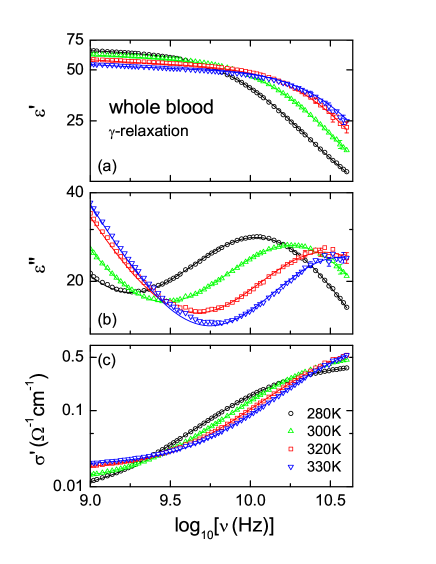
The dielectric spectra of bulk water exhibit a strong relaxation feature near 18 GHz (at room temperature) [110], which is also observed in electrolytic solutions [111]. It is commonly ascribed to the reorientational dynamics of the dipolar water molecules (but also alternative scenarios are discussed; see, e.g., ref 112) and denoted as -relaxation within the nomenclature of dipolar liquids and glass formers. The same relaxational process also arises from the free water molecules in blood samples. Figure 7 shows real and imaginary part of the permittivity (a, b) and the real part of the conductivity (c) of whole blood in the frequency range 1 to 40 GHz at different temperatures. The lines represent fits of the broadband spectra as shown in Fig. 1, using a Cole-Cole function for the -relaxation. In (Fig. 7(a)), the onset of the typical relaxation steps is seen but their high frequency plateaus, , are located beyond the investigated frequency range. Thus, exact values for could not be determined and in the fitting procedure a lower limit of 2.5 was used leading to values between 2.5 and 6. The low-frequency plateau of the -dispersion decreases with increasing temperature. The relaxation steps and loss peaks (Fig. 7(b)) show a strong temperature-dependent frequency shift due to the slowing down of the molecular dynamics with decreasing temperature. We find the Cole-Cole formula (Eq. 2 with ) to provide the best fits of the -relaxation. Figure 7(c) shows the conductivity spectra with the corresponding rise and the onset of the high frequency plateau. The low-frequency plateau of corresponds to the combined conductivity of plasma and cytoplasma as discussed in section 4.3.2. The -dispersion shows similar behavior for the other investigated samples.
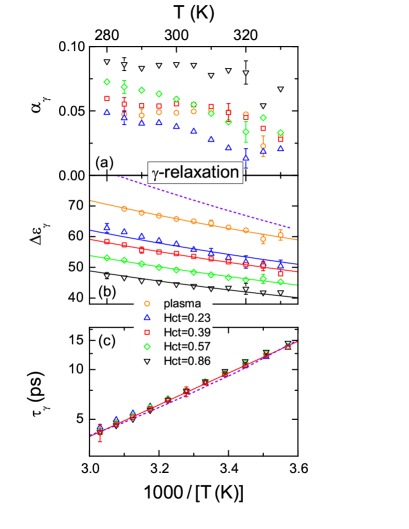
The fitting parameters of the -relaxation, , , and , are provided in Fig. 8. The width parameter (a) shows a tendency to increase with increasing . This seems reasonable as a higher number of RBC’s should lead to stronger disorder in the system and therefore the distribution of relaxation times should broaden. The observed decline of with increasing temperature, corresponding to an approach of Debye behavior, is a common phenomenon in dipolar liquids [39, 113]. It can be explained by the growing thermal fluctuations of the environment of the water dipoles. At very high temperatures, each dipole ”sees” the time average of the quickly fluctuating environment, which is the same for every dipole, leading to Debye behavior [39].
The hematocrit dependence of the relaxation strength (Fig. 8(b)) shows the expected tendency: Increasing values cause a decrease of the volume fraction of plasma and thus of water in the sample, causing the reduction of the -relaxation strength. The temperature dependence of can be well parameterized by a Curie-law, Eq. 7, (solid lines) with some deviations for only. The obtained Curie constant, , increases smoothly from 13400 to 19800 with decreasing . The dashed line in Fig. 8(b) corresponds to of pure water, calculated from the I.U.P.A.C. (International Union of Pure and Applied Chemistry) standard values for the static permittivity of bulk water [109] (see also [114]) via assuming [115, 116]. The relaxation strength of water matches the general trend revealed by the other curves in Fig. 8(b). However, obviously it shows a somewhat stronger temperature dependence. This may indicate weaker interactions between the water molecules in blood than in pure water, which can be rationalized by the presence of the other constituents of blood (e.g., proteins or salt ions).
Figure 8(c) shows the temperature dependence of the relaxation times in an Arrhenius plot. The observed linear increase is in accord with thermally activated behavior, Eq. 5. As an example, a linear fit of the data at is shown (solid line). From its slope an energy barrier of 0.19 eV is obtained. There seems to be a slight increase of energy barriers with growing value (from 0.18 to 0.20 eV). However, this variation is too small to be considered significant, especially when taking into account the rather small temperature range that could be investigated in the present experiments due to the restricted robustness of blood to stronger temperature variations. The present results agree reasonably with those reported by Cook [24] who found values for of whole blood varying between 11.9 and 7.0 ps at three temperatures between 298 and 308 K. Gabriel et al.[46] reported 8.4 ps at 310 K, about higher than our result of 6.5 ps. The dashed line in Fig. 8(c) represents of pure water as measured by Kaatze [110]. Obviously the -relaxations in the investigated blood samples exhibit nearly identical dynamics as the main relaxation of pure water. Water shows some small deviations from Arrhenius behavior, which seem to be absent in blood but these differences are of limited significance. However, one may speculate that the non-Arrhenius behavior of water arises from increasing cooperativity of the molecular motions at low temperatures as often invoked to explain corresponding findings in glass forming liquids [117, 118]. In blood, its other constituents can be expected to lead to a reduction of the direct interactions between the water molecules and thus to less cooperativity. In addition, there are speculations of a first-order phase transition in supercooled water [119], which may lead to critical power-law behavior even in the normal liquid state, thus also explaining the deviation from Arrhenius behavior in Fig. 8(c). Both scenarios are consistent with the different temperature dependence of of water and blood discussed in the previous paragraph.
4.5 Further Dispersions
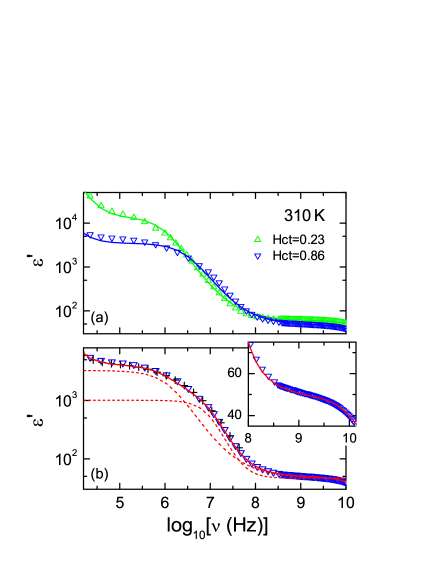
In section 4.3 it was shown that fits using the Cole-Cole function provide a reasonable description of the -relaxation region. However, there are some minor deviations of fits and experimental data especially for the higher hematocrit values. This is demonstrated in Fig. 9(a) where dielectric-constant data for the blood samples with the highest and lowest hematocrit values are shown. In contrast to the 23% sample, the fit of the spectrum of the highly concentrated sample clearly is of inferior quality. Similar deviations were previously also observed in Cole-Cole fits of data on disc-shaped rabbit-erythrocyte suspensions [57]. A close inspection of the spectrum at (Fig. 9(b)) seems to indicate that it may be composed of two separate relaxation steps. However, one could suspect an experimental artifact because in the -dispersion region the spectrum is composed of results from two different experimental methods with the transition close to 10 MHz (see section 3). To exclude this, in Fig. 9(b) additional data extending from 100 kHz to 50 MHz obtained with a different apparatus (autobalance bridge Agilent 4294A) are shown, which exactly reproduce the two other data sets. Thus, a fit using the sum of two separate relaxation contributions was performed (solid line in Fig. 9(b)). It provides an excellent description of the spectrum revealing relaxation times of ns and ns. A very similar fit using two Cole-Cole functions was shown by Asami and Yamaguchi [74] to provide a good description of data on human erythrocyte suspensions.
In blood there are various possibilities for additional relaxational processes, in addition to those considered for the explanation of the -, -, and -relaxation: (i) the reorientation of protein-bound water molecules, (ii) the hemoglobin -relaxation (i.e., the tumbling motion of the protein molecules), (iii) the motion of polar protein subgroups, (iv) the Maxwell-Wagner relaxation of the cell interior, or (v) the additional Maxwell-Wagner relaxations due to the non-spherical cell shape, to name just the most likely ones. Most of them can be simply excluded based on the very large amplitude of of the additional relaxation suggested by the fit shown in Fig. 9(b): (i) Bound water cannot have a larger than free water. (ii) The hemoglobin -relaxation in aqueous solution was found to have a of the order of 100 [12, 13, 33]. It seems unreasonable that it should be higher in the hemoglobin/cytoplasma solution of the cell interior. (iii) Polar protein subgroups can be expected to have smaller relaxation strength that the main tumbling relaxation. (iv) In principle, the capacitance of the cell interior should also be shorted at high frequencies and, indeed, the Maxwell-Wagner model of shelled particles predicts a corresponding relaxation [61]. However, for any reasonable choice of parameters this capacitance is too small to lead to any considerable contribution to and this additional relaxation usually is considered negligible [12, 13, 33]. Thus, the non-spherical shape of the RBCs seems to be the most likely cause of the additional relaxation observed in Fig. 9(b). Already in ref 12 deviations from simple relaxation behavior of erythrocyte suspensions were ascribed to the non-spherical form of RBCs and also Asami and Yamaguchi [74] explained their results in this way. As mentioned in section 2.5, the Maxwell-Wagner model for suspensions of spheroid particles predicts up to four relaxations [61] (two of them arise from the cell interior and can be neglected). However, the found relaxation-time ratio of the order of 10 is too high to be explainable by this model, at least if assuming a reasonable ratio of the two semi-diameters of the spheroids [61, 120]. The spectra on rabbit erythrocytes, mentioned above, also could not be described by the Maxwell-Wagner model for spheroid particles [57]. However, one should be aware that RBCs only roughly can be approximated by spheroids and most likely their biconcave shape plays a role in the found discrepancies.
An additional -dispersion between - and -relaxation is often invoked to explain a slow continuous decrease of , observed in the region from several 10 MHz to about 3 GHz in various biological materials, including protein solutions [12, 30, 33, 121, 122] and blood [12]. It has been ascribed to various mechanisms as the dynamics of protein-bound water molecules or polar subgroups of proteins. Indeed such a dispersion is also found in our present results on blood and becomes most pronounced for the high hematocrit values (see inset of Fig. 9 for an example). However, it can be completely described by the broadband fits promoted in the previous sections (line in inset), especially if including a second relaxation in the -relaxation region as shown in Fig. 9(b). Thus in our blood samples the apparent dispersion in this region arises from the superposition of - and -relaxation and we find no evidence for a -relaxation. However, the presence of a small -relaxation is not completely excluded by this finding.
5 Summary and Conclusions
In the present work, we have provided dielectric spectra of human blood for an exceptionally broad frequency range and at different temperatures and hematocrit values. A combination of models for the different dispersion regions enabled nearly perfect fits of the broadband spectra. The obtained fit curves represent an excellent estimate of the dielectric properties of blood for a wide range of parameters. They are provided for electronic download in the supporting information and can be employed for SAR calculations and other application purposes. The different dispersion regions have been analyzed in detail. The observed electrode-polarization effects are accounted for by an equivalent circuit model assuming a distribution of relaxation times. While our analysis of the low-frequency region cannot completely rule out the presence of an -dispersion in blood, we can satisfactorily describe our low-frequency data without invoking such a relaxation. This finding agrees with earlier results stating the absence of an -relaxation in blood [28]. The analysis of the -relaxation using standard cell models partly leads to unreasonable results for the intrinsic dielectric properties. This most likely can be ascribed to cell aggregation playing an important role in ”real” blood samples, in contrast to suspensions of erythrocytes prepared by standard solutes, often reported in literature. Cell aggregation seems to be important especially for the dielectric behavior at the low-frequency side of the -relaxation. In contrast, using only parameters determined at frequencies beyond the -peak frequency, leads to reasonable estimates of the conductivity and dielectric constant of the cell interior. In addition, we find strong hints that the -relaxation is in fact composed of two separate relaxation processes, which we ascribe to the marked deviations of the RBCs from spherical geometry.
We observe clear dispersion effects in the region between the - and -relaxation, which often is ascribed to a so-called -relaxation. However, our analysis of the broadband spectra including electrode polarization, -dispersion, and -relaxation leads to excellent fits in this region, which thus is revealed to be a superposition of different contributions and not due to a separate relaxation process. Thus, while there clearly is dispersion in blood between the - and -relaxation, there is no evidence for a -relaxation. Finally, detailed information on the -relaxation in blood is provided. Its properties closely resemble those of the relaxation caused by reorientational molecular motions in pure water. However, some minor differences arise, which seem to indicate less cooperative motions of the water molecules in blood samples.
Overall, the dielectric spectra of blood are of astonishing simplicity if considering the complexity of blood, being composed of a variety of different constituents. In fact we have described our broadband spectra without assuming any intrinsic frequency dependence in the complete range from 1 Hz up to about 1 GHz and only the -dispersion arising from the tumbling motion of the water molecules is of intrinsic nature. Of course, there is the strong -relaxation, which may be regarded as quasi-intrinsic but as it is of Maxwell-Wagner type, in a narrower sense it should be considered as artificial. However, of course for many applications (e.g., the calculation of SAR values) the overall dielectric properties and not only the intrinsic ones are of essential importance and we hope our work will serve for these purposes in the future.
6 Acknowledgements
We gratefully acknowledge the help of Dr. W. Behr, Dr. K. Doukas, and Prof. Dr. W. Ehret at the ”Klinikum Augsburg” in the taking and preparing of the blood samples.
Appendix A Supplementary data
Fit curves of the broadband spectra and fit parameters for all samples and temperatures investigated in the present work are available for electronic download.
References
- Grant et al. [1978] E. H. Grant, R. J. Sheppard, G. P. South, Dielectric behaviour of biological molecules in solution, Clarendon Press, Oxford, 1978.
- Becker et al. [1995] F. F. Becker, X. B. Wang, Y. Huang, R. Pethig, J. Vykoukal, P. R. C. Gascoyne, Separation of human breast-cancer cells from blood by differential dielectric affinity, Proc. Natl. Acad. Sci. USA 92 (1995) 860–864.
- Hayashi et al. [2010a] Y. Hayashi, Y. Katsumoto, I. Oshige, S. Omori, A. Yasuda, K. Asami, Dielectric inspection of erythrocytes, J. Non-Cryst. Solids 356 (2010a) 757–762.
- Hayashi et al. [2010b] Y. Hayashi, Y. Katsumoto, S. Omori, A. Yasuda, K. Asami, M. Kaibara, I. Uchimura, Dielectric coagulometry: A new approach to estimate venous thrombosis risk, Anal. Chem. 82 (2010b) 9769–9774.
- Ahlbom et al. [1998] A. Ahlbom, U. Bergqvist, J. H. Bernhardt, J. P. Cesarini, L. A. Court, M. Grandolfo, M. Hietanen, A. F. McKinlay, M. H. Repacholi, D. H. Sliney, J. A. J. Stolwijk, M. L. Swicord, L. D. Szabo, M. Taki, T. S. Tenforde, H. P. Jammet, R. Matthes, Guidelines for limiting exposure to time-varying electric, magnetic, and electromagnetic fields (up to 300 GHz), Health Physics 74 (1998) 494–522.
- Bassen [2003] H. Bassen, Ieee recommended practice for measurements and computations of radio frequency electromagnetic fields with respect to human exposure to such fields, 100 kHz-300 GHz (ieee std c95.3-2002), The Institute of Electrical and Electronics Engineers, New York, 2003.
- Chou [2006] C.-K. Chou, Ieee standard for safety levels with respect to human exposure to radio frequency electromagnetic fields, 3 kHz to 300 GHz (ieee std c95.1-2005), The Institute of Electrical and Electronics Engineers, Inc., New York, 2006.
-
Loidl et al. [2008]
A. Loidl, P. Lunkenheimer,
R. Gulich, A. Wixforth,
M. Schneider, P. Hänggi,
G. Schmid, Untersuchungen zu der
Fragestellung, ob makroskopische dielektrische Gewebeeigenschaften auch
auf Zellebene bzw. im subzellulären Bereich uneingeschränkte
Gültigkeit besitzen. Abschlussbericht
http://www.emf-forschungsprogramm.de/forschung/dosimetrie/dosi-
metrieabges/dosi075ab.pdf, 2008. - Höber [1913] R. Höber, Messungen der inneren Leitfähigkeit von Zellen III, Arch. Ges. Physiol. 150 (1913) 15–45.
- Maxwell [1873] J. C. Maxwell, A treatise of electricity and magnetism, Part 2, Chapter 10, Oxford University Press, London, 1873.
- Wagner [1914] K. W. Wagner, Erklärung der dielektrischen Nachwirkungsvorgänge auf Grund Maxwellscher Vorstellungen, Arch. Elektrotech. 2 (1914) 371–387.
- Schwan [1957] H. P. Schwan, Electrical properties of tissue and cell suspensions, Adv. Biol. Med. Phys. 5 (1957) 147–209.
- Schwan [1983] H. P. Schwan, Electrical properties of blood and its constituents - alternating current spectroscopy, Blut 46 (1983) 185–197.
- Fricke [1923] H. Fricke, The electric capacity of cell suspensions, Phys. Rev. 21 (1923) 708–709.
- Fricke [1924] H. Fricke, A mathematical treatment of the electric conductivity and capacity of disperse systems, I. The electric conductivity of a suspension of homogenous spheroids, Phys. Rev. 24 (1924) 575–587.
- Fricke [1925a] H. Fricke, A mathematical treatment of the electric conductivity and capacity of disperse systems, II. The capacity of a suspension of conducting spheroids surrounded by a non-conducting membrane for a current of low frequency, Phys. Rev. 26 (1925a) 678–681.
- Fricke [1925b] H. Fricke, The electrical capacity of suspensions with special reference to blood, J. Gen. Physiol. 9 (1925b) 137–152.
- Cole [1928] K. S. Cole, Electric impedance of suspensions of spheres, J. Gen. Physiol. 12 (1928) 29–36.
- Dänzer [1934] H. Dänzer, Über das Verhalten biologischer Körper bei Hochfrequenz 2, Ann. Phys. 413 (1934) 783–790.
- Bruggemann [1935] D. A. G. Bruggemann, Berechnung verschiedener physikalischer Konstanten von heterogenen Substanzen. I. Dielektrizitätskonstanten und Leitfähigkeiten der Mischkörper aus isotropen Substanzen, Ann. der Phys. 24 (1935) 636–664.
- Rajewsky and Schwan [1948] B. Rajewsky, H. Schwan, Die Dielektrizitätskonstante und Leitfähigkeit des Blutes bei ultrahohen Frequenzen, Naturwissenschaften 35 (1948) 315–316.
- Schwan [1953] H. Schwan, Electrical properties of blood at ultrahigh frequencies, Am. J. of Phys. Med. 32 (1953) 144–152.
- England [1950] T. S. England, Dielectric properties of the human body for wave-lengths in the 1-10 cm range, Nature 166 (1950) 480–481.
- Cook [1951] H. F. Cook, Dielectric behaviour of human blood at microwave frequencies, Nature 168 (1951) 247–248.
- Cook [1952] H. F. Cook, A comparison of the dielectric behaviour of pure water and human blood at microwave frequencies, Br. J. Appl. Phys. 3 (1952) 249–255.
- Schwan [1954] H. P. Schwan, Die elektrischen Eigenschaften von Muskelgewebe bei Niederfrequenz, Z. Naturforsch. 9b (1954) 245–251.
- Schwan and Carstensen [1957] H. P. Schwan, E. L. Carstensen, Dielectric properties of the membrane of lysed erythrocytes, Science 125 (1957) 985–986.
- Bothwell and Schwan [1956] T. P. Bothwell, H. P. Schwan, Electrical properties of the plasma membrane of erythrocytes at low frequencies, Nature 178 (1956) 265–266.
- Schwan et al. [1962] H. P. Schwan, G. Schwarz, J. Maczuk, H. Pauly, On the low-frequency dielectric dispersion of colloidal particles in electrolyte solution, J. Phys. Chem. 66 (1962) 2626–2635.
- Schwan [1965] H. P. Schwan, Electrical properties of bound water, Ann. N.Y. Acad. Sci. 125 (1965) 344–354.
- Grant [1965] E. H. Grant, Structure of water neighboring proteins peptides and amino acids as deduced from dielectric measurements, Ann. N.Y. Acad. Sci. 125 (1965) 418–427.
- Grant et al. [1968] E. H. Grant, S. E. Keefe, S. Takashima, Dielectric behavior of aqueous solutions of bovine serum albumin from radiowave to microwave frequencies, J. Phys. Chem. 72 (1968) 4373–4380.
- Pennock and Schwan [1969] B. E. Pennock, H. P. Schwan, Further observations on electrical properties of hemoglobin-bound water, J. Phys. Chem. 73 (1969) 2600–2610.
- Nandi et al. [2000] N. Nandi, K. Bhattacharyya, B. Bagchi, Dielectric relaxation and solvation dynamics of water in complex chemical and biological systems, Chem. Rev. 100 (2000) 2013–2045.
- Feldman et al. [2003] Y. Feldman, I. Ermolina, Y. Hayashi, Time domain dielectric spectroscopy study of biological systems, IEEE Trans. Dielectr. Electr. Insul. 10 (2003) 728–753.
- Knocks and Weingartner [2001] A. Knocks, H. Weingartner, The dielectric spectrum of ubiquitin in aqueous solution, J. Phys. Chem. B 105 (2001) 3635–3638.
- Thomas et al. [2008] G. E. Thomas, S. Bone, G. Drago, Determination of protein denaturation and glass transition temperatures using high-frequency time domain reflectometry, J. Phys. Chem. B 112 (2008) 15903–15906.
- Sasisanker and Weingartner [2008] P. Sasisanker, H. Weingartner, Hydration Dynamics of Water near an Amphiphilic Model Peptide at Low Hydration Levels: A Dielectric Relaxation Study, Chemphyschem 9 (2008) 2802–2808.
- Lunkenheimer et al. [2000] P. Lunkenheimer, U. Schneider, R. Brand, A. Loidl, Glassy dynamics, Contemp. Phys. 41 (2000) 15–36.
- Kremer and Schönhals [2002] F. Kremer, A. Schönhals (Eds.), Broadband dielectric spectroscopy, Springer, Berlin, 2002.
- Pauly and Schwan [1966] H. Pauly, H. P. Schwan, Dielectric properties and ion mobility in erythrocytes, Biophys. J. 6 (1966) 621–639.
- Krupa et al. [1972] J. Krupa, B. Kwiatkow, J. Terlecki, Method of calculating conductivity of human erythrocytes interior based on measurement of electric magnitudes of suspension, Biophysik 8 (1972) 227–236.
- Schanne et al. [1978] O. Schanne, P. Ruiz, E. Ceretti, Impedance measurements in biological cells, John Wiley & Sons, 1978.
- Pethig [1979] R. Pethig, Dielectric and electronic properties of biological materials, John Wiley & Sons, Chichester, 1979.
- Gabriel et al. [1996a] S. Gabriel, R. W. Lau, C. Gabriel, The dielectric properties of biological tissues. 2. Measurements in the frequency range 10 Hz to 20 GHz, Phys. Med. Biol. 41 (1996a) 2251–2269.
- Gabriel et al. [1996b] S. Gabriel, R. W. Lau, C. Gabriel, The dielectric properties of biological tissues. 3. Parametric models for the dielectric spectrum of tissues, Phys. Med. Biol. 41 (1996b) 2271–2293.
- Foster and Schwan [1989] K. R. Foster, H. P. Schwan, Dielectric properties of tissues and biological materials: a critical review, Crit. Rev. Biomed. Eng. 17 (1989) 25–104.
- Foster and Schwan [1995] K. R. Foster, H. P. Schwan, Dielectric properties of tissues, in: C. Polk, E. Postow (Eds.), Handbook of Biological Effects of Electromagnetic Fields, CRC Press, Boca Raton, 2. edition, 1995.
- Markx and Davey [1999] G. H. Markx, C. L. Davey, The dielectric properties of biological cells at radiofrequencies: Applications in biotechnology, Enzyme and Microbial Technology 25 (1999) 161–171.
- Lisin et al. [1996] R. Lisin, B. Z. Ginzburg, M. Schlesinger, Y. Feldman, Time domain dielectric spectroscopy study of human cells.1. Erythrocytes and ghosts, Biochim. Biophys. Acta 1280 (1996) 34–40.
- Zhao [1993] T. X. Zhao, Electrical impedance and hematocrit of human blood with various anticoagulants, Physiol. Meas. 14 (1993) 299–307.
- Bordi et al. [1997] F. Bordi, C. Cametti, R. Misasi, R. Depersio, G. Zimatore, Conductometric properties of human erythrocyte membranes: dependence on haematocrit and alkali metal ions of the suspending medium, Eur. Biophys. J. 26 (1997) 215–225.
- Jaspard et al. [2003] F. Jaspard, M. Nadi, A. Rouane, Dielectric properties of blood: an investigation of haematocrit dependence, Physiol. Meas. 24 (2003) 137–147.
- Beving et al. [1994] H. Beving, L. E. G. Eriksson, C. L. Davey, D. B. Kell, Dielectric-properties of human blood and erythrocytes at radio frequencies (0.2-10 MHz) - dependence on cell-volume fraction and medium composition, Eur. Biophys. J. 23 (1994) 207–215.
- Bao et al. [1994] J. Z. Bao, C. C. Davis, M. L. Swicord, Microwave dielectric measurements of erythrocyte suspensions, Biophys. J . 66 (1994) 2173–2180.
- Chelidze [2002] T. Chelidze, Dielectric spectroscopy of blood, J. Non-Cryst. Solids 305 (2002) 285–294.
- Hayashi et al. [2008] Y. Hayashi, I. Oshige, Y. Katsumoto, S. Omori, A. Yasuda, K. Asami, Dielectric inspection of erythrocyte morphology, Phys. Med. Biol. 53 (2008) 2553–2564.
- Pauly and Schwan [1959] H. Pauly, H. P. Schwan, Über die Impedanz einer Suspension von kugelförmigen Teilchen mit einer Schale, Z. Naturforsch. 14B (1959) 125–131.
- Hanai [1960] T. Hanai, Theory of the dielectric dispersion due to the interfacial polarization and its application to emulsions, Kolloid Z. 171 (1960) 23–31.
- Looyenga [1965] H. Looyenga, Dielectric constants of heterogeneous mixtures, Physica 31 (1965) 401–406.
- Asami [2002] K. Asami, Characterization of heterogeneous systems by dielectric spectroscopy, Prog. Polymer Science 27 (2002) 1617–1659.
- Hanai [1961] T. Hanai, A remark on theory of dielectric dispersion due to interfacial polarization, Kolloid Z. 175 (1961) 61–62.
- Hanai [1968] T. Hanai, Electrical properties of emulsions, in: Emulsion Science, Academic Press, London, 1968.
- Katsumoto et al. [2008] Y. Katsumoto, Y. Hayashi, I. Oshige, S. Omori, N. Kishii, A. Yasuda, K. Asami, Dielectric cytometry with three-dimensional cellular modeling, Biophys. J. 95 (2008) 3043–3047.
- Lunkenheimer et al. [2002] P. Lunkenheimer, V. Bobnar, A. Pronin, A. Ritus, A. Volkov, A. Loidl, Origin of apparent colossal dielectric constants, Phys. Rev. B 22 (2002) 052105.
- Debye [1929] P. Debye, Polar molecules, Dover Publications, Inc., New York, 1929.
- Sillescu [1999] H. Sillescu, Heterogeneity at the glass transition: a review, J. Non. Cryst. Solids 243 (1999) 81–108.
- Ediger [2000] M. D. Ediger, Spatially heterogeneous dynamics in supercooled liquids, Annu. Rev. Phys. Chem. 51 (2000) 99–128.
- Havriliak and Negami [1966] S. Havriliak, S. Negami, A complex plane analysis of alpha-dispersions in some polymers, J. Polym. Sci. C 14 (1966) 99–117.
- Havriliak and Negami [1967] S. Havriliak, S. Negami, A complex plane analysis of dielectric and mechanical relaxation process in some polymers, Polymer 8 (1967) 161–210.
- Cole and Cole [1941] K. S. Cole, R. H. Cole, Dispersion and absorption in dielectrics, J. Chem. Phys. 9 (1941) 341–351.
- Davidson and Cole [1950] D. W. Davidson, R. H. Cole, Dielectric relaxation in glycerine, J. Chem. Phys. 18 (1950) 1417–1417.
- Cole and Davidson [1952] R. H. Cole, D. W. Davidson, High frequency dispersion in n - propanol, J. Chem. Phys. 20 (1952) 1389 –1391.
- Asami and Yamaguchi [1999] K. Asami, T. Yamaguchi, Electrical and morphological changes of human erythrocytes under high hydrostatic pressure followed by dielectric spectroscopy, Annals Biomed. Eng. 27 (1999) 427–435.
- Gheorghiu [1999] E. Gheorghiu, On the limits of ellipsoidal models when analyzing dielectric behavior of living cells - emphasis on red blood cells, Ann. N.Y. Acad. Sci. 873 (1999) 262–268.
- Di Biasio and Cametti [2005] A. Di Biasio, C. Cametti, Effect of the shape of human erythrocytes on the evaluation of the passive electrical properties of the cell membrane, Bioelectrochemistry 65 (2005) 163–169.
- Merla et al. [2006] C. Merla, M. Liberti, F. Apollonio, C. Nervi, G. D’Inzeo, Dielectric spectroscopy of blood cells suspensions: study on geometrical structure of biological cells., Conf Proc IEEE Eng Med Biol Soc 1 (2006) 3194–7.
- Sudsiri et al. [2007] J. Sudsiri, D. Wachner, J. Gimsa, On the temperature dependence of the dielectric membrane properties of human red blood cells, Bioelectrochemistry 70 (2007) 134–140.
- Hayashi et al. [2009] Y. Hayashi, Y. Katsumoto, I. Oshige, S. Omori, A. Yasuda, K. Asami, The effects of erythrocyte deformability upon hematocrit assessed by the conductance method, Phys. Med. Biol. 54 (2009) 2395–2405.
- Oncley [1942] J. L. Oncley, The investigation of proteins by dielectric measurements, Chem. Rev. 30 (1942) 433–450.
- Schwan [1968] H. P. Schwan, Electrode polarization impedance and measurements in biological materials, Ann. N. Y. Acad. Sci. 148 (1968) 191–209.
- MacDonald et al. [1987] J. R. MacDonald, I. D. Raistrick, D. R. Franceschetti, The electrical analogs of physical and chemical processes, in: Impedance Spectroscopy, John Wiley & Sons, New York, 1. edition, 1987.
- Bordi et al. [2001] F. Bordi, C. Cametti, T. Gili, Reduction of the contribution of electrode polarization effects in the radiowave dielectric measurements of highly conductive biological cell suspensions, Bioelectrochem. 54 (2001) 53–61.
- Zarzycki [1991] J. Zarzycki, Glasses and the vitreous state, Cambridge University Press, Cambridge, 1. edition, 1991.
- Debye [1912] P. Debye, Einige resultate einer kinetischen theorie der isolatoren, Phys. Z. 3 (1912) 97–100.
- Onsager [1936] L. Onsager, Electric moments of molecules in liquids, J. Am. Chem. Soc. 58 (8) (1936) 1486–1493.
- Schneider et al. [2001] U. Schneider, P. Lunkenheimer, A. Pimenov, R. Brand, A. Loidl, Wide range dielectric spectroscopy on glass-forming materials: an experimental overview, Ferroelectrics 249 (2001) 89–98.
- Böhmer et al. [1989] R. Böhmer, M. Maglione, P. Lunkenheimer, A. Loidl, Radio-frequency dielectric measurements at temperatures from 10 K to 450 K, J. Appl. Phys. 65 (1989) 901–904.
- Nyikos and Pajkossy [1985] L. Nyikos, T. Pajkossy, Fractal dimension and fractional power frequency-dependent impedance of blocking electrodes, Electrochim. Acta 30 (1985) 1533–1540.
- Liu [1985] S. H. Liu, Fractal model for the ac response of a rough interface, Phys. Rev. Lett. 55 (1985) 529–532.
- Pajkossy and Nyikos [1986] T. Pajkossy, L. Nyikos, Impedance of fractal blocking electrodes, J. Electrochem. Soc. 133 (1986) 2061–2064.
- Jonscher [1983] A. K. Jonscher, Dielectric relaxations in solids, Chelsea Dielectrics Press, London, 1983.
- Elliott [1987] S. R. Elliott, Ac conduction in amorphous-chalcogenide and pnictide semiconductors, Advances In Physics 36 (1987) 135–218.
- Elliott and Owens [1989] S. R. Elliott, A. P. Owens, The diffusion-controlled relaxation model for ionic transport in glasses, Philos. Mag. B 60 (1989) 777–792.
- Funke [1993] K. Funke, Ion dynamics and correlations - translational and localized ionic hopping motion in solid electrolytes, Philos. Mag. A 68 (1993) 711–724.
- Fricke [1953] H. Fricke, Relation of the permittivity of biological cell suspensions to fractional cell volume, Nature 172 (1953) 731–732.
- Davey et al. [1992] C. L. Davey, H. M. Davey, D. B. Kell, On the dielectric properties of cell suspensions at high volume fractions, Bioelectrochem. Bioenerg. 28 (1992) 319–340.
- Bordi et al. [2002] F. Bordi, C. Cametti, T. Gili, Dielectric spectroscopy of erythrocyte cell suspensions. a comparison between Looyenga and Maxwell-Wagner-Hanai effective medium theory formulations, J. Non-Cryst. Solids 305 (2002) 278–284.
- Pfützner [1984] H. Pfützner, Dielectric analysis of blood by means of a raster-electrode technique, Med. Biol. Eng. Comput. 22 (1984) 142–146.
- Pribush et al. [1999] A. Pribush, H. J. Meiselman, D. Meyerstein, N. Meyerstein, Dielectric approach to the investigation of erythrocyte aggregation: I. experimental basis of the method, Biorheology 36 (1999) 411–423.
- Pribush et al. [2000] A. Pribush, H. J. Meiselman, D. Meyerstein, N. Meyerstein, Dielectric approach to investigation of erythrocyte aggregation. ii. kinetics of erythrocyte aggregation-disaggregation in quiescent and flowing blood, Biorheology 37 (2000) 429–441.
- Bordi et al. [1990] F. Bordi, C. Cametti, A. Dibiasio, Determination of cell membrane passive electrical properties using frequency domain dielectric spectroscopy technique - a new approach, Biochim. Biophys. Acta 1028 (1990) 201–204.
- Davey and Kell [1989] C. L. Davey, D. Kell, Electrical field phenomena in biological systems, volume 21, Institute of Physics, London, 1989.
- Gabriel and Gabriel [2007] C. Gabriel, S. Gabriel, Dielectric properties of body tissues - appendix b: part 1: literature survey http://niremf.ifac.cnr.it/tissprop/#over, 1997-2007.
- Ballario et al. [1984] C. Ballario, A. Bonincontro, C. Cametti, A. Rosi, L. Sportelli, Conductivity of normal and pathological human erythrocytes (homozygous beta-thalassemia) at radiowave frequencies, Z. Naturforsch., C: Biosci. 39 (1984) 160–166.
- Asami et al. [1989] K. Asami, Y. Takahashi, S. Takashima, Dielectric properties of mouse lymphocytes and erythrocytes, Biochim. Biophys. Acta 1010 (1989) 49–55.
- Bianco et al. [1979] B. Bianco, G. P. Drago, M. Marchesi, C. Martini, G. S. Mela, S. Ridella, Measurements of complex dielectric constant of human sera and erythrocytes, IEEE Trans. Instrum. Meas 28 (1979) 290–295.
- Asami et al. [1980] K. Asami, T. Hanai, N. Koizumi, Dielectric approach to suspensions of ellipsoidal particles covered with a shell in particular reference to biological cells, Jpn. J. Appl. Phys. 19 (1980) 359–365.
- Kienitz and Marsh [1981] H. Kienitz, K. N. Marsh, Recommended reference materials for realization of physicochemical properties section - permittivity, Pure Appl. Chem. 53 (1981) 1847–1862.
- Kaatze [1989] U. Kaatze, Complex permittivity of water as a function of frequency and temperature, J. Chem. Eng. Data 34 (1989) 371–374.
- Gulich et al. [2009] R. Gulich, M. Köhler, P. Lunkenheimer, A. Loidl, Dielectric spectroscopy on aqueous electrolytic solutions, Radiat. Environ. Biophys. 48 (2009) 107–114.
- Kaatze et al. [2002] U. Kaatze, R. Behrends, R. Pottel, Hydrogen network fluctuations and dielectric spectrometry of liquids, J. Non-Cryst. Solids 305 (2002) 19–28.
- Schönhals et al. [1993] A. Schönhals, F. Kremer, A. Hofmann, E. W. Fischer, E. Schlosser, Anomalies in the scaling of the dielectric alpha-relaxation, Phys. Rev. Lett. 70 (1993) 3459–3462.
- Ellison [2007] W. J. Ellison, Permittivity of pure water, at standard atmospheric pressure, over the frequency range 0-25 thz and the temperature range 0-100 degrees c, J. Phys. Chem. Ref. Data 36 (2007) 1–18.
- Hasted [1973] J. B. Hasted, Aqueous dielectrics, Chapman and Hall, London, 1973.
- Buchner et al. [1999] R. Buchner, J. Barthel, J. Stauber, The dielectric relaxation of water between 0 degrees C and 35 degrees C, Chem. Phys. Lett. 306 (1999) 57–63.
- Ediger et al. [1996] M. D. Ediger, C. A. Angell, S. R. Nagel, Supercooled liquids and glasses, J. Phys. Chem. 100 (1996) 13200–13212.
- Ngai [2000] K. L. Ngai, Dynamic and thermodynamic properties of glass-forming substances, J. Non-Cryst. Solids 275 (2000) 7–51.
- Angell [2008] C. A. Angell, Insights into phases of liquid water from study of its unusual glass-forming properties, Science 319 (2008) 582–587.
- Asami [2002] K. Asami, Characterization of biological cells by dielectric spectroscopy, J. Non-Cryst. Solids 305 (2002) 268–277.
- Grant [1966] E. H. Grant, Dielectric dispersion in bowine serum albumen, J. Mol. Biol. 19 (1966) 133–139.
- Grant et al. [1974] E. H. Grant, B. G. R. Mitton, G. P. South, R. J. Sheppard, Investigation by dielectric methods of hydration in myoglobin solutions, Biochem. J. 139 (1974) 375–380.