Unveiling the mask on the ULIRG-to-QSO transition object [H89]1821+643 at z=0.3: a gas-poor/gas-rich galaxy merger and the implications for CO-based dynamical mass estimates
Abstract
We report the detection of the CO emission line in [H89]1821+643, one of the most optically luminous QSOs in the local Universe and a template ULIRG-to-QSO transition object, located in a rich cool-core cluster at . The CO emission is likely to be extended, highly asymmetric with respect to the center of the host elliptical where the QSO resides, and corresponds to a molecular gas mass of M⊙. The dynamical mass enclosed by the CO line emission region could amount up to M⊙ (80% of the total mass of the elliptical host). The bulk of the CO emission is located at kpc south-east from the nuclei position, and close to a faint optical structure, suggesting that the CO emission could either represent a gas-rich companion galaxy merging with the elliptical host or a tail-like structure reminiscent of a previous interaction. We argue that the first scenario is more likely given the large masses implied for the CO source, which would imply a highly asymmetric elliptical host. The close alignment between the CO emission major axis and the radio-plume suggests a possible role of the latter excitation of the ambient gas reservoir. The stacking technique was used to search for CO emission and 3mm continuum emission from galaxies in the surrounding cluster, however no detection was found either toward individual galaxies or the stacked ensemble of galaxies, with a limit of M⊙ for the molecular gas.
Subject headings:
galaxies clusters: general — galaxies:formation — galaxies: evolution — galaxies individual (J1821+643) — galaxies: ISM — galaxies:starburst — galaxies: QSOs: general1. Introduction
In the general picture for QSO and stellar spheroid formation, two gas-rich disk galaxies merge and the large amount of gas, compressed and shocked by the interaction, trigger intense starburst activity in the system, which is seen as a powerful IR luminous galaxy (so called Ultra Luminous IR Galaxies – ULIRGs; Sanders & Mirabel 1996). As the system evolves, the gas flows into its central region, likely feeding an active galactic nuclei (AGN). When the black-hole has grown enough in size and luminosity, feedback and gas consumption from star-formation and AGN activity eventually dissipates the dust and an optically luminous QSO emerges (Di Matteo et al. 2005). Once AGN activity subsides, the galaxy evolves into a massive spheroid, hosting a quiescent super-massive black-hole (SMBH) at its center. In this scenario, optically and IR luminous QSOs with warm IR colors () represent the rare ULIRG-to-QSO transition objects (Sanders et al. 1988a, b).
Observations of CO line emission found large amounts of molecular gas associated with these ULIRG-to-QSO systems, in support of an evolutionary scenario (e.g. Sanders et al. 1989; Young & Scoville 1991; Sanders & Mirabel 1996). However, due to the necessarily low resolution of single-dish telescopes, poor sensitivity of the few interferometric CO maps available and the lack of high-resolution optical images (e.g. with the HST) for most of these objects, few studies were able to determine the location of the molecular gas reservoir respect to the powerful QSO. Scoville et al. (2003) imaged the CO line emission from a number of the most optically luminous PG QSOs, which are thought to be the end-product of the starburst-to-QSO transition. Interestingly, large amounts of gas, similar to that found in ULIRGs, where found in these objects. The conclusion drawn from these observations was that, assuming that the CO emission and starburst activity are well centered around the nuclei, the QSO host galaxies should be late-type spirals (Scoville et al. 2003). However, this contradicts the fact that most of these objects are typically found to have giant elliptical host galaxies in the optical.
| Source | a | b | c | Mgas d | e | ||
|---|---|---|---|---|---|---|---|
| (J2000) | (J2000) | (mJy beam-1) | (Jy km s-1) | ( M⊙) | (mJy) | ||
| H1821+643………… | … | … | 0.2970 | … | |||
| Companion †………… | 0.2974 |
† CO emitting source.
a redshift for H1821+643 nuclei taken from (Schneider et al. 1992)
b Peak emission measured in a CO image averaged over the line FWHM.
c Velocity and area integrated CO emission.
d Gas mass computed from the measured CO integrated flux and using a XCO prescription as explained in the text.
e Continuum flux density at 93 GHz.
Recently, sensitive high-resolution interferometric CO observations of a template ULIRG-to-QSO transition system, HE0450-2958 at , along with Hubble Space Telescope (HST) imaging found a merger between a gas-rich spiral and a gas-poor elliptical, instead of an optically luminous QSO hosted by a late-type gas-rich spiral in this system (Papadopoulos et al. 2008a). Here, the optically luminous QSO lies outside the molecular gas reservoir, which is rather identified with a massive but obscured companion galaxy (Papadopoulos et al. 2008a; Elbaz et al. 2009). High-resolution IR observations of this object support this assertion, and suggest also a more complex scenario where the QSO radio jet alters the state of the ISM and possibly induces a starburst in the gas-rich member of the interaction (Klamer et al. 2004; Feain et al. 2007; Elbaz et al. 2009). Gas-poor/gas-rich galaxy interactions “igniting” powerful QSOs and starbursts are expected to be common under the hierarchical framework of structure formation (Springel et al. 2005). Moreover, an important consequence of unrelaxed dynamical merger configurations between a gas-rich system and a large QSO-hosting elliptical would be the serious under-estimation of the dynamical mass of the latter, an effect already noted for more orderly (but still unrelaxed) gas-rich spirals at high redshifts (Daddi et al. 2010). This can have direct impact on CO-based estimates of QSO host galaxy masses at high redshifts (Wang et al. 2010) if they involve such mergers. Thus, such reported ULIRG-to-QSO transition objects must be revisited with high resolution CO and optical imaging, in order to reveal the detailed dynamic configurations of the molecular gas reservoirs with respect to the AGN, and investigate the possible role of the latter in the formation of galaxies. For local powerful QSOs, typically hosted by well-characterized large ellipticals with known masses (Floyd et al. 2004), high resolution CO observations can serve as excellent test-beds of the accuracy of dynamical mass estimates using CO lines.
One of the most prominent local templates of candidate ULIRG-to-QSO transition objects is IR/optically luminous QSO [HB89]1821+643 system (hereafter H1821+643) at . In this paper, we report CO emission line observations of this system using the Combined Array for Research in Millimeter-wave Astronomy (CARMA). These observations directly trace the bulk of molecular gas, which is the fuel for star-formation. We use a concordance CDM cosmology throughout, with km s-1 Mpc-1, and (Spergel et al. 2007).
2. Observations
2.1. H1821+643
With an optical absolute magnitude at a redshift of 0.297, H1821+643 is one of the most luminous QSOs in the local universe (Hutchings & Neff 1991; Schneider et al. 1992). H1821+643 has been subject to a number of studies aimed at determining the morphology of its host galaxy. This bright QSO is hosted by a giant elliptical galaxy, with a half-light radius of kpc in extent, as revealed by modeling of the point-spread function (PSF) subtracted HST images (McLeod & McLeod 2001; Floyd et al. 2004). The luminous nuclear component outshines the underlying host with a luminosity ratio of in the HST I-band (Floyd et al. 2004). H1821+643 lies in a massive galaxy cluster with optical richness class 2 (Lacy et al. 1992). X-ray observations show this corresponds to a strong cool-core cluster with a cooling time of 1 Gyr, a decrease of temperature in the cluster center from to keV, and a mass accretion rate from the central engine of 40 M⊙ yr-1 (Russell et al. 2010).
Radio continuum imaging of this H1821+643 indicates this is a radio-quiet QSO, with a radio-lobe extending out to 250 kpc from the bright core in south-west direction (Papadopoulos et al. 1995; Blundell & Lacy 1995; Blundell et al. 1996; Blundell & Rawlings 2001). The radio-lobe appears to bend by in projection on sub-arcsec scales, suggesting that the radio axis is precessing, which implies a SMBH binary system at its nuclei (Blundell & Rawlings 2001) that has possibly already merged (Robinson et al. 2010). Interestingly, this object has radio luminosities at the transition to separate radio quiet and radio loud QSOs and also at the transition between FRI and FRII structures (Blundell & Rawlings 2001).
2.2. CO observations

Observations of the 12CO emission line (rest frequency: 115.271 GHz) were performed using CARMA in C-configuration with two overlapping target fields. The first field was observed during October to November 2008 centered at , (6 tracks; centered at the position of H1821+643). Observations of the second field were obtained during March 2010 in 2 tracks centered at , , south-east of the first pointing. We offset the second pointing to allow us to simultaneously observe H1821+643 plus another source of interest in the field. This object will be studied in a separate publication. The observations were taken under good millimeter weather conditions with .
We used the 3 mm receivers tuned to 88.8751 GHz (lower sideband). Three bands (or spectral windows) of 15 channels each and 31.25 MHz per channel were used. These bands were put together to roughly cover GHz in frequency. For the 2010 observing runs, the three bands were overlapped by 2 channels in order to improve the bandpass calibration, and the edge channels were flagged. In the 2008 runs, however, the bands were not overlapped and thus no flagging of the edge channels could be performed as it would translate in spectral gaps. This resulted in a loss of sensitivity in channels with velocities of km s-1. After combining all datasets, the effective bandwidth was GHz. The large bandwidth allowed us to search for emission not only from H1821+643 but also from galaxies in its dense environment. The upper sideband was tuned to GHz to obtain an independent measurement of the continuum emission.
We observed the nearby source J1849670 (distance to target 3.9∘) every 15 min for amplitude and phase calibration. The strong calibrators J1927+739, 3C273 and 3C454.3 were used for bandpass calibration. Neptune and MWC349 were used for absolute flux calibration. Pointing was checked every hour using the optical and radio methods (Corder et al. 2010). The data were edited and calibrated using a combination of MIRIAD and CASA tasks. The first and last edge channels where the bandpass deteriorated were flagged accordingly. The large primary beam of CARMA at the observing frequency () allowed us to partially overlap the two pointings resulting in a 20% increase in sensitivity. We subtracted the continuum emission from our data in the plane by fitting the continuum with a polynomial of order 1, using line-free channels to estimate the continuum level. This is particularly important for the H1821+643 line emission, for which strong continuum from the jet is expected (see below).
The naturally weighted visibilities were imaged and deconvolved using CLEAN to a residual of approximately 1, where is the noise level, in a box centered in H1821+643. The final images reach a sensitivity of mJy per 120 km s-1 channel in each field, with a clean beam size of and a position angle of .
3. Results
3.1. CO and continuum emission in H1821+643
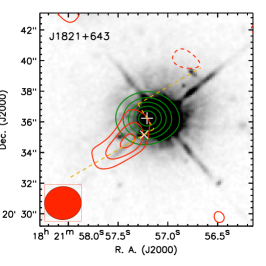
Figure 1 shows the CO velocity-integrated emission map and the corresponding spectrum averaged over the emitting region towards H1821+643. A Gaussian fit to the spectrum indicates an emission line with a full-width at half maximum (FWHM) of km s-1 and centered at km s-1 from the optical redshift (Schneider et al. 1992). By fitting an elliptical Gaussian profile to the integrated CO map, we find that the emission appears to be extended along the major axis with a scale of or kpc, however it is unresolved along the minor axis (Position Angle ). By fixing the extent of the emission to that value, we estimate an integrated CO emission of 2.30.5 Jy km s-1. The source is centered at and , with a positional uncertainty from the fit of , in agreement with the expected positional uncertainty given by , where SNR corresponds to the signal to noise ratio and is the half-power beam width (HPBW).
H1821+643 has an integrated continuum emission of mJy and mJy at 88.9 GHz and 93.1 GHz, respectively. The source is centered at and , with an uncertainty in the fit of . The emission is slightly resolved with a deconvolved size of or kpc. As shown in Fig. 1, the continuum emission can be easily identified with the location of the radio core of this QSO (Blundell et al. 1996).
3.2. Previous reported CO observations of H1821+643
Previous searches for CO in this object with the IRAM 30m telescope failed detect any emission (Alloin et al. 1992; Combes et al. 2011). Combes et al. (2011) reports a limit of 1.7 Jy km s-1 in a 300 km s-1 channel. In order to directly compare this upper limit with our observations, we deconvolved the visibilities to a coarser velocity resolution of 300 km s-1, matching the one used by Combes et al., around the central velocity of the line profile. Integrating spatially over the emission area and over the velocity range covered, we find an integrated flux density of Jy km s-1 over a 300 km s-1 channel, which is about 2.3 times deeper that Combes et al. observations. Hence, this explains why the CO emission line was undetected previously.
3.3. Gas off the nuclei: a gas-rich/gas-poor galaxy merger or tail-like structure?
The CO emission line from H1821+643 is located (about 1 synthesized beam; kpc) south-east of the radio-core position, and ( kpc) south-east of the optical center (host galaxy). Based on analysis of PSF subtracted HST optical images, Floyd et al. (2004) find a nebulous optical structure. Floyd et al., however, point out that such optical feature may correspond to an artifact of the PSF subtraction procedure.
The CO position coincides with the location of this optical structure, giving support to the reality of such feature. Indeed, the bulk of the molecular gas is located at only , well within the uncertainty in the position, from an optically faint peak to its north-east (Fig. 1). Thus, this suggest that the CO emission is possibly associated with either an optically faint but gas-rich companion galaxy that is merging with the giant elliptical host, or with an asymmetric tail-like structure within the host galaxy reminiscent of a previous merger event. Note, however, that the powerful AGN is hosted by a giant elliptical galaxy, and large amounts of molecular gas (M(H2) M⊙) such as that observed here (see below) are rare in early-type galaxies (Crocker et al. 2011). Only 3 out of 56 early-type galaxies in the Virgo cluster have molecular gas masses M⊙ (Young et al. 2011), being statistically unlikely that the molecular gas observed in H1821+643 is related to the host galaxy. Although it is still plausible that the gas could be related to a tail, relic of a past merger, the substantial amounts of molecular gas, its offset location with respect to the elliptical host and the existence of a starburst component in the optical-to-radio SED (see below) suggest that the CO emission actually comes from a different galaxy. If the molecular gas is indeed related to the host galaxy, it would imply a highly asymmetric gas distribution, possibly associated with a previous interaction or spiral arm, in an unusually gas-rich elliptical galaxy, likely related with starburst activity. Deep high-resolution IR observations, transparent to obscuration, are necessary to decide between both possibilities.
The CO emission is also well aligned with the radio-axis to the south-east suggesting a physical association between the radio-plume emission, the diffuse optical source and the large amounts of molecular gas. According to Blundell & Rawlings (2001), the radio jet appears to have been pointed within within the last 0.3 Gyr. Thus, the probability that the CO emission is by chance located within 7∘ is or 3.9%, where the factor 2 accounts for both radio lobes (north and south). Such probability is similar to the one found based on the alignment between the radio-axis and the CO position angle.
3.4. ISM properties
The CO luminosity (in units of K km s-1 pc2) can be derived from the line intensity following Solomon et al. (1997) as,
| (1) |
where is the velocity integrated CO flux density in units of Jy km s-1, is the observing frequency in GHz, and is the luminosity distance in Mpc at the source redshift . From our integrated CO flux, we derive (K km s-1 pc2) . The luminosity of the CO emission line is commonly used to estimate the molecular gas mass, M(H2), by using the relation M(H2)=. is the CO luminosity to gas mass conversion factor which we assume to be 0.8 M⊙ (K km s-1 pc2)-1, as it was found for local IR luminous galaxies (Downes & Solomon 1998). We thus estimate a molecular gas mass of M⊙ for the CO emitting source. This molecular gas mass is at the high end of the mass range found for local ULIRGs, and is typical of luminous submillimeter galaxies and massive disk galaxies at high-redshift (Greve et al. 2005; Solomon & Vanden Bout 2005; Daddi et al. 2010).
3.5. Dynamical mass of the CO-bright source
Due to the relatively low significance of the CO detection, it is not possible to determine the actual geometry of the CO emitting source. We estimate the dynamical mass based on the CO profile using disk geometry, which is commonly assumed for CO sources. However, we remark that our adoption of a disk geometry is not well established for our CO source and we use it only as a guide and for the purpose of comparison with other CO studies. In this case, the dynamical mass is given approximately by M. The source radius can be expressed in terms of its major axis, as kpc, and the rotational velocity is given by the CO line-width km s-1. The CO emission source has a major axis at the redshift of the source of kpc (at the level) and a minor axis limited to the beam size ( kpc). This allows us to put a limit on the inclination angle given by . This takes into account the uncertainty in the major axis and the value for the inclination angle would only increase with smaller minor axis. With these values, we find a dynamical mass of M⊙.
The observed CO distribution is highly asymmetric with respect to the QSO position itself and actually barely includes it (see Figure 1). Based on the accurate optical photometry of H1821+643 from HST images, (Floyd et al. 2004) estimates a total mass for the elliptical host galaxy of M⊙. Given the asymmetric distribution of CO-emitting gas close to the QSO host galaxy, it is indeed surprising that the dynamical mass range estimated for the CO source amounts up to of the mass of the elliptical host ( M⊙). As explained above, such large amounts of molecular gas are rare (but possible) in old giant ellipticals (Crocker et al. 2011; Young et al. 2011), and thus the CO emission could potentially arise from an obscured, merging starburst galaxy, which in this case would have an important stellar component. On the other hand, it is interesting to note that if the CO profile would have been used to estimate the QSO host galaxy dynamical mass, we would have underestimated such value by at least 20%. This is consistent with results from high-redshift disk galaxies, for which the CO-based dynamical mass was found to be underestimated by (Daddi et al. 2010).
The potential discrepancy between Mdyn(CO) and in massive mergers offers a general cautionary tale when it comes to CO-deduced dynamical mass estimates of QSO host galaxies at the higher redshifts (e.g. Wang et al. 2010).
3.6. Spectral energy distribution
Using radiative transfer models of starburst and AGN emission, Farrah et al. (2002) studied the spectral energy distribution (SED) of H1821+643. These models give a good fit to the far-IR data points although they fail to describe the emission from old stars at wavelengths shorter than 4 m. Their best fit model to the IR emission of H1821+643 indicates a composite object, with a warm AGN component that provides about 60% of the total luminosity, and a starburst component with a cold dust temperature of K and a dust mass of M⊙. Their model, however, does not make reference to the radio emission, which could contribute a significant amount to the emission at submillimeter wavelengths.
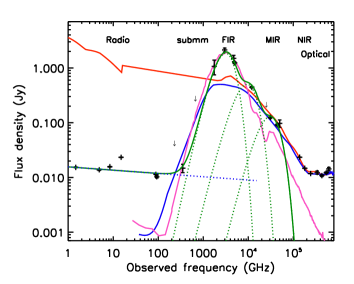
The spatial coincidence between the radio core (Blundell et al. 1996) and the peak emission in our 93 GHz continuum images of H1821+643 implies that most of this emission comes from the nuclei and that it is non-thermal. As shown in Figure 2, the flux density at GHz is compatible with the trend followed by the radio emission at lower frequencies up to 350 GHz, in support for the non-thermal nature of such emission.
In order to account for the radio continuum emission, a power-law parametrization was used, of the form , while simultaneously modeling the far-IR emission with a multi-component gray-body spectrum . Each dust component can be described by a model of the form , where is the Planck function and is the dust temperature. The dust optical depth, , is proportional to the dust mass, , and to the dust absorption coefficient , which we adopt to be equal to 0.04 cm2 gr-1 at 250 GHz (Kruegel & Siebenmorgen 1994) with (Priddey & McMahon 2001).
The best fit model is shown in Figure 2. A cold dust component is found with K and a dust mass of M⊙. A second, warmer dust component was obtained with a dust temperature of 130 K, and a dust mass of M⊙. Both components alone do not allow us to fit the shorter wavelengths data points, m , and thus we added a third, hot component with a dust temperature of K, which we expect to be biased by the unknown amount of emission from stars at these wavelengths.
The radio emission is well described by a power-law with a slope of and a flux density of mJy at 1.0 GHz. The dust model obtained is consistent with that found by Farrah et al. (2002), however the inclusion of the radio emission implied a change in the resulting cold gas temperature from 30 K to 50 K.
The cold dust component emission is identified with vigorous starburst activity, possibly related to the CO emitting source, and the warm/hot dust component emission with AGN activity. We find a total IR luminosity L⊙, with the AGN contributing with L⊙ and the starburst with L⊙. Note that although the flat spectrum radio emission contributes with about 1% of the total IR luminosity, it amounts to of the emission at 350 GHz. On the other hand, the starburst emission is negligible at 90 GHz, Jy, consistent with our observations. Finally, note that the dust mass for the cold dust component and our CO measurements imply a gas to dust mass ratio of , comparable to the values found for a sample of local far-IR selected galaxies (Dunne et al. 2000; Seaquist et al. 2004) and distant submillimeter galaxies (Greve et al. 2005; Kovács et al. 2006; Michałowski et al. 2010), but somewhat low compared to values found for ULIRGs (Wilson et al. 2008).
4. Discussion
4.1. Another possible example of jet-induced galaxy formation
Simulations predict that galaxies receive a large fraction of their gas through cold flows of intergalactic gas. Such neutral gas is found in filaments and cools effectively in massive galaxy clusters onto giant elliptical galaxies at their centers (Fabian 1994). Feedback from the central radio source may provide a mechanism for reheating the gas. It has been proposed that the cooled gas in the inner regions of the cluster may converge toward the central black-hole or collapse to form molecular gas clouds and stars (Pizzolato & Soker 2005; Russell et al. 2010). CO observations of the central massive galaxies in clusters indicate that the deposition of gas toward the central regions is indeed produced in short timescales (Edge 2001; Salomé & Combes 2003; Edge & Frayer 2003).
It is well-known that H1821+643 lies at the center of a massive cluster of galaxies (Lacy et al. 1992) and therefore the cold accretion scenario in this case is possible. The gas funneled to the center would feed the massive black-hole, and an accretion disk instability would ignite the jet emission (Russell et al. 2010). However, to start the outburst a galaxy merger scenario is more plausible since it would explain the precessing jet axis, which is likely produced by a binary black-hole system (Russell et al. 2010). Our observations suggest that the actual answer is more likely a combination of both hypotheses. The CO emission is offset from the QSO nuclei and coincident with the position of a faint optical feature to the south-east and well-aligned (position and position angle) with the southern jet axis.
X-ray observations indicate that the cluster around H1821+643 has a cooling rate of M☉ yr-1, whereas the QSO accretion rate, 40 M⊙ yr-1, is at half the Eddington limit (Russell et al. 2010). This implies that M⊙ has cooled down in the typical timescale of 1 Gyr of this cluster and is potentially available for molecular gas formation and material accretion onto the central black-hole. At this accretion rate, the QSO would only keep growing for a fairly short period of time, Gyr, since in this time it would grow larger than the upper limit that has been observed in the local Universe (Russell et al. 2010). This puts a limit on the period in which the QSO is active and might have formed jets, and is consistent with the timescale of Gyr in which the QSO jet appears to have remained within a 7∘ cone (Blundell & Rawlings 2001). This implies that the jet axis has been pointed in fairly the same direction during most of its existence.
The significant alignment between the jet axis and the companion galaxy as well as the jet lifetime (the time in which the jet has been impacting the merging galaxy) suggest that the jet could have a role in boosting star formation within the CO emitting source (Klamer et al. 2004; Feain et al. 2007; Elbaz et al. 2009). Strong jet-ISM interactions inducing highly-excited CO lines over large molecular gas reservoirs has been recently noted in 3C 293, a powerful FR II radio galaxy (Papadopoulos et al. 2008b), though its effect on the SFR (very low in 3C 293) remains far from clear (Papadopoulos et al. 2010). Examples of radio-loud QSOs where the jet aligns with the location of the bulk of molecular gas have been found at high-redshift (Klamer et al. 2004; Elbaz et al. 2009).
4.2. Searching for cold flows of gas as the origin for CO abundance
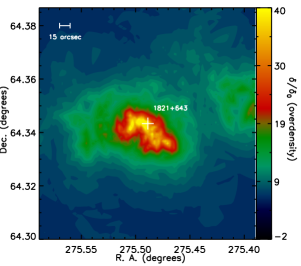
In order to test how the gas is cooling onto the massive galaxies in this galaxy cluster, we mapped the distribution of galaxies, which should roughly trace the filamentary structure and the path of intergalactic gas into the cluster core. We selected galaxies from the SDSS with photometric redshift redshifts between 0.25 and 0.35 and brighter than in an area of centered in H1821+643. A density map from the selected galaxies was constructed by creating a grid of cells and computing the number density as the 10th nearest neighbor galaxy to each cell position. Figure 3 shows the density map highlighting the position of the CO detected objects. This map is given in terms of the average density, arcmin-2, found in a control field to the south of the H1821+643 field, and thus represents the degree of overdensity () with respect to this average.
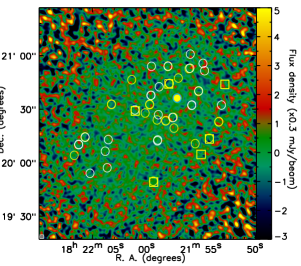
H1821+643 is well within the densest part of the cluster. Figure 3 suggests that there is density sub-structure associated with H1821+643, with the stronger density peaks following across the south-west, south-east and north-east of this source. This can also be seen in the distribution of galaxies shown in Fig. 4.
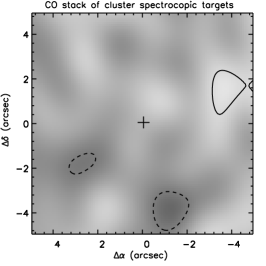
To investigate whether substantial amounts of gas have been deposited and condensed in molecular form onto other galaxies in the cluster, we performed a stacking analysis of the CO emission using the galaxies that have accurate spectroscopic redshift measurements. For this, we selected galaxies that lie within a distance of from of our target fields central pointing and in redshift range covered by the observing frequency of our observations, , from the spectroscopic samples of Tripp et al. (1998) and references therein. With this criteria only six galaxies were selected, most of them lying in the outskirts of the image where the sensitivity decreases, as shown in Fig. 4. We extracted 400 km s-1 single-channel maps centered at the position of each galaxy and with a central frequency corresponding to the galaxies redshift (e.g. ). We deconvolved the visibilities and the resulting dirty maps were thus stacked to compute a noise-weighted average map. We did not detect individual sources or their combined emission (Fig. 4). We put a limit for their average emission of 0.81 mJy per 400 km s-1, which constrains the gas mass contained on average in this galaxies to M⊙. This is consistent with the molecular gas masses found in elliptical and lenticular galaxies in the local volume, which range between M⊙ (Crocker et al. 2011), and excludes the possibility that gas-rich spirals, which typically have molecular gas masses of M⊙, are in the inner regions of the cluster.
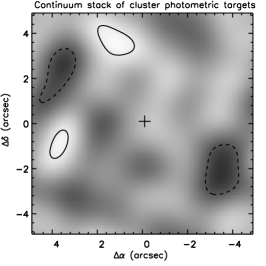
To check whether any possible bright continuum source could be contributing to the bright emission seen in FIR images, we take advantage of the comparatively high-resolution of the 3.3 mm images to search for continuum emission from the galaxies in this cluster field by using stacking. To obtain better statistics, we increased our sample of galaxies in the cluster by selecting sources from the SDSS photometric catalog with redshifts in the range , optical emission and located within from the central position of each target field. This resulted in a sample of 23 galaxies. We combined all line free bands making a total bandwidth of 4.125 GHz at GHz. Similar to the CO maps, we extracted continuum maps and deconvolved the visibilities and combined the dirty maps, which were thus stacked in a noise weighted fashion. Again no significant detection was found in the average image down to a 3 limit of 175 Jy. This implies that the only strong continuum emitter in the field is indeed H1821+643.
5. Conclusions
We have presented the detection of 12CO line emission towards the template ULIRG-to-QSO transition object [H89]1821+643. The extended CO emission is not associated with the QSO or host galaxies but is offset by about 8.8 kpc to the south-east. The molecular gas reservoir is estimated to be M⊙. The CO emission coincides with the position of an optical feature suggested by HST optical imaging. We argue that H1821+643 could either represent a merger between a gas-poor, giant elliptical and a gas-rich companion galaxy or that the CO emission could arise from a tail-like gas-rich structure within the giant elliptical galaxy.
Based on the optical emission, H1821+643 was found to have a total mass of M⊙. However, we find that the dynamical mass found for the CO source (offset from the elliptical host) based on its line profile can amount up to of the mass of the elliptical host. On one hand, this suggest that the CO source should be a different galaxy that the elliptical one because otherwise its large mass would imply an highly asymmetric stellar distribution for the elliptical host. On the other hand, this results suggest that if we had measured the elliptical dynamical mass based on the CO profile, assuming it is well centered in the elliptical, we would have underestimated its value.
We revised the dual nature of the SED of H1821+643 (starburst and QSO), and thus associate a cold dust ( K), massive starburst component with the CO emitting source, and the warm dust (130 K), AGN component with the nuclei and host galaxy. We find that the inclusion of a flat radio spectrum component, important even up to GHz, implies a higher temperature for the cold dust component respect to previous estimates.
Based on the projected density map of galaxies in the surrounding cluster field, we find that the field shows an overdensity peak to the south-east of the H1821+643 system, arguing in favor of cold flows of gas toward the inner regions of the cluster along this path. This hypothesis needs to be confirmed with sensitive CO and HI observations, in order to reveal the nature of the CO emitting source and to directly measure the total amount of neutral gas deposited in the central regions of the cluster and QSO.
The stacking technique was used to estimate the combined CO emission from galaxies in the field with spectroscopic redshifts. This allowed us to put an upper limit to the molecular gas mass of M⊙, comparable to that of typical elliptical galaxies. Additionally, the stacking analysis was used to search for 93 GHz continuum emission from a sample of photometrically-selected sources with redshifts in the range between . We found no strong continuum emitters down to a limit of 175 Jy. The lack of significant amounts of gas in cluster field galaxies hints at the importance of interactions in the central object that can trigger the gas condensation and star formation.
The results exposed above, in which the bulk of the molecular gas is well off the central QSO exemplify the importance of performing a revision of the local ULIRG-to-QSO transition objects with high spatial resolution observations. Many of these objects may have been mis-classified as post merger systems; and perhaps more importantly they are ideal targets to investigate unrelaxed gas-star configurations in which dynamical masses may have been underestimated.
References
- Alloin et al. (1992) Alloin, D., Barvainis, R., Gordon, M. A., & Antonucci, R. R. J. 1992, A&A, 265, 429
- Blundell et al. (1996) Blundell, K. M., Beasley, A. J., Lacy, M., & Garrington, S. T. 1996, ApJ, 468, L91+
- Blundell & Lacy (1995) Blundell, K. M., & Lacy, M. 1995, MNRAS, 274, L9
- Blundell & Rawlings (2001) Blundell, K. M., & Rawlings, S. 2001, ApJ, 562, L5
- Combes et al. (2011) Combes, F., García-Burillo, S., Braine, J., Schinnerer, E., Walter, F., & Colina, L. 2011, A&A, 528, A124+
- Corder et al. (2010) Corder, S. A., Wright, M. C. H., & Carpenter, J. M. 2010, in Presented at the Society of Photo-Optical Instrumentation Engineers (SPIE) Conference, Vol. 7733, Society of Photo-Optical Instrumentation Engineers (SPIE) Conference Series
- Crocker et al. (2011) Crocker, A. F., Bureau, M., Young, L. M., & Combes, F. 2011, MNRAS, 410, 1197
- Daddi et al. (2010) Daddi, E., et al. 2010, ApJ, 713, 686
- Di Matteo et al. (2005) Di Matteo, T., Springel, V., & Hernquist, L. 2005, Nature, 433, 604
- Downes & Solomon (1998) Downes, D., & Solomon, P. M. 1998, ApJ, 507, 615
- Dunne et al. (2000) Dunne, L., Eales, S., Edmunds, M., Ivison, R., Alexander, P., & Clements, D. L. 2000, MNRAS, 315, 115
- Edge (2001) Edge, A. C. 2001, MNRAS, 328, 762
- Edge & Frayer (2003) Edge, A. C., & Frayer, D. T. 2003, ApJ, 594, L13
- Elbaz et al. (2009) Elbaz, D., Jahnke, K., Pantin, E., Le Borgne, D., & Letawe, G. 2009, A&A, 507, 1359
- Elvis et al. (1994) Elvis, M., et al. 1994, ApJS, 95, 1
- Fabian (1994) Fabian, A. C. 1994, ARA&A, 32, 277
- Farrah et al. (2002) Farrah, D., Serjeant, S., Efstathiou, A., Rowan-Robinson, M., & Verma, A. 2002, MNRAS, 335, 1163
- Feain et al. (2007) Feain, I. J., Papadopoulos, P. P., Ekers, R. D., & Middelberg, E. 2007, ApJ, 662, 872
- Floyd et al. (2004) Floyd, D. J. E., Kukula, M. J., Dunlop, J. S., McLure, R. J., Miller, L., Percival, W. J., Baum, S. A., & O’Dea, C. P. 2004, MNRAS, 355, 196
- Greve et al. (2005) Greve, T. R., et al. 2005, MNRAS, 359, 1165
- Hutchings & Neff (1991) Hutchings, J. B., & Neff, S. G. 1991, AJ, 101, 2001
- Klamer et al. (2004) Klamer, I. J., Ekers, R. D., Sadler, E. M., & Hunstead, R. W. 2004, ApJ, 612, L97
- Kovács et al. (2006) Kovács, A., Chapman, S. C., Dowell, C. D., Blain, A. W., Ivison, R. J., Smail, I., & Phillips, T. G. 2006, ApJ, 650, 592
- Kruegel & Siebenmorgen (1994) Kruegel, E., & Siebenmorgen, R. 1994, A&A, 288, 929
- Lacy et al. (1992) Lacy, M., Rawlings, S., & Hill, G. J. 1992, MNRAS, 258, 828
- McLeod & McLeod (2001) McLeod, K. K., & McLeod, B. A. 2001, ApJ, 546, 782
- Michałowski et al. (2010) Michałowski, M. J., Watson, D., & Hjorth, J. 2010, ApJ, 712, 942
- Papadopoulos et al. (2008a) Papadopoulos, P. P., Feain, I. J., Wagg, J., & Wilner, D. J. 2008a, ApJ, 684, 845
- Papadopoulos et al. (2008b) Papadopoulos, P. P., Kovacs, A., Evans, A. S., & Barthel, P. 2008b, A&A, 491, 483
- Papadopoulos et al. (1995) Papadopoulos, P. P., Seaquist, E. R., Wrobel, J. M., & Binette, L. 1995, ApJ, 446, 150
- Papadopoulos et al. (2010) Papadopoulos, P. P., van der Werf, P., Isaak, K., & Xilouris, E. M. 2010, ApJ, 715, 775
- Pizzolato & Soker (2005) Pizzolato, F., & Soker, N. 2005, ApJ, 632, 821
- Polletta et al. (2007) Polletta, M., et al. 2007, ApJ, 663, 81
- Priddey & McMahon (2001) Priddey, R. S., & McMahon, R. G. 2001, MNRAS, 324, L17
- Robinson et al. (2010) Robinson, A., Young, S., Axon, D. J., Kharb, P., & Smith, J. E. 2010, ApJ, 717, L122
- Russell et al. (2010) Russell, H. R., Fabian, A. C., Sanders, J. S., Johnstone, R. M., Blundell, K. M., Brandt, W. N., & Crawford, C. S. 2010, MNRAS, 402, 1561
- Salomé & Combes (2003) Salomé, P., & Combes, F. 2003, A&A, 412, 657
- Sanders & Mirabel (1996) Sanders, D. B., & Mirabel, I. F. 1996, ARA&A, 34, 749
- Sanders et al. (1989) Sanders, D. B., Scoville, N. Z., Zensus, A., Soifer, B. T., Wilson, T. L., Zylka, R., & Steppe, H. 1989, A&A, 213, L5
- Sanders et al. (1988a) Sanders, D. B., Soifer, B. T., Elias, J. H., Madore, B. F., Matthews, K., Neugebauer, G., & Scoville, N. Z. 1988a, ApJ, 325, 74
- Sanders et al. (1988b) Sanders, D. B., Soifer, B. T., Elias, J. H., Neugebauer, G., & Matthews, K. 1988b, ApJ, 328, L35
- Schneider et al. (1992) Schneider, D. P., Bahcall, J. N., Gunn, J. E., & Dressler, A. 1992, AJ, 103, 1047
- Scoville et al. (2003) Scoville, N. Z., Frayer, D. T., Schinnerer, E., & Christopher, M. 2003, ApJ, 585, L105
- Seaquist et al. (2004) Seaquist, E., Yao, L., Dunne, L., & Cameron, H. 2004, MNRAS, 349, 1428
- Solomon et al. (1997) Solomon, P. M., Downes, D., Radford, S. J. E., & Barrett, J. W. 1997, ApJ, 478, 144
- Solomon & Vanden Bout (2005) Solomon, P. M., & Vanden Bout, P. A. 2005, ARA&A, 43, 677
- Spergel et al. (2007) Spergel, D. N., et al. 2007, ApJS, 170, 377
- Springel et al. (2005) Springel, V., et al. 2005, Nature, 435, 629
- Tripp et al. (1998) Tripp, T. M., Lu, L., & Savage, B. D. 1998, ApJ, 508, 200
- Wang et al. (2010) Wang, R., et al. 2010, ApJ, 714, 699
- Wilson et al. (2008) Wilson, C. D., et al. 2008, ApJS, 178, 189
- Young & Scoville (1991) Young, J. S., & Scoville, N. Z. 1991, ARA&A, 29, 581
- Young et al. (2011) Young, L. M., et al. 2011, ArXiv e-prints