Determination of using hadronic event shape
distributions
of data taken with the OPAL detector
The measurement of the strong coupling using hadronic event shape distributions measured with the OPAL detector at center-of-mass energies between 91 and 209 GeV is summarized. For this measurement hadronic event shape distributions are compared to theoretical predictions based on next-to-next-to-leading-calculations (NNLO) and NNLO combined with resummed next-to-leading-logarithm calculations (NLLA). The combined result using NNLO calculations is and the result using NLLO and NLLA calculations is , with both measurements being in agreement with the world average.
1 Introduction
The annihilation of electron-positron pairs to hadronic final states offers a clean environment to study the theory of the strong interaction, Quantum Chromo Dynamics (QCD). In particular hadronic event shape distributions can be used to measure the strong coupling .
During data-taking of the four LEP-experiments only next-to-leading order calculations (NLO) combined with resummed NLLA predictions were available, leading to a theoretical uncertainty in the measurement dominating the overall uncertainty by far. Only recently new theoretical calculations become available , which take additional loop corrections into account, so-called NNLO calculations. For this analysis these NNLO predictions are used to determine using data taken with the OPAL detector at LEP. Also the matched NNLO+NLLA calculations are used. This note gives an overview of the analysis performed by the OPAL collaboration. The complete description with all details can be found at .
1.1 Data Sample, Monte Carlo Sample and Event Selection
We use data taken with the OPAL detector at LEP at center-of-mass energies between 91 and 209 GeV. Data was taken at 13 different energy points with different event statistics. The largest event statistics of several hundred thousand events is available at 91 GeV, due to the large cross-section at the -Resonance. At higher energies only few hundred and at most three thousand events are selected. For clarification we group the result in four different energy intervals with mean energies of 91, 133, 177 and 197 GeV.
For correction of acceptance and resolution effects as well as for the simulation of the transition from partons to hadrons a large sample of Monte Carlo events based on the Pythia, Herwig and Aridane is generated. Pythia is used as the default choice and the other event generators are used to estimate the systematic uncertainty. The validity of the Monte Carlo models is tested with a comparison between the theoretical NNLO calculations and the Monte Carlo predictions at parton level. The difference between the NNLO prediction and the Monte Carlo model is well covered by using the different Monte Carlo as systematic uncertainty.
For the analysis well measured hadronic events are selected. For data taken above the -resonance events with large initial state radiation are removed. Above the -pair threshold the expected contribution from this four-fermion processes are removed.
2 Results
2.1 Fit procedure
To measure the strong coupling event shape observables are built from selected hadronic events together with using the theoretical predictions. These observables are constructed in a way that they show a large sensitivity to the strong coupling . The theoretical prediction is then fitted to the data distribution with being the only free parameter. The following event shape observables are used: Thrust, heavy jet mass, the total and the wide jet broadening, the C-parameter and the two-three transition parameter using the Durham jet algorithm. The fit range is determined by requiring the corrections to be small as well as the theoretical predictions to be stable within the fit range. To compare this analysis with the previous analysis the data is also fitted to next-to-leading (NLO) and NLO combined with resummed NLLA calculations. The result from the previous analysis can be reproduced.
To asses the systematic uncertainty the fit is repeated in slightly different ways. Besides the uncertainty due to the correction for hadronization effects, as described in 1.1, uncertainties due to the experimental technique and uncertainties due to the incomplete power series of the theoretical prediction are evaluated. The overall uncertainty is completed by the statistical uncertainty originating from the finite statistics used in the analysis. The main motivation for the re-analysis of the data is the availability of improved theoretical calculations. In the past this uncertainty related to the theoretical prediction dominated the overall uncertainty. However, even with the new improved theoretical predictions the overall uncertainty is still dominated by the theoretical uncertainty. The statistical uncertainty, the experimental uncertainty and the hadronization uncertainty are similar, while the theoretical uncertainty is at least twice as large.
2.2 Combination of results
A single value of the strong coupling is measured for each event shape observable and for each energy interval separately. In order to obtain a single value for each event shape observable or at each energy interval the values of are combined. The correlation between the different event shape observables and the different energy intervals are taken into account.
The combined result for each event shape observable is shown in Fig. 1. It can be clearly seen that the scatter of the -values obtained with different event shape observables using NNLO predictions is smaller compared to the measurement using NLO predictions only. In addition it can be observed, that the overall uncertainty is reduced with including higher order predictions in the measurement. The increase of the uncertainty between NNLO and matched NNLO+NLLA calculations can be explained by the fact that the NNLO renormalization scale variation is compensated in two loops, while the NLLA renormalization scale variation compensation is only in one loop.
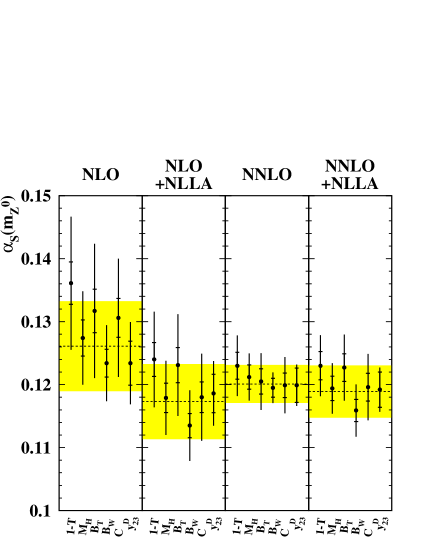
The final result combining all event shape observables at all energy intervals is using NNLO calculations only and using combined NNLO+NLLA predictions.
2.3 Renormalization scale dependence and running of
The dependence of the result on the choice of the renormalization scale is studied. The fixed-order predictions return for the fit the smallest -values at a very small renormalization scales, while using the matched NNLO+NLLA predictions smaller -values for larger renormalization scales are returned.
Together with the re-analyzed JADE result this analysis confirms the running of the strong coupling with center-of-mass energy, as predicted by QCD.
3 Summary
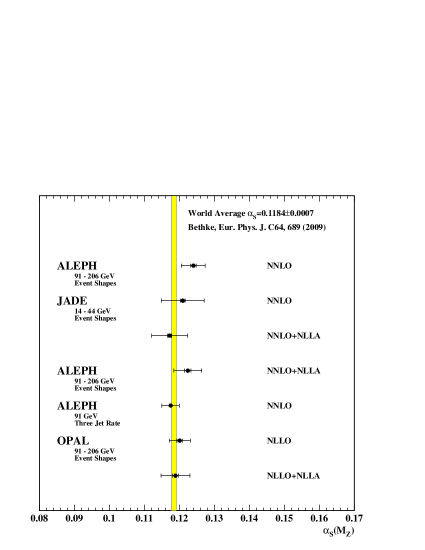
The availability of NNLO predictions for the annihilation of an electron-positron-pair into a pair of quarks lead to a re-analysis of data taken with the OPAL detector. The combined value obtained for the strong coupling using NNLO+NLLA calculations results to , with the overall uncertainty being dominated by missing higher order terms in the theoretical prediction. The result is consistent with the world average . The result obtained can be compared to similar analyses using NNLO- and NNLO-calculations matched with NLLA . A summary of these results is shown in Fig. 2. As seen in this analysis the results obtained using NNLO+NLLA predictions lead to smaller -value compared to a pure NNLO fit. The smallest overall uncertainty is obtained with a fit to the three-jet rate.
Several ways to measure the strong coupling using -data do exist. The value obtained using -decays or applying a fit to electroweak precision observables result in a smaller overall uncertainty compared to this measurement . Besides a precise determination of a fundamental parameter of the Standard Model this measurement can be seen as a consistency check of the theory of strong interactions, Quantum Chromo Dynamics.
Acknowledgments
This research was supported by the DFG cluster of excellence ’Origin and Structure of the Universe’.
References
References
- [1] A. Gehrmann-De Ridder, T. Gehrmann, E.W.N. Glover, G. Heinrich, JHEP 12, 094 (2007).
- [2] S. Weinzierl, Phys. Rev. Lett. 101, 162001 (2008).
- [3] The OPAL Collaboration, hep-ex 1101.147v1, submitted to Eur. Phys. J. C.
- [4] S. Bethke et al., Eur. Phys. Jour. C 64, 351 (2009).
- [5] G. Dissertori it et al., JHEP 02, 040 (2008).
- [6] G. Dissertori it et al., JHEP 08, 036 (2009).
- [7] G. Dissertori it et al., Phys. Rev. Lett. 104, 072002 (2010).
- [8] S. Bethke, Eur. Phys. Jour. C 64, 689 (2009).