Searching for new hypercompact HII regions
Abstract
Hypercompact (HC) HII regions are, by nature, very young HII regions, associated with the earliest stages of massive star formation. They may represent the transition phase as an early B-type star grows into an O-type star. Unfortunately, so few HC HII regions are presently known that their general attributes and defining characteristics are based on small number statistics. A larger sample is needed for detailed studies and good statistics. Class II methanol masers are one of the best indicators of the early stages of massive star formation. Using the Arecibo Methanol Maser Galactic Plane Survey — the most sensitive blind survey for 6.7 GHz methanol masers to date — we selected 24 HC HII region candidates. We made EVLA continuum observations at 3.6 and 1.3 cm to search for HC HII regions associated with these masers. We identified six potential HC HII regions in our sample based on the presence of optically thick free-free emission. Overall, we find that 30% of the methanol masers have an associated centimeter radio continuum source (separation less than 0.1 pc), which is in general agreement with previous studies.
1 Introduction
Massive stars are key to understanding many physical phenomena in the Galaxy; nevertheless, their formation process is still poorly understood. A prime manifestation of recent massive star formation is the presence of an HII region surrounding the young massive star(s). The range of sizes and densities of these HII regions reflects both the original conditions of the star-forming environment and the later evolution of the ionized regions. The smallest ( pc) and densest ( cm-3) HII regions, the so-called hypercompact (HC) HII regions (e. g., Kurtz 2005), are associated with the earliest stages of evolution. HC HII regions are particularly interesting in the study of massive star formation because they are so small that we can assume they harbor only a single star (or a binary system), in contrast to ultracompact (UC) or compact HII regions (with sizes pc) which usually harbor clusters of massive stars (e. g., Kurtz 2000; Hoare et al. 2006). Additionally, recent work (Keto 2007) suggests that O stars form gradually via accretion through an HC HII region onto intermediate mass B stars. Thus, the study of HC HII regions is important to understand the formation of massive stars. However, only a handful of HC HII regions are known, and a larger sample is needed for detailed studies with good statistics to determine the properties of this very early stage of massive star formation.
The – line of methanol at 6.7 GHz is the strongest of the class II methanol masers. Theoretical and observational studies strongly suggest that this maser line traces very early stages of massive star formation — often prior to the formation of an UC HII region (e. g., Minier et al. 2001; Cragg et al. 2005; Ellingsen 2006; Schnee & Carpenter 2009). Unlike water, OH or class I methanol masers, that have also been found toward low-mass star forming regions, class II methanol masers seem to be unique to massive young stellar objects (YSOs). Thus, class II methanol masers are excellent candidates to search for HC HII regions.
The Arecibo Methanol Maser Galactic Plane Survey (AMGPS; Pandian et al. 2007) is the most sensitive blind survey for 6.7 GHz methanol masers carried out to date. By using the 305 m Arecibo radio telescope, the AMGPS covered an area of 18.2 deg2 between Galactic longitudes of 35° and 54°, detecting a total of 86 sources. Thus, this catalog is an excellent starting point to look for new HC HII region candidates.
2 Selection of Targets
HC HII regions have small sizes ( pc), high densities ( cm-3), high emission measures ( pc cm-6), steep spectral indices (), and broad ( km s-1) radio recombination lines (e. g., Gaume et al. 1995; Kurtz 2000; Sewilo et al. 2004). The turnover frequency, separating the optically thin () and thick () regimes is usually between 20 and 40 GHz for HC HII regions (substantially higher than the typical 5 GHz for UC HII regions). Hence, HC HII regions are faint at wavelengths longer than 6 cm, but their intensities increase at shorter wavelengths. In order to select those AMGPS sources with the highest probability of harboring an HC HII region, we developed the following selection criteria: i) no 6 cm / 20 cm counterparts, we searched the NRAO VLA Sky Survey (NVSS, Condon et al. 1998), and the MAGPIS and CORNISH surveys (Helfand et al. 2006; Purcell et al. 2008) for emission at 20 and 6 cm toward all the AMGPS methanol maser sources. By rejecting sources with 20 or 6 cm emission we eliminate star-forming regions with more-developed, lower-density HII regions, detectable at longer wavelengths; and ii) mid-IR emission, we searched the MSX (Price et al. 2001) and MIPSGAL (Carey et al. 2009) catalogs for emission at mid-infrared wavelengths toward those sources with no 20 cm/6 cm emission. Essentially all sources show emission in the MIPSGAL 24 m band (in some cases with pixels blanked due to saturation), but only half of the sources were detected by MSX. This is primarly because of the significantly better sensitivity of Spitzer compared to MSX. However, MSX detections suggest the presence of a relatively warm young stellar object, which may be more likely to host a young HII region. We hence rejected sources that have no MSX detection. Thus all our targets exceed the MSX detection limit of 0.3 Jy at 8 m.
Of the 86 methanol masers in the AMGPS catalog, 24 fulfill these selection criteria. The peak flux densities of the selected masers range from 0.27 Jy to 17 Jy, and their luminosities (taken from Pandian et al. 2009) range from to , covering the full range of flux densities and luminosities reported in the AMGPS catalog. Thus, we can test for correlations between the maser properties and the presence of HC HII regions.
3 Observations and Data Reduction
Our sample was observed with the EVLA (see Perley et al. 2011) of the NRAO111The Expanded Very Large Array (EVLA) is operated by the National Radio Astronomy Observatory (NRAO), a facility of the National Science Foundation operated under cooperative agreement by Associated Universities, Inc. in the continuum at 3.6 cm and 1.3 cm. The observations were made during the shared-risk phase in 2010 April and June; the array was in the D configuration. Owing to missing scans during the shared-risk observing not all sources were observed at both frequencies: 19 regions were observed at 3.6 cm, and the entire sample (24 regions) at 1.3 cm. The new Wide-band Interferometric Digital Architecture (WIDAR) correlator provided continuum observations of 128 MHz bandwidth with two polarizations, resulting in an effective bandwidth of 256 MHz. On-source integration times were about 6 minutes at 3.6 cm and 10 minutes at 1.3 cm. Flux and bandpass calibration were performed by observing the quasar 3C48, with an adopted flux density of 3.15 Jy at 3.6 cm and 1.12 Jy at 1.3 cm. Amplitude and phase calibrations were achieved by monitoring the quasars J18510035 and J19221530, resulting in an rms phase of 5° and 50° at 3.6 cm and 1.3 cm, respectively. Data were calibrated using the CASA package, following the standard guidelines for continuum reduction. The calibrated uv-data sets were exported in FITS format, and imaged using the NRAO package AIPS. Images were made using a variety of weightings, and tapering the 1.3 cm uv-data to improve the sensitivity to low-surface-brightness objects. Typical synthesized beams were ″ and ″ at 3.6 cm and 1.3 cm, respectively, with rms noise levels of and .
4 Results: centimeter continuum sources
Radio continuum emission is seen in all the regions. At 3.6 cm we detect continuum sources in all 19 observed fields, while at 1.3 cm we detect continuum emission in 10 out of 24 fields. A total of 49 radio continuum sources were identified in the 24 fields of our sample (2 out of 49 sources were detected at 1.3 cm in fields that were not observed at 3.6 cm). However, not all the sources are found close to the methanol maser emission. A complete analysis of all the sources (including those located far from the maser emission) with a multi-wavelength (infrared, submillimeter and centimeter) analysis will be presented in a forthcoming paper.
In this Letter, we focus our attention on the centimeter continuum sources close to the methanol maser emission. In particular, we study the sources detected within the 1.3 cm primary beam (′), which is centered (in most cases) at the coordinates of the methanol masers reported by Pandian et al. (2011). Within the 1.3 cm primary beam, 11 of the 24 fields show radio continuum emission. Thus, the detection rate of centimeter continuum sources close to the maser emission (′) is around 46%. A total of 14 sources were detected in these 11 fields.
Table 1 lists the 24 regions observed in this study. For regions with a source within the 1.3 cm primary beam we list the position of peak emission (derived from the 3.6 cm image), and the primary beam corrected flux densities at 3.6 and 1.3 cm. An upper limit of 4 times the rms noise of the map is listed if there is no detection within the 1.3 cm primary beam. We also list the properties of the 6.7 GHz methanol masers (peak flux density and luminosity) from Pandian et al. (2007, 2009), as well as the angular and spatial offset between the centimeter continuum sources and the maser spots.
The centimeter continuum emission found close to the masers is typically compact with respect to our synthesized beams of 6″–9″, except for two sources in G38.260.20 and G48.990.30, for which we found extended structures that are offset from the maser positions and are partially resolved out at 1.3 cm. The maximum angular scale that can be recovered by our observations is ″ and ″ at 3.6 and 1.3 cm, respectively. However, the snapshot nature of the observations make it difficult to properly image large structures. To obtain more accurate estimates of the spectral indices for the compact sources (see Table 1) we re-imaged these fields at 3.6 and 1.3 cm using the uv–range 3–28 k. Flux densities from this restricted uv–range were used to calculate the spectral indices reported in Table 1.
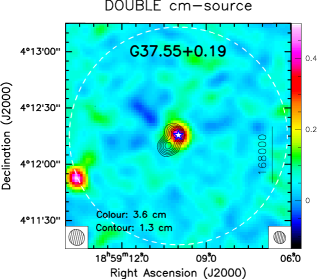
Most of the compact sources show positive spectral indices (), indicative of partially optically thick emission typical of HC HII regions and thermal radiojets (e. g., Kurtz 2005; Rodríguez et al. 2005). A few sources have spectral indices between and , possibly tracing optically thin emission from weak and compact HII regions (e. g., Sánchez-Monge et al. 2008), or non-thermal emission as found toward other massive young stellar objects (e. g., Zapata et al. 2006). Two sources in our sample were detected only at 1.3 cm: the south-eastern source in G37.55+0.19 (see Figure 1) and the source in G53.14+0.07. Adopting a 4 detection limit at 3.6 cm, we can place a lower limit on the spectral index of these sources. The former has while the latter has . These large values for the spectral index indicate that the turnover frequency (from optically thick to optically thin emission) is greater than 22 GHz, which implies a lower limit to the emission measure of pc cm-6. These two sources are excellent candidates for HC HII regions. Several of the regions we observed were previously studied with the VLA at the higher angular resolution of ″ (Pandian et al. 2010). Our results are similar to those of Pandian et al. (2010), although we typically recover more flux in our D-configuration observations.
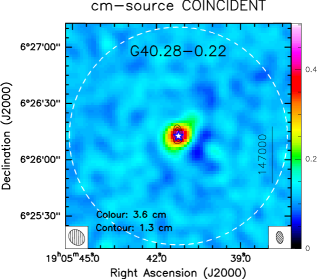
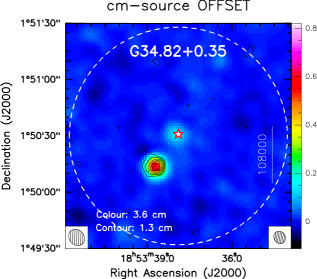
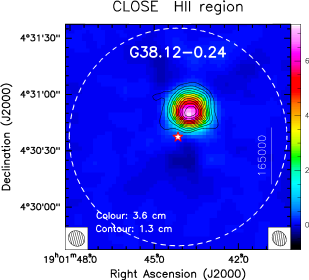
To describe the morphology and spatial distribution of the emission with respect to the masers, we classify the sources into three main groups: a) compact sources spatially associated with the methanol maser (7/14, 50%), b) compact sources offset from the maser (2/14, 14%), and c) larger (in some cases, clearly extended) sources found offset from the maser emission, likely tracing more evolved UC HII regions (5/14, 36%). In Figure 1 we show an example of each group.
5 Discussion
Of the 14 sources detected within the 1.3 cm primary beam (see Section 3 and Table 1), seven are found to be coincident (spatial offset pc) with a methanol maser. Considering the entire sample of 24 distinct maser sources, 29% of the methanol masers are associated with radio continuum emission with a flux density mJy. This is consistent with previous work: 10% of the AMGPS masers has 20 cm NVSS counterparts (Pandian et al. 2007b), 33% of the Torun blind survey (Szymczak et al. 2002) shows associated 6 cm emission, and 30% of the AMGPS sub-sample studied by Pandian et al. (2010) was found to have associated centimeter continuum emission.
It is interesting to note that the sources associated with maser emission are compact and all but one have spectral indices between and with an average value of , indicating the presence of partially optically thick emission. In contrast, centimeter continuum sources found offset ( pc) from the maser position are generally morphologically more extended and have optically thin emission (see Table 1). This is consistent with 6.7 GHz methanol masers tracing very early phases of massive star formation. We do not see any clear correlation between the properties of the centimeter continuum emission and those of the maser emission (peak flux density or luminosity). However, we caution that our sample is small; a more extensive survey might show some correlation between the continuum and maser emission.
We determined the physical parameters of the centimeter continuum sources assuming they are (homogeneous) HII regions. For those sources with optically thin emission (G38.120.24, G38.920.36, and G42.700.15) we derive an emission measure of – cm-6 pc, characteristic of UC HII regions (e. g., Wood & Churchwell 1989), and an ionizing photon flux of s-1 (indicating ionization from B0 or B0.5 stars, Panagia 1973). For sources with optically thick emission, we performed a similar analysis to that done by Pandian et al. (2010). Using the Altenhoff et al. (1960) approximation, the free-free optical depth can be related to the emission measure, , as
| (1) |
here we assume an electron temperature of K. Given that the spectral index is , and considering homogeneous HII regions, the emission measure should be cm-6 pc (with the limiting case when at a frequency of 22.46 GHz). In the optically thick regime, we can relate the flux density and the solid angle of the source, , as
| (2) |
with ) the black body function. The sizes derived for our compact sources range between 1 and 10 mpc. Thus, the centimeter sources we find associated with class II methanol masers have optical depths and emission measures typical of HC HII regions. Higher resolution observations are needed to determine if they also have typical HC HII region sizes.
In summary, we have identified a number of promising candidates for HC HII regions associated with class II methanol masers. Further observations at higher angular resolution are needed to study the properties and fully characterize these regions.
References
- (1)
- (2) Altenhoff, W., Mezger, P. G., Wendker, H., & Westerhout, F. 1960, Veröffentlichungen Universitäts-Sternwarte Bonn, 59, 48
- (3)
- (4) Carey, S. J., et al. 2009, PASP121, 76
- (5)
- (6) Condon, J. J., Cotton, W. D., Greisen, E. W., Yin, Q. F., Perley, R. A., Taylor, G. B., & Broderick, J. J. 1998, AJ, 115, 1693
- (7)
- (8) Cragg, D. M., Sobolev, A. M. & Godfrey, P. D. 2005, MNRAS, 360, 533
- (9)
- (10) Ellingsen, S. P. 2006, ApJ, 638, 241
- (11)
- (12) Gaume, R. A., Goss, W. M., Dickel, H. R., Wilson, T. L. & Johnston, K. J. 1995, ApJ, 438, 776
- (13)
- (14) Helfand, D. A., Becker, R. H., White, R. L., Fallon, A. & Tuttle, S. 2006, AJ, 131, 2525
- (15)
- (16) Hoare, M. G., Kurtz, S. E., Lizano, S., Keto, E., & Hofner, P. 2007, Protostars and Planets V, 181
- (17)
- (18) Keto, E. 2007, ApJ, 666, 976
- (19)
- (20) Kurtz, S. E. 2000, Revista Mexicana de Astronomia y Astrofisica Conference Series, 9, 169
- (21)
- (22) Kurtz, S. 2005, Massive Star Birth: A Crossroads of Astrophysics, 227, 111
- (23)
- (24) Minier, V., Conway, J. E., & Booth, R. S. 2001, A&A, 369, 278
- (25)
- (26) Panagia, N. 1973, AJ, 78, 929
- (27)
- (28) Pandian, J. D., Goldsmith, P. F., & Deshpande, A. A. 2007a, ApJ, 656, 255
- (29)
- (30) Pandian, J. D., & Goldsmith, P. F. 2007b, ApJ, 669, 435
- (31)
- (32) Pandian, J. D., Menten, K. M., & Goldsmith, P. F. 2009, ApJ, 706, 1609
- (33)
- (34) Pandian, J. D., Momjian, E., Xu, Y., Menten, K. M., & Goldsmith, P. F. 2010, A&A, 522, A8
- (35)
- (36) Pandian, J. D., Momjian, E., Xu, Y., Menten, K. M., & Goldsmith, P. F. 2011, ApJ, 730, 55
- (37)
- (38) Perley, R. A., Chandler, C. J., Butler, B. J., & Wrobel, J. M. 2011, ApJ, in press
- (39)
- (40) Price, S. D., Egan, M. P., Carey, S. J., Mizuno, D. R., & Kuchar, T. A., AJ, 121, 2819
- (41)
- (42) Purcell, C. R., Hoare, M. G. & Diamond, P. 2008, ASPC, 387, 389
- (43)
- (44) Rodríguez, L. F., Garay, G., Brooks, K. J., & Mardones, D. 2005, ApJ, 626, 953
- (45)
- (46) Sánchez-Monge, Á., Palau, A., Estalella, R., Beltrán, M. T., & Girart, J. M. 2008, A&A, 485, 497
- (47)
- (48) Schnee, S. & Carpenter, J. M. 2009, ApJ, 698, 1456
- (49)
- (50) Sewilo, M., Churchwell, E., Kurtz, S., Goss, W. M. & Hofner, P. 2004, ApJ, 605, 285
- (51)
- (52) Szymczak, M., Kus, A. J., Hrynek, G., Kěpa, A., & Pazderski, E. 2002, A&A, 392, 277
- (53)
- (54) Wood, D. O. S., & Churchwell, E. 1989, ApJS, 69, 831
- (55)
- (56) Zapata, L. A., Rodríguez, L. F., Ho, P. T. P., Beuther, H., & Zhang, Q. 2006, AJ, 131, 939
- (57)
| centimeter continuuma | 6.7 GHz methanol maserb | ||||||||||
| c | c | Spectral | f | f | |||||||
| Region | ( ) | ( ) | (mJy) | (mJy) | Indexd | Notese | (arcsec) | (pc) | (Jy) | () | |
| G34.820.35 | 18 53 37.96 | 01 50 30.4 | compact | 1.1 | 0.02 | 0.24 | |||||
| 18 53 38.69 | 01 50 13.6 | compact | 21.0 | 0.37 | 0.24 | ||||||
| G36.700.09 | … | … | 7.00 | ||||||||
| G37.550.19 | 18 59 10.09 | 04 12 17.5 | compact | 2.8 | 0.07 | 5.27 | |||||
| 18 59 10.34 | 04 12 09.9 | compact | 7.4 | 0.20 | 5.27 | ||||||
| G37.600.42 | … | … | 17.30 | ||||||||
| G38.030.30 | … | … | 11.71 | ||||||||
| G38.080.27 | … | … | 0.59 | ||||||||
| G38.120.24 | 19 01 43.73 | 04 30 51.1 | large | 15.1 | 0.40 | 1.92 | |||||
| G38.260.08 | … | … | 7.03 | ||||||||
| G38.260.20 | 19 01 54.4 | 04 39 26. | …g | extended | 51.3 | 2.24 | 0.72 | ||||
| G38.920.36 | 19 03 40.10 | 05 10 14.4 | large | 38.5 | 1.96 | 1.26 | |||||
| G40.280.22 | 19 05 41.20 | 06 26 13.0 | compact | 0.4 | 0.01 | 24.47 | |||||
| G41.120.11 | … | … | 1.14 | ||||||||
| G41.160.20 | … | … | 0.27 | ||||||||
| G41.270.37 | … | … | 0.26 | ||||||||
| G42.030.19 | … | … | 26.32 | ||||||||
| G42.300.30 | … | … | 6.33 | ||||||||
| G42.700.15 | 19 09 55.16 | 08 36 53.5 | compact | 1.4 | 0.10 | 3.25 | |||||
| G45.810.36 | … | … | 11.31 | ||||||||
| G48.990.30 | 19 22 26.06 | 14 06 39.1 | compact | 1.3 | 0.03 | 0.58 | |||||
| 19 22 25.5 | 14 06 17. | …g | extended | 24.6 | 0.64 | 0.58 | |||||
| G49.410.33 | 19 20 59.83 | 14 46 49.9 | large | 9.0 | 0.53 | 9.25 | |||||
| G50.780.15 | … | … | 5.26 | ||||||||
| G52.920.41 | … | … | 6.64 | ||||||||
| G53.040.11 | 19 28 55.53 | 17 52 04.7 | compact | 1.7 | 0.08 | 1.66 | |||||
| G53.140.07 | 19 29 17.68 | 17 56 19.2 | compact | 4.3 | 0.04 | 1.02 | |||||
-
a
Results for the 3.6 cm and 1.3 cm continuum emission located within the 1.3 cm primary beam (′). The pointing centers of the observations correspond (in most cases) to the methanol maser positions given by Pandian et al. (2011). Regions G42.030.19, G42.300.30, G49.410.33, G50.780.15, and G52.920.11 were not observed at 3.6 cm because of missing scans during the shared-risk observations.
-
b
Properties of the class II methanol masers. Peak flux density and luminosity of the maser components from Pandian et al. (2007, 2009).
-
c
Primary beam corrected. Uncertainties in flux density were calculated assuming an uncertainty of 5% and 25% in the flux scale determination at 3.6 cm and 1.3 cm, respectively. In case of non-detection, an upper limit of 4 times the rms noise of the map is listed.
-
d
Spectral index (: ) estimated from the flux densities at 3.6 cm and 1.3 cm, obtained with the uv–range common to both wavelengths, 3–28 k.
-
e
Notes on the morphology of the centimeter emission, indicating if it is compact (or unresolved), double, large (less compact and with some structure) or extended.
-
f
Angular (in arcsec) and spatial (in pc) offsets between the radio continuum source with the coordinates indicated in this Table, and the position of the methanol maser (Pandian et al. 2011). The distance used to determine the spatial offset is reported in Pandian et al. (2009).
-
g
The source is filtered out at 1.3 cm, resulting in an unreliable spectral index determination.
 |
 |
|
 |
 |