Hierarchical Fragmentation and Jet-like Outflows in IRDC G28.34+0.06, a Growing Massive Protostar Cluster
Abstract
We present Submillimeter Array (SMA) mm observations of an infrared dark cloud G28.34+0.06. Located in the quiescent southern part of the G28.34 cloud, the region of interest is a massive ( ) molecular clump P1 with a luminosity of , where our previous SMA observations at 1.3 mm have revealed a string of five dust cores of 22–64 along the 1 pc IR-dark filament. The cores are well aligned at a position angle of 48∘ and regularly spaced at an average projected separation of 0.16 pc. The new high-resolution, high-sensitivity 0.88 mm image further resolves the five cores into ten compact condensations of 1.4–10.6 , with sizes a few thousands AU. The spatial structure at clump ( pc) and core ( pc) scales indicates a hierarchical fragmentation. While the clump fragmentation is consistent with a cylindrical collapse, the observed fragment masses are much larger than the expected thermal Jeans masses. All the cores are driving CO (3–2) outflows up to 38 km s-1, majority of which are bipolar, jet-like outflows. The moderate luminosity of the P1 clump sets a limit on the mass of protostars of 3–7 . Because of the large reservoir of dense molecular gas in the immediate medium and ongoing accretion as evident by the jet-like outflows, we speculate that P1 will grow and eventually form a massive star cluster. This study provides a first glimpse of massive, clustered star formation that currently undergoes through an intermediate-mass stage.
1 Introduction
Stars are born in dense molecular clouds through gravitational collapse. A classic picture of low-mass star formation has been described in Shu et al. (1987). During the collapse, a parsec-scale molecular clump fragments into gaseous cores that subsequently collapse and fragment to condensations which eventually form individual or a group of stars. After the formation of an accretion disk, a bipolar wind develops to shed angular momentum in the disk so that circumstellar matter can accrete onto the protostar. Interactions between such a wind and the ambient molecular cloud may produce highly collimated molecular outflows (or “molecular jets”) at parsec scales (Shang et al., 2006, 2007).
Massive protostars are often found embedded in massive molecular clumps of (Plume et al., 1997; Molinari et al., 2000; Beuther et al., 2002b; Beltrán et al., 2006). Their presence is marked by high luminosity ( ), copious spectra from organic molecules (Blake et al., 1987; Schilke et al., 1997), active accretion (Zhang, 2005; Cesaroni et al., 2006), and strong molecular outflows (Zhang et al., 2001, 2005; Beuther et al., 2002c). However, the stage prior to the high mass protostellar phase is not clear. Do massive protostars evolve through a low to intermediate-mass stage? How does accretion proceed? Do cores harboring massive young stellar objects collect all the mass before the formation of a protostar? These questions can potentially be addressed by studying massive infrared dark clouds (IRDCs).
IRDCs are dense ( ) and cold ( K) molecular clouds that absorb Galactic background mid-infrared emission while emit at longer wavelengths ( 100 m). Because of their extreme properties, IRDCs are ideal laboratories to study the early stages of star formation, and thus have been subjected to intense studies since their identification in mid-1990s by the Infrared Space Observatory (ISO) and the Midcourse Space Experiment (MSX; Perault et al., 1996; Egan et al., 1998; Hennebelle et al., 2001). Comprehensive catalogs have been established based on Galactic IR surveys from the MSX (Simon et al., 2006a, b) and Spitzer (Peretto & Fuller, 2010), revealing more than 10,000 IRDCs. Among them, the ones with masses of and luminosities are candidates of massive star formation at a stage prior to the high mass protostellar phase.
G28.34+0.06 (hereafter G28.34), one of the first recognized and well studied IRDCs (Carey et al., 1998, 2000), appears to be a candidate to form massive stars. The giant cloud, at a distance of 4.8 kpc, contains several of dense gas traced by 1 mm dust emission along the IR-dark filaments extending 6 pc (Carey et al., 2000; Simon et al., 2006b; Rathborne et al., 2006; Pillai et al., 2006; Wang et al., 2008; Zhang et al., 2009). Two prominent dust clumps, P1 and P2, are revealed from dust continuum images obtained from single dish telescopes (Carey et al., 2000; Rathborne et al., 2006). Large amount of dense gas ( within pc) makes P1 and P2 potential sites of protostellar cluster formation. Zhang et al. (2009) observed P1 and P2 with the SMA at 230 GHz band. They found that, despite similar amount of dense gas contained in the two clumps, P1 and P2 show very different stages of evolution. At a resolution, the northern clump P2 fragments to two compact cores with masses 49 and 97 , respectively. The cores emit rich organic molecular line emissions analogous to that observed in hot cores. The southern clump P1, on the other hand, fragments to a string of five cores regularly spaced along the IR-dark ridge, with masses of 22–64 . In contrast to the cores in P2, the P1 cores show no molecular line emission except faint CO(2–1) across the entire 4 GHz SMA band. This implies a significant CO depletion at a scale over 0.07 pc in the P1 cores. In addition, an enhancement of deuterium fractionation was also found toward P1 (Chen et al., 2010). All these properties point P1 to a quiescent stage much earlier than P2. However, strong H2O maser (Wang et al., 2006) and enhanced 4.5 m emission (“green fuzzy”; Chambers et al., 2009), as well as a faint 24 m source in P1 suggest that star formation may be ongoing.
Here we report our new SMA observations of G28.34-P1 at the 345 GHz band. The high angular resolution, high sensitivity observations reveal hierarchical structures and multiple jet-like outflows, which suggest that intense star formation is already ongoing in this region.
2 Observations and Data Reduction
We observed the molecular clump P1 in IRDC G28.34+0.06 with the Submillimeter Array 111The Submillimeter Array is a joint project between the Smithsonian Astrophysical Observatory and the Academia Sinica Institute of Astronomy and Astrophysics and is funded by the Smithsonian Institution and the Academia Sinica. (SMA; Ho et al., 2004) at the 345 GHz band from 2009 April 26 through 2009 September 23. During six observing runs, the SMA antennas were in three different array configurations: compact (COM), extended (EXT), and subcompact (SUB), each was used to observe for two nights for this project. Table 1 summarizes the observations.
For all the observations, we used a common phase center
(R.A., decl.)
.
Quasars J1751+096 and J1830+063 were observed approximately every 20 minutes to monitor time dependent antenna gains.
The receivers were tuned to a local oscillate frequency of 341.6 GHz,
with a uniform spectral resolution of 0.812 MHz (or 0.7 km s-1) across the entire band.
The system temperature varies from 120 to 500 K during the six tracks.
The full-width-half-maximum (FWHM) primary beam is about 34′′.
For the COM observations, we used quasar 3C273 for frequency dependent bandpass calibration. Absolute flux was obtained by comparing the observed correlator counts with modeled fluxes of dwarf planet Ceres. With an IF of 4–6 GHz, the lower sideband (LSB) covered rest frequencies from 335.7 through 337.7 GHz and the upper sideband (USB) covered 345.6–347.6 GHz.
For the EXT observations, 3C454.3 was used for bandpass calibration, while young star MWC349 or planet Uranus was observed for flux calibration. The observations made use of the newly upgraded capability that doubled the original IF bandwidth to 4 GHz in each sideband, covering rest frequencies 333.7–337.7 GHz in the LSB and 345.6–349.6 GHz in the USB.
For the SUB observations, bandpass was calibrated by observing 3C454.3 and flux was scaled by observing Jovial satellites Callisto and Ganymede. The frequency coverage was the same as the EXT observations.
The visibility data were calibrated using MIR IDL software package.222http://www.cfa.harvard.edu/$∼$cqi/mircook.html Calibrated visibility data were then exported to MIRIAD333http://www.cfa.harvard.edu/sma/miriad for further processing and imaging. CASA444http://casa.nrao.edu was also used for part of the image processing.
Data from different observing runs were calibrated separately, and then combined in the visibility domain for analysis. Continuum emission was generated by averaging line free channels in the visibility domain. In this study, if not otherwise stated, we use the EXT data for continuum analysis and the combined SUB and COM data for spectral analysis. With natural weighting, the synthesized beam is , with for the continuum image; while for the spectral line, the beam is , . The rms noise is about 0.8 mJy in the continuum, and about 100 mJy (0.2 K) per 1 km s-1 in the spectra. If we use the SUB data only, the beam becomes larger and we obtain a rms of 0.1 K at the same spectral resolution. Empirically, the absolute flux is accurate to about 15%. The uncertainty in the absolute position is , obtained by comparing the fitted position of the secondary gain calibrator and its catalog position.
3 Results and Discussion
3.1 Continuum data and fragmentation
3.1.1 Hierarchical fragmentation
There are different definitions of clump, core, and condensation in the literature when describing the spatial structure of dust continuum or molecular line emission. In the following discussion, we refer a clump as a structure with a size of pc, a core as a structure with a size of pc, and a condensation as a substructure of pc within a core. A clump is capable of forming a cluster of stars, a core may form one or a small group of stars, and a condensation can typically form a single star or a multiple-star system. This nomenclature is consistent with the one adopted by Zhang et al. (2009).
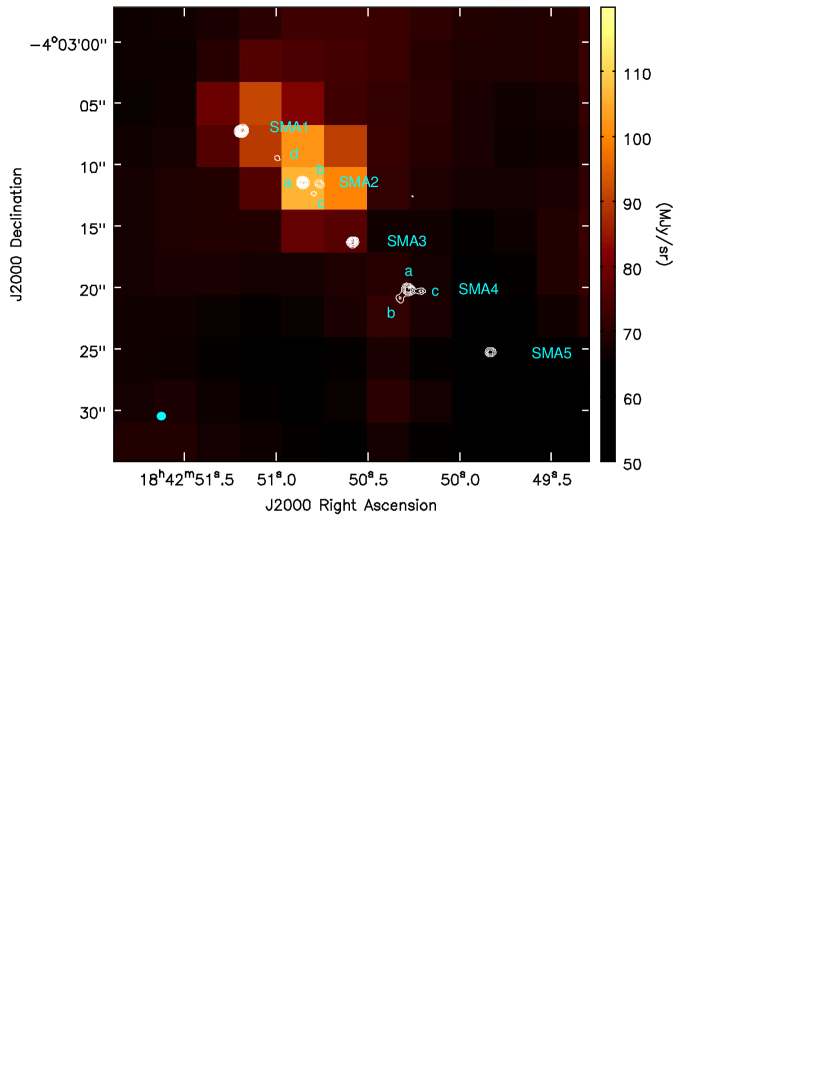
Figure 1 presents the 0.88 mm continuum emission. The resolution image resolves the clump into five groups of compact condensations, corresponding to the five dust cores discovered at 1.3 mm, namely SMA1, SMA2, SMA3, SMA4, and SMA5 (Zhang et al., 2009). Cores SMA1, SMA3, and SMA5 consist of one condensation. Cores SMA2 and SMA4 consist of three condensations, with one dominating over the other two in peak flux. In addition, a faint condensation is also revealed northeast to core SMA2. We tentatively assign this condensation to the SMA2 group. We name all the 10 condensations accordingly and label them on Fig. 1. Refining the core positions using the positions of the dominant condensations, the five cores are spaced by an projected distance of pc (), and are well aligned at a position angle (PA, east of north) of 48∘. In cores SMA2 and SMA4, the three condensations are spaced by pc ().
We estimate the mass of each condensation. Assuming optically thin dust emission, the dust mass can be estimated following
where is the dust mass, is the continuum flux at frequency , is the source distance, is the Planck function at dust temperature , and cm2 g-1 is the dust opacity (Hildebrand, 1983). We adopt the dust temperatures from Zhang et al. (2009), i.e., 16 K for SMA2 and 13 K for other cores. The dust opacity at millimeter/sub-millimeter wavelengths is uncertain. For dust in the interstellar medium, (Draine & Lee, 1984). Rathborne et al. (2010) derived for the entire P1 clump based on a global spectral energy distribution. We generated a dust opacity map by comparing the continuum image at 345 GHz and 230 GHz, and found to vary from 1.3 to 2.5 across the map. Given the uncertainties, we adopt for all the cores similar to Zhang et al. (2009), and discuss the effect of different on the mass estimates.
Table 2 lists coordinates, size, peak flux, integrated flux, and estimated mass of all the 10 condensations. These parameters are determined by fitting a two dimensional Gaussian function to the observed flux distribution. Fluxes are then corrected for primary beam attenuation. The masses of the condensations range from 1.4 to 10.6 with an average of 4.8 . The mean size is , or after deconvolved with the synthesized beam. The deconvolved size corresponds to about AU at the source distance. The uncertainty in the mass estimation arises from several factors. First, the flux calibration contributes 15 % in uncertainty. Second, the uncertainty of contributes in a form of . Third, the spatial filtering effect of radio interferometry preferentially picks up the compact structures and filters out the extended emission. Comparing images made from different array configurations, the EXT image recovered 20 %–30 % fluxes of what covered by COM and SUB images. This filtering effect explains why the masses reported in Table 2 are consistently lower than those in Zhang et al. (2009). The EXT image at 345 GHz represents the high contrast structure in these cores — the small, compact condensations tracing the immediate surroundings of the protostars.
Our observations reveal fragmentation at different spatial scales in G28.34-P1. First, the 1 pc clump fragments into five cores (Zhang et al., 2009); second, two of the 0.1 pc cores fragment into even small condensations of 0.01 pc. The fragmentation at clump and core scales are consistent with a hierarchical fragmentation picture. The clump fragmentation is likely the result of initial physical conditions (density, temperature, turbulence, and magnetic fields), while the core fragmentation results from an increased density after the initial fragmentation. Based on the Very Large Array (VLA) (1,1) and (2,2) spectra (Wang et al., 2008) and the IRAM 30m 1.3 mm continuum image (Rathborne et al., 2006), we measure an initial gas temperature of 13 K and density of cm-3, over a scale of 1 pc toward the P1 clump. These values yield a thermal Jeans mass of 0.8 . At the core scale, density increases to several 10 times of the initial clump density. For instance, in SMA2 the core density measured from the 230 GHz image is cm-3, 32 times of the initial clump density. This density, together with an increased gas temperature (16 K), leads to a thermal Jeans mass of 0.2 . These parameters are also listed in Table 3.
It is worth stressing that, in both clump and core fragmentation, the observed fragment (core/condensation) masses are significantly ( times or more) larger than the expected thermal Jeans masses (Table 3), indicating that thermal pressure is not dominant in the fragmentation processes. Instead, turbulence may play an important role in supporting these large core/condensation masses, as discussed in Zhang et al. (2009) (see further discussion in Section 3.1.2). The 1 rms sensitivity in Fig. 1 is 0.8 mJy, corresponding to 0.2 , well below the thermal Jeans mass at the clump scale (0.8 ). However, we did not detect any cores of 0.8 in the filament. The non-detection of Jeans mass cores in the clump may suggest that low mass cores are not significantly centrally peaked, thus they cannot be substantiated from the smooth emission in the clump.
3.1.2 Cylindrical collapse
The most intriguing feature in G28.34-P1 is the configuration of well aligned, regularly spaced cores. The alignment and regularity strongly suggest a mechanism that is responsible for shaping the molecular filament into what it is now. Similar features (but at different spatial scales) have been reported in a large number of nearby dark clouds (Schneider & Elmegreen, 1979), in a few filamentary IRDCs (e.g., Jackson et al., 2010; Miettinen & Harju, 2010), as well as in numerical simulations (Martel et al., 2006). It has been suggested that these fragments are most likely the results of gravitational collapse of a cylinder, as first proposed by Chandrasekhar & Fermi (1953) and followed up by Nagasawa (1987) (also see discussion in Jackson et al., 2010). The theory predicts that, under self gravity, the gas in the cylinder will ultimately beak up into pieces with a certain interval () at which the instability grows the fastest and thus dominates the fragmentation process. Such ‘sausage’ instability produces a chain of equally spaced fragments along the filament, with the spacing roughly the interval . The mass per unit length along the cylinder (or linear mass density) has a maximum value, pc-1, where is the gravitational constant. If the cylinder is supported by thermal pressure, is the sound speed ; if, on the other hand, it is mainly supported by turbulent pressure, then is replaced by the velocity dispersion .
We now compare the observational results with the theoretical predictions. In G28.34-P1, the FWHM line width is 1.7 km s-1, measured form the (1,1) spectrum (Wang et al., 2008; Zhang et al., 2009). The line width is equivalent to a velocity dispersion of km s-1 if the line profile is Gaussian. This velocity dispersion leads to a maximum mass density of 240 pc-1. The total core mass in P1 is 183 over 0.8 pc along the filament (Zhang et al., 2009), implying a linear mass density of 230 pc-1. Taking into account the missing flux in the interferometer maps, the observations match the theoretical predictions well if G28.34-P1 is mainly supported by turbulence.
The separation between two adjacent fragments, , depends on the nature of the cylinder. For an incompressible fluid cylinder in absence of magnetic field, , where is the unperturbed cylindrical radius. And the instability manifests at about two free-fall timescales (see Section 3.2.2). In G28.34-P1, the average separation between cores is pc, implying an initial radius of pc, several times smaller than the core diameter of 0.1 pc (Zhang et al., 2009). If magnetic field is involved, the strength is of the order of (see Equation (93) in Chandrasekhar & Fermi, 1953). With and pc, we obtain a magnetic field strength of 0.16 mG. This is relatively small compared to magnetic field strength observed in massive star formation regions (e.g., Girart et al., 2009).
For an isothermal gas cylinder, , where is the scale height, whereas is the gas density at the center of the cylinder. The equation can be simplified as
In the above equations, the sound speed of 0.21 km s-1 is calculated using a gas temperature of 13 K; volume density is the averaged clump density, while is the average of clump density ( ) and core density ( ) given in Table 3. We see that both scenarios are in agreement with the observed spacing of pc if the assumptions are reasonable. However, since the density should be the central density of the cylinder, we suspect that the turbulent support is more likely dominant in G28.34-P1.
Comparison between observational results and theoretical predictions suggests that the fragmentation in the G28.34-P1 filament is well represented by a cylindrical collapse. The filament is likely supported mainly by turbulence rather than thermal pressure.
3.1.3 Core structures
We measure the core density profiles in unresolved cores SMA1, SMA3, and SMA5. The measurements are performed in the visibility domain to avoid defects in image deconvolution. We combine the SUB, COM, and EXT data for analysis for this purpose. The combined visibility data sample the G28.34-P1 region over baseline lengths ranging from about 5 to 200 k, offering a fairly well sampled measurement.
For a spherical core, the observed flux distribution over radial distance represents the radial density profile modified with temperature gradient. The dust temperature scales as (Scoville & Kwan, 1976) with , if the core is internally heated. As long as Rayleigh-Jeans approximation holds, this temperature gradient contributes to the total flux in the form of . Assuming a power law density profile, , and optically thin dust emission, the observed dust continuum flux integrated along the line of sight, , or
when . In the visibility domain, this is Fourier transformed into a form of
where is the visibility amplitude and is the distance (Looney et al., 2000; Zhang et al., 2009).
Fig. 2 plots the amplitude versus distance for SMA1, SMA3, and SMA5. The amplitude is a vector average of the visibility data in a concentric annuli defined by a bin of 8 k. Least-squares fitting yields for SMA1, for SMA3, and for SMA5. The results are consistent with Zhang et al. (2009) measured from the 230 GHz continuum data, where they derived for SMA4. The density profiles are similar to that of an isothermal sphere in hydrostatic equilibrium, where the radial density scales as . We note that the large error bars and discrepancy at long distances reflect sensitivity limits and may be also partly due to unresolved weak sources in the vicinity.
3.2 Spectral line data and CO outflows
3.2.1 Morphology
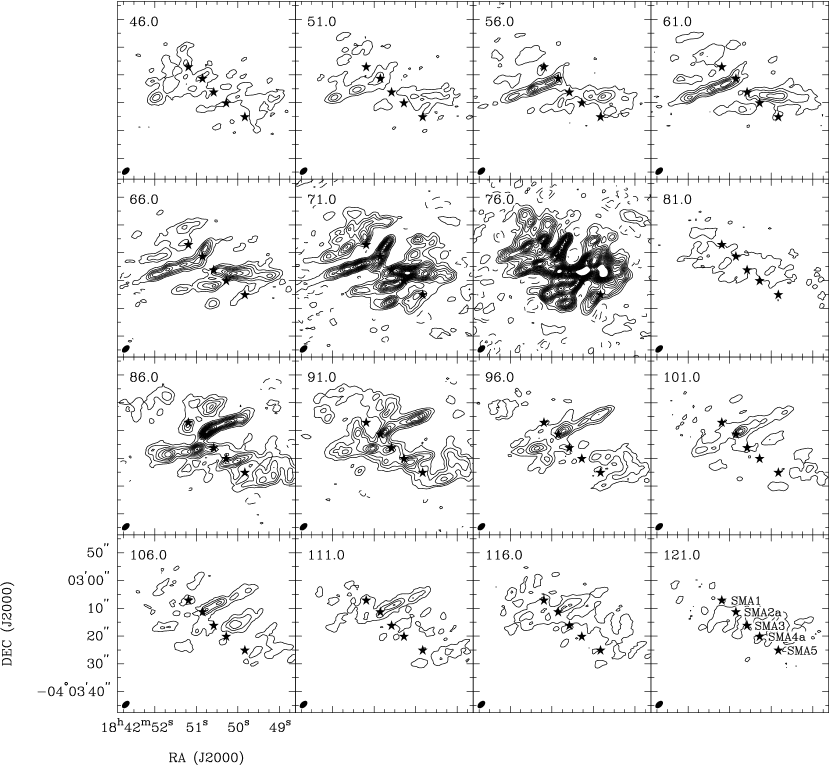
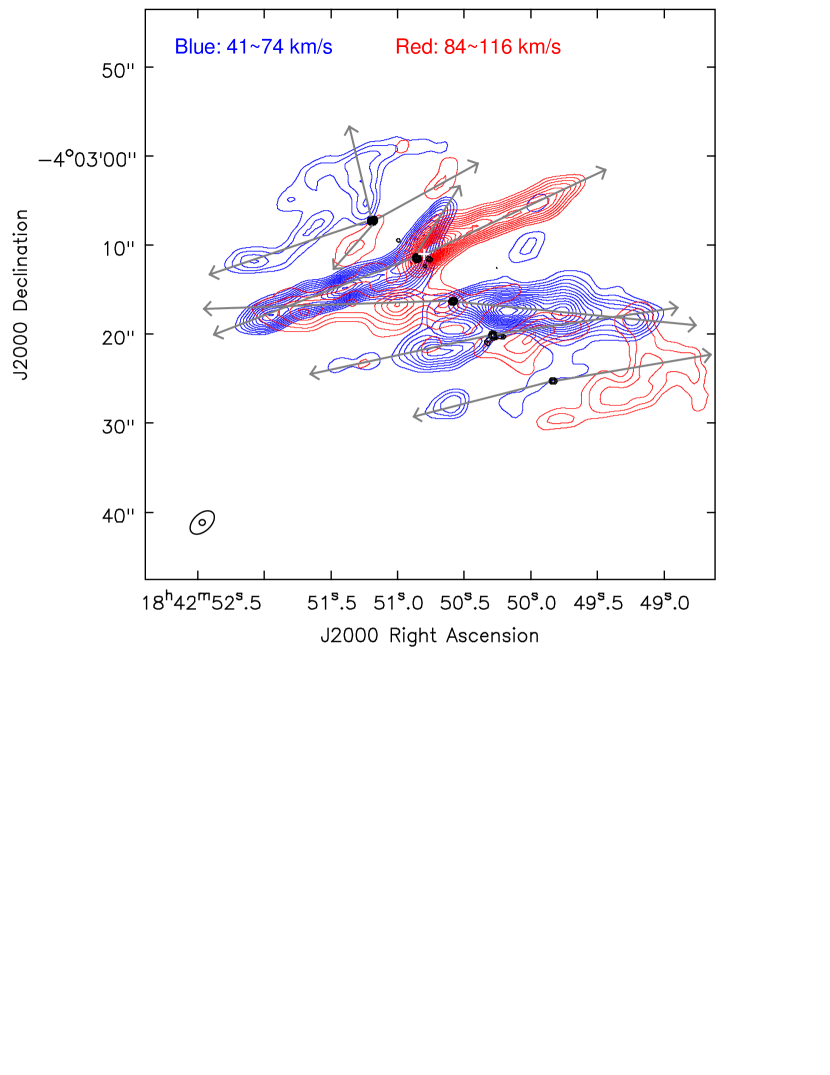
Among the entire 8 GHz SMA band, only CO (3–2) is detected above ( K at 1 km s-1 resolution). Nevertheless, CO (3–2) reveals high-velocity outflowing gas in P1. Fig. 3 presents the CO (3–2) channel maps, and Fig. 4 plots the integrated blueshifted emission in blue contours, and redshifted emission in red contours, superposed on the continuum emission. One can find in Fig. 3 that the extended CO emission close to the systemic velocity (78.4 km s-1) is filtered out. This effect actually helped us identify outflows at high velocities. It is intriguing that all the five dust cores are associated with CO outflows, majority of which are bipolar, jet-like outflows.
The outflows are centered on the dust cores and are generally oriented cross the major axis of the filament. The most prominent outflow is centered on core SMA2, with a blue lobe emanating toward southeast (SE; see channels of 51–71 km s-1 in Fig. 3), and a red lobe toward northwest (NW; 86–116 km s-1). In addition, a minor blue lobe is also seen at NW (66–76 km s-1). The outflow centered on SMA3 is in an east-west orientation, with its blue lobe emanating westbound (51–71 km s-1) and its red lobe eastbound (86–96 km s-1). SMA4 lies in the center of a NW-SE outflow, with a SE blue lobe (66–76 km s-1) and a NW red lobe (86–91 km s-1). SMA1 is associated with a quadrupolar outflow. Its two blue lobes are seen at 66–71 km s-1, emanating toward SE and north, respectively. Its two red lobes are seen from 86 through 91 km s-1 toward NW and south, respectively. The outflow centered on SMA5 has an orientation almost parallel to the SMA4 outflow. This outflow is weak compared to others, and its SE blue lobe and NW red lobe can be barely seen at 66–71 km s-1 and 86–91 km s-1, respectively. Orientation of all the outflows are sketched as arrows in Fig. 4.
The driving sources of these outflows can be identified geometrically. Cores SMA1 to SMA5 are roughly located at the geometric centers of the outflows, respectively. While SMA1, SMA3 and SMA5 are unresolved, SMA2 and SMA4 are resolved into three condensations. In these two cases, we assign the strongest and/or central condensation as the driving source of the relevant outflow. Hence, the outflows are likely driven by condensations SMA1, SMA2a, SMA3, SMA4a, and SMA5.
The CO outflows shown in Figs. 3 and 4 consist of pairs of knots which are geometrically symmetric with respect to the central protostar. Illustrated in Fig. 4, outflows SMA2a and SMA3 have four pairs of knots, and outflow SMA4a has two pairs. The knots are equally spaced by about 0.16 pc. These knots in outflows may represent outbursts due to disk variability arising from episodic, unsteady accretion (e.g., HH 211, Lee et al. 2010; HH 80-81, Qiu & Zhang 2009). With the spacing and maximum outflow velocity , we estimate the period between two outbursts to be about 4000 yr. This value lies in the range of roughly yr used in episodic accretion models for low mass stars (Baraffe & Chabrier, 2010; Zhu et al., 2010).
The outflows show slight bending (Fig. 4). In the outflow SMA3, the red lobe bends toward the south, and the blue lobe bends toward the south, making the outflow C-shaped. In outflows SMA2a and SMA4a, and probably SMA1, the knots seem to trace the propagation of a periodically wiggled, S-shaped molecular jet, most evident at the closest knotty pairs near the protostar. Part of this effect may be contaminated by multiple outflows (e.g., in outflow SMA2a). Nevertheless, the mirror symmetric (C-shaped) wiggles and point symmetric (S-shaped) wiggles may indicate different bending mechanisms like jet precession, orbital motion of the jet source, and Lorentz forces (Fendt & Zinnecker, 1998; Masciadri & Raga, 2002; Raga et al., 2009). Similar bending effects have been observed in a number of Herbig-Haro jets (e.g., HH 211, Lee et al., 2010) and some of the most collimated high-mass molecular jets (e.g., Su et al., 2007). Because the wiggles are not prominent in CO(3–2), we do not discuss this effect further in this paper.
3.2.2 Physical properties
We calculate the physical parameters of each outflow, including mass, momentum, energy, as well as dynamical age and outflow rate. Assuming local thermodynamic equilibrium and optically thin CO emission in the line wings, we first derive the CO column density following Garden et al. (1991),
where is the velocity interval in km s-1, and and are excitation temperature and brightness temperature in K, respectively. We take the gas temperatures to be the excitation temperatures, i.e., 16 K for the SMA2a outflow and 13 K for other outflows. The outflow mass, momentum, energy, dynamical age, and outflow rate are then given by
where is the source distance, is the mean mass per hydrogen molecule assumed to be 2.33 atomic units, is the total solid angle that the flow subtends, is the outflow velocity with respect to the systemic velocity of 78.4 km s-1, is the maximum outflow velocity, and is the flow length. We adopt an empirical abundance ratio of (Blake et al., 1987).
Table 4 lists derived physical parameters for each outflow. These outflows show symmetry in blue- and redshifted lobes. The energetics are small compared to outflows observed in high mass protostellar objects (Beuther et al., 2002c; Zhang et al., 2005), but are similar to outflows emanating from nearby ( kpc) intermediate-mass hot cores (IMHCs: IRAS 22198+6336, Sánchez-Monge et al. 2010; NGC 7129-FIRS 2, Fuente et al. 2005; IC 1396 N, Neri et al. 2007). Particularly, the outflow rate , which amounts to yr-1, and the flow momentum , which ranges from 1 to 9 km s-1, are of the same order to all the three IMHC outflows known to date. The dynamic timescales are yr for all the outflows. These values are comparable to massive outflows but are one order of magnitude higher than the IMHC outflows. Because observations are limited by noise and gas at higher velocities are possible, is a lower limit of the outflow age and the accretion history of the dominant protostar. Theoretical models suggest that the massive star formation process takes a few times of the free-fall timescale () of the core. Beuther et al. (2002c) observed a rough equality between and . For the P1 cores, we obtain of yr based on the densities given in Table 3. We see that approximates well, and this supports the idea that flow ages are good estimates of protostar lifetimes (Beuther et al., 2002c).
The SMA2a, SMA3, and SMA4a outflows are so well collimated that they resemble “molecular jets” commonly found in low-mass star-forming regions (e.g., L1157, Zhang et al. 2000; OMC-1S, Zapata et al. 2005; HH 211, Lee et al. 2007). Recently, interferometric observations have revealed collimated outflows in high-mass star-forming regions (e.g., AFGL 5142, Hunter et al. 1999; Zhang et al. 2007; IRAS 20126+4104, Cesaroni et al. 1999; Shepherd et al. 2000; IRAS 05358+3543, 19410+2336, 19217+1651, Beuther et al. 2002a, 2003, 2004; HH80-81, Qiu & Zhang 2009). To measure the collimation, we take the ratio of outflow total length (blue + red lobes) over width measured in Fig. 4 as collimation factor. We obtain 14, 10, and 7 for SMA2a, SMA3, and SMA4a outflows, over scales of 0.5–1 pc. These values are comparable to that of the most collimated low-mass outflows and are higher than that of the high-mass outflows discovered by single dishes and previous interferometers (Wu et al., 2004; Beuther et al., 2002c; Qiu & Zhang, 2009). Beuther et al. (2007) reported one outflow in IRAS 05358+3543 with a collimation factor of and claimed that it was the first massive outflow observed with such a high degree of collimation at a scale of 1 pc. In G28.34-P1, the SMA2a and SMA3 outflows are among the best collimated molecular outflows yet discovered in high-mass star-forming regions over parsec scales. We note that these collimation factors should be considered as lower limits because the outflow lengths and widths are not corrected for inclination angle, and are not deconvolved with synthesized beam.
3.3 Massive star formation through an intermediate-mass stage
The presence of highly collimated outflows demonstrates a protostellar nature of the condensations in G28.34-P1. Wang et al. (2008) reported a luminosity of for the 24 m source associated with SMA2. Rathborne et al. (2010) obtained a luminosity of for the entire P1 clump. These luminosities set a limit on the mass of the embedded stars of 3–7 , if they are at the zero-age main sequence. The stellar masses put these objects at an intermediate-mass stage. The presence of highly collimated outflows also favors a disk-mediated accretion scenario of massive mass star formation (Zhang et al., 2005; Cesaroni et al., 2007) in a manner similar to low-mass star formation. In addition, the high collimation also indicates that these outflows are at very early stages since the opening angle of outflows widens as they evolve.
The G28.34-P1 condensations are comparable in mass to the nearby intermediate-mass “cores” (2–5 ) at a similar spatial extent ( AU; Sánchez-Monge et al. 2010). The non-detection of organic molecules (CH3OH, CH3CN, etc.) in P1 is likely due to the sensitivity limit of our observations. Sánchez-Monge et al. (2010) observed copious hot core molecular line emissions toward I22198, an intermediate-mass star with a luminosity of 370 at a distance of 0.76 kpc. The typical brightness temperature of the lines is 0.8 K. If we scale I22198 to the distance of G28.34, the emission would become 40 times fainter, well below our detection limit of 0.1 K per 1 km s-1 resolution (also true for Zhang et al., 2009). Therefore, it is possible that G28.34-P1 may have already experienced an increase in abundance of organic molecules as expected from protostellar heating, similar to I22198. Deep spectroscopy with ALMA will be able to verify the presence of hot core type molecules in G28.34-P1.
Despite the similarities between the G28.34-P1 condensations and the intermediate-mass star forming “cores”, there is an important distinction between the two: The G28.34-P1 condensations are embedded in compact ( pc), dense cores ( , see Table 3) with several tens of solar masses, which are hierarchically embedded in a massive, dense ( , Table 3) molecular clump of over , an order of magnitude larger than the mass in a typical intermediate-mass star-forming region. With a typical star formation efficiency of 30% in dense gas and a standard stellar initial mass function, it is natural to expected that massive stars will eventually emerge in some of the condensations (if not all), at the end of protostellar accretion. At that time, P1 would become a massive star cluster. In the context of evolution, an immediate comparison to G28.34-P1 is the northern clump G28.34-P2 in the same cloud complex, which may represent the future of P1. With a similar clump mass, P2 has a higher gas temperature of 30 K, and a higher luminosity of (Rathborne et al., 2010), equivalent to a zero-age main-sequence mass of 14 . The SMA observations detected molecular lines from CH3OH and CH3CN in the P2 cores, while none in the P1 cores (Zhang et al., 2009). Likewise, other massive molecular clumps (e.g., W33A, Galván-Madrid et al. 2010; G31.41, Girart et al. 2009; NGC 6334, Hunter et al. 2006; G10.6, Liu et al. 2010) that have luminosities of , and are associated with radio continuum emission, may represent an even more evolved phase of massive star formation at which high mass protostellar objects have already emerged.
The large mass reservoir (22–64 at pc; 1000 at pc) in G28.34-P1 and the outflows suggest that the condensations are, and will remain, actively accreting materials through the ambient medium. Materials in the cores fall onto the embedded protostars through disks and at the same time materials in the clump fall onto the cores. Observations of G28.34-P1 seem to indicate a continuous accretion over a spatial scale that spreads two orders of magnitude, from 1 to 0.01 pc, and finally reaches onto the protostars. This is a relatively new picture, but has also been reported in another IRDC, G30.88+0.13 (Zhang & Wang, 2011). A comparison with massive and more luminous molecular clumps indicates that the condensations will grow in mass, and likely emerge as massive stars eventually. The embedded protostars appear to be still intermediate-mass objects and are on their way to eventual massive stars. Our observations of the G28.34-P1 clump provide perhaps the first glimpse of an intermediate-mass stage of massive, clustered star formation.
4 Conclusion
We present an observational study of the P1 clump in IRDC G28.34+0.06 using the SMA at the 345 GHz band. Our main findings are summarized as follows.
1. High resolution and high sensitivity image at 0.88 mm reveals hierarchical fragmentation at 1 pc and 0.1 pc scales. The mass of the dust cores and condensations are much larger than the relevant thermal Jean masses. The clump fragmentation is consistent with a cylindrical collapse.
2. All five dust cores are driving highly collimated CO (3–2) outflows, indicating a protostellar nature of the condensations embedded in the cores. Bipolar, jet-like outflows suggest a disk-mediated accretion of high-mass star formation.
3. The relatively low luminosity and a lack of detection of organic molecules indicate that the condensations in P1 underline an intermediate-mass stage of massive star formation and will likely form massive stars eventually.
| Array | UT date | Antenna | Bandwidth | Bandpass | Flux | aaZenith opacity measured from water vapor monitors mounted on CSO or JCMT. | |
|---|---|---|---|---|---|---|---|
| (yyyymm) | No. | (GHz) | Calibrator | Calibrator | (K) | ||
| COM | 20090426 | 7 | 2 | 3C273 | Ceres | 200-400 | 0.09-0.15 |
| COM | 20090503 | 7 | 2 | 3C273 | Ceres | 160-280 | 0.05 |
| EXT | 20090806 | 8 | 4 | 3C454.3 | MWC349 | 260-500 | 0.09-0.14 |
| EXT | 20090826 | 7 | 4 | 3C454.3 | Uranus | 120-250 | 0.06-0.07 |
| SUB | 20090905 | 5 | 4 | 3C454.3 | Ganymede, Callisto | 160-300 | 0.05-0.07 |
| SUB | 20090923 | 7 | 4 | 3C454.3 | Ganymede, Callisto | 150-300 | 0.07-0.09 |
| Name | RA(J2000) | Dec(J2000) | Size | P.A. | Mass/ | ||||
|---|---|---|---|---|---|---|---|---|---|
| h:m:s | d:m:s | a | ∘ | mJy | mJy | ||||
| SMA1 | 18:42:51.19 | -04:03:07.2 | 0.82 | 0.68 | -63.6 | 25.3 | 31.6 | 10.6 | 19.8 |
| SMA2a | 18:42:50.85 | -04:03:11.4 | 0.74 | 0.70 | 55.2 | 15.7 | 18.3 | 4.3 | 8.1 |
| SMA2b | 18:42:50.76 | -04:03:11.5 | 1.18 | 0.68 | 56.8 | 8.5 | 15.5 | 3.6 | 6.8 |
| SMA2c | 18:42:50.79 | -04:03:12.4 | 0.81 | 0.62 | 60.5 | 5.1 | 5.8 | 1.4 | 2.6 |
| SMA2d | 18:42:50.99 | -04:03:09.5 | 0.94 | 0.63 | 62.2 | 5.1 | 6.7 | 1.6 | 3.0 |
| SMA3 | 18:42:50.58 | -04:03:16.3 | 0.76 | 0.63 | -82.3 | 14.4 | 15.6 | 5.2 | 9.8 |
| SMA4a | 18:42:50.28 | -04:03:20.2 | 0.78 | 0.75 | 38.1 | 12.2 | 16.0 | 5.3 | 10.0 |
| SMA4b | 18:42:50.32 | -04:03:21.0 | 1.30 | 0.75 | 33.2 | 6.8 | 15.0 | 5.0 | 9.4 |
| SMA4c | 18:42:50.20 | -04:03:20.3 | 0.93 | 0.55 | -84.7 | 7.4 | 8.5 | 2.8 | 5.3 |
| SMA5 | 18:42:49.83 | -04:03:25.2 | 0.91 | 0.74 | 78.8 | 16.6 | 25.1 | 8.4 | 15.7 |
| Source | aaGas temperatures are derived from VLA (1,1) and (2,2) lines (Wang et al., 2008). | (H2) | Fragment Mass bbObserved core/condensation masses are calculated using a dust opacity index of . | ||
|---|---|---|---|---|---|
| K | cm-3 | pc | |||
| P1 | 13 | 0.8 | 0.04 | 22–64 | |
| P1-SMA2 | 16 | 0.2 | 0.008 | 1.4–4.3 |
| Parameter aaParameters are not corrected for inclination angle. | SMA1 | SMA2a | SMA3 | SMA4a | SMA5 | |||||
|---|---|---|---|---|---|---|---|---|---|---|
| Blue | Red | Blue | Red | Blue | Red | Blue | Red | Blue | Red | |
| (km s-1) bbRange of velocities used to derive outflow parameters. | [67,76] | [85,93] | [41,76] | [84,116] | [50,71] | [85,99] | [64,72] | [85,107] | [66,73] | [86,93] |
| () | 0.20 | 0.07 | 0.38 | 0.23 | 0.22 | 0.18 | 0.06 | 0.12 | 0.05 | 0.06 |
| ( km s-1) | 1.12 | 0.71 | 5.09 | 4.04 | 3.17 | 2.05 | 0.52 | 1.50 | 0.35 | 0.63 |
| ( km2 s-2) | 3.85 | 3.62 | 53.46 | 46.18 | 26.96 | 13.06 | 2.57 | 11.15 | 1.40 | 3.40 |
| (pc) ccProjected length of the longer lobe in case of two lobes. | 0.40 | 0.27 | 0.51 | 0.48 | 0.56 | 0.51 | 0.44 | 0.43 | 0.34 | 0.39 |
| ( yr) | 3.43 | 1.81 | 1.33 | 1.25 | 1.93 | 2.42 | 2.99 | 1.47 | 2.68 | 2.61 |
| ( yr-1) | 0.58 | 0.41 | 2.86 | 1.84 | 1.14 | 0.74 | 0.20 | 0.82 | 0.19 | 0.23 |


References
- Baraffe & Chabrier (2010) Baraffe, I., & Chabrier, G. 2010, A&A, 521, A44+
- Beltrán et al. (2006) Beltrán, M. T., Brand, J., Cesaroni, R., Fontani, F., Pezzuto, S., Testi, L., & Molinari, S. 2006, A&A, 447, 221
- Beuther et al. (2007) Beuther, H., Leurini, S., Schilke, P., Wyrowski, F., Menten, K. M., & Zhang, Q. 2007, A&A, 466, 1065
- Beuther et al. (2004) Beuther, H., Schilke, P., & Gueth, F. 2004, ApJ, 608, 330
- Beuther et al. (2002a) Beuther, H., Schilke, P., Gueth, F., McCaughrean, M., Andersen, M., Sridharan, T. K., & Menten, K. M. 2002a, A&A, 387, 931
- Beuther et al. (2002b) Beuther, H., Schilke, P., Menten, K. M., Motte, F., Sridharan, T. K., & Wyrowski, F. 2002b, ApJ, 566, 945
- Beuther et al. (2002c) Beuther, H., Schilke, P., Sridharan, T. K., Menten, K. M., Walmsley, C. M., & Wyrowski, F. 2002c, A&A, 383, 892
- Beuther et al. (2003) Beuther, H., Schilke, P., & Stanke, T. 2003, A&A, 408, 601
- Blake et al. (1987) Blake, G. A., Sutton, E. C., Masson, C. R., & Phillips, T. G. 1987, ApJ, 315, 621
- Carey et al. (1998) Carey, S. J., Clark, F. O., Egan, M. P., Price, S. D., Shipman, R. F., & Kuchar, T. A. 1998, ApJ, 508, 721
- Carey et al. (2000) Carey, S. J., Feldman, P. A., Redman, R. O., Egan, M. P., MacLeod, J. M., & Price, S. D. 2000, ApJ, 543, L157
- Cesaroni et al. (1999) Cesaroni, R., Felli, M., Jenness, T., Neri, R., Olmi, L., Robberto, M., Testi, L., & Walmsley, C. M. 1999, A&A, 345, 949
- Cesaroni et al. (2007) Cesaroni, R., Galli, D., Lodato, G., Walmsley, C. M., & Zhang, Q. 2007, Protostars and Planets V, 197
- Cesaroni et al. (2006) Cesaroni, R., Galli, D., Lodato, G., Walmsley, M., & Zhang, Q. 2006, Nature, 444, 703
- Chambers et al. (2009) Chambers, E. T., Jackson, J. M., Rathborne, J. M., & Simon, R. 2009, ApJS, 181, 360
- Chandrasekhar & Fermi (1953) Chandrasekhar, S., & Fermi, E. 1953, ApJ, 118, 116
- Chen et al. (2010) Chen, H., Liu, S., Su, Y., & Zhang, Q. 2010, ApJ, 713, L50
- Draine & Lee (1984) Draine, B. T., & Lee, H. M. 1984, ApJ, 285, 89
- Egan et al. (1998) Egan, M. P., Shipman, R. F., Price, S. D., Carey, S. J., Clark, F. O., & Cohen, M. 1998, ApJ, 494, L199+
- Fendt & Zinnecker (1998) Fendt, C., & Zinnecker, H. 1998, A&A, 334, 750
- Fuente et al. (2005) Fuente, A., Neri, R., & Caselli, P. 2005, A&A, 444, 481
- Galván-Madrid et al. (2010) Galván-Madrid, R., Zhang, Q., Keto, E., Ho, P. T. P., Zapata, L. A., Rodríguez, L. F., Pineda, J. E., & Vázquez-Semadeni, E. 2010, ApJ, 725, 17
- Garden et al. (1991) Garden, R. P., Hayashi, M., Hasegawa, T., Gatley, I., & Kaifu, N. 1991, ApJ, 374, 540
- Girart et al. (2009) Girart, J. M., Beltrán, M. T., Zhang, Q., Rao, R., & Estalella, R. 2009, Science, 324, 1408
- Hennebelle et al. (2001) Hennebelle, P., Pérault, M., Teyssier, D., & Ganesh, S. 2001, A&A, 365, 598
- Hildebrand (1983) Hildebrand, R. H. 1983, QJRAS, 24, 267
- Ho et al. (2004) Ho, P. T. P., Moran, J. M., & Lo, K. Y. 2004, ApJ, 616, L1
- Hunter et al. (2006) Hunter, T. R., Brogan, C. L., Megeath, S. T., Menten, K. M., Beuther, H., & Thorwirth, S. 2006, ApJ, 649, 888
- Hunter et al. (1999) Hunter, T. R., Testi, L., Zhang, Q., & Sridharan, T. K. 1999, AJ, 118, 477
- Jackson et al. (2010) Jackson, J. M., Finn, S. C., Chambers, E. T., Rathborne, J. M., & Simon, R. 2010, ApJ, 719, L185
- Lee et al. (2010) Lee, C., Hasegawa, T. I., Hirano, N., Palau, A., Shang, H., Ho, P. T. P., & Zhang, Q. 2010, ApJ, 713, 731
- Lee et al. (2007) Lee, C., Ho, P. T. P., Palau, A., Hirano, N., Bourke, T. L., Shang, H., & Zhang, Q. 2007, ApJ, 670, 1188
- Liu et al. (2010) Liu, H. B., Ho, P. T. P., & Zhang, Q. 2010, ApJ, 725, 2190
- Looney et al. (2000) Looney, L. W., Mundy, L. G., & Welch, W. J. 2000, ApJ, 529, 477
- Martel et al. (2006) Martel, H., Evans, II, N. J., & Shapiro, P. R. 2006, ApJS, 163, 122
- Masciadri & Raga (2002) Masciadri, E., & Raga, A. C. 2002, ApJ, 568, 733
- Miettinen & Harju (2010) Miettinen, O., & Harju, J. 2010, A&A, 520, A102+
- Molinari et al. (2000) Molinari, S., Brand, J., Cesaroni, R., & Palla, F. 2000, A&A, 355, 617
- Nagasawa (1987) Nagasawa, M. 1987, Progress of Theoretical Physics, 77, 635
- Neri et al. (2007) Neri, R., et al. 2007, A&A, 468, L33
- Perault et al. (1996) Perault, M., et al. 1996, A&A, 315, L165
- Peretto & Fuller (2010) Peretto, N., & Fuller, G. A. 2010, ApJ, 723, 555
- Pillai et al. (2006) Pillai, T., Wyrowski, F., Carey, S. J., & Menten, K. M. 2006, A&A, 450, 569
- Plume et al. (1997) Plume, R., Jaffe, D. T., Evans, II, N. J., Martin-Pintado, J., & Gomez-Gonzalez, J. 1997, ApJ, 476, 730
- Qiu & Zhang (2009) Qiu, K., & Zhang, Q. 2009, ApJ, 702, L66
- Raga et al. (2009) Raga, A. C., Esquivel, A., Velázquez, P. F., Cantó, J., Haro-Corzo, S., Riera, A., & Rodríguez-González, A. 2009, ApJ, 707, L6
- Rathborne et al. (2010) Rathborne, J. M., Jackson, J. M., Chambers, E. T., Stojimirovic, I., Simon, R., Shipman, R., & Frieswijk, W. 2010, ApJ, 715, 310
- Rathborne et al. (2006) Rathborne, J. M., Jackson, J. M., & Simon, R. 2006, ApJ, 641, 389
- Sánchez-Monge et al. (2010) Sánchez-Monge, Á., Palau, A., Estalella, R., Kurtz, S., Zhang, Q., Di Francesco, J., & Shepherd, D. 2010, ApJ, 721, L107
- Schilke et al. (1997) Schilke, P., Groesbeck, T. D., Blake, G. A., & Phillips, T. G. 1997, ApJS, 108, 301
- Schneider & Elmegreen (1979) Schneider, S., & Elmegreen, B. G. 1979, ApJS, 41, 87
- Scoville & Kwan (1976) Scoville, N. Z., & Kwan, J. 1976, ApJ, 206, 718
- Shang et al. (2006) Shang, H., Allen, A., Li, Z., Liu, C., Chou, M., & Anderson, J. 2006, ApJ, 649, 845
- Shang et al. (2007) Shang, H., Li, Z., & Hirano, N. 2007, Protostars and Planets V, 261
- Shepherd et al. (2000) Shepherd, D. S., Yu, K. C., Bally, J., & Testi, L. 2000, ApJ, 535, 833
- Shu et al. (1987) Shu, F. H., Adams, F. C., & Lizano, S. 1987, ARA&A, 25, 23
- Simon et al. (2006a) Simon, R., Jackson, J. M., Rathborne, J. M., & Chambers, E. T. 2006a, ApJ, 639, 227
- Simon et al. (2006b) Simon, R., Rathborne, J. M., Shah, R. Y., Jackson, J. M., & Chambers, E. T. 2006b, ApJ, 653, 1325
- Su et al. (2007) Su, Y., Liu, S., Chen, H., Zhang, Q., & Cesaroni, R. 2007, ApJ, 671, 571
- Wang et al. (2008) Wang, Y., Zhang, Q., Pillai, T., Wyrowski, F., & Wu, Y. 2008, ApJ, 672, L33
- Wang et al. (2006) Wang, Y., Zhang, Q., Rathborne, J. M., Jackson, J., & Wu, Y. 2006, ApJ, 651, L125
- Wu et al. (2004) Wu, Y., Wei, Y., Zhao, M., Shi, Y., Yu, W., Qin, S., & Huang, M. 2004, A&A, 426, 503
- Zapata et al. (2005) Zapata, L. A., Rodríguez, L. F., Ho, P. T. P., Zhang, Q., Qi, C., & Kurtz, S. E. 2005, ApJ, 630, L85
- Zhang (2005) Zhang, Q. 2005, in IAU Symposium, Vol. 227, Massive Star Birth: A Crossroads of Astrophysics, ed. R. Cesaroni, M. Felli, E. Churchwell, & M. Walmsley, 135–144
- Zhang et al. (2000) Zhang, Q., Ho, P. T. P., & Wright, M. C. H. 2000, AJ, 119, 1345
- Zhang et al. (2007) Zhang, Q., Hunter, T. R., Beuther, H., Sridharan, T. K., Liu, S., Su, Y., Chen, H., & Chen, Y. 2007, ApJ, 658, 1152
- Zhang et al. (2005) Zhang, Q., Hunter, T. R., Brand, J., Sridharan, T. K., Cesaroni, R., Molinari, S., Wang, J., & Kramer, M. 2005, ApJ, 625, 864
- Zhang et al. (2001) Zhang, Q., Hunter, T. R., Brand, J., Sridharan, T. K., Molinari, S., Kramer, M. A., & Cesaroni, R. 2001, ApJ, 552, L167
- Zhang & Wang (2011) Zhang, Q., & Wang, K. 2011, ApJ, 733, 26
- Zhang et al. (2009) Zhang, Q., Wang, Y., Pillai, T., & Rathborne, J. 2009, ApJ, 696, 268
- Zhu et al. (2010) Zhu, Z., Hartmann, L., & Gammie, C. 2010, ApJ, 713, 1143