A MACHINE LEARNING PIPELINE FOR DISCRIMINANT PATHWAYS IDENTIFICATION
Abstract
1 Motivation:
Identifying the molecular pathways more prone to disruption during a pathological process is a key task in network medicine and, more in general, in systems biology.
2 Results:
In this work we propose a pipeline that couples a machine learning solution for molecular profiling with a recent network comparison method. The pipeline can identify changes occurring between specific sub-modules of networks built in a case-control biomarker study, discriminating key groups of genes whose interactions are modified by an underlying condition. The proposal is independent from the classification algorithm used. Three applications on genomewide data are presented regarding children susceptibility to air pollution and two neurodegenerative diseases: Parkinson’s and Alzheimer’s.
3 Availability:
Details about the software used for the experiments discussed in this paper are provided in the Appendix.
4 Contact:
furlan@fbk.eufurlan@fbk.eu
5 Introduction
Nowadays, it is widely accepted as a consolidated fact that most of the known diseases are of systemic nature: their phenotypes can be attributed to the breakdown of a rather complex set of molecular interaction among the cell’s components rather than imputed to the misfunctioning of a single entity such as a gene. A major aim of systems biology and, in particular, of its newly emerging discipline known as network medicine (Barabasi et al. (2011)), is the understanding of the cellular wiring diagram at all possible levels of organization (from transcriptomics to signalling) of the functional design, the molecular pathways being a typical example. Such reconstruction is made feasible by the recent advances in the theory of complex networks (e.g. Strogatz (2001); Newman (2003); Boccaletti et al. (2006); Newman (2010); Buchanan et al. (2010)) and, in particular, in the reconstruction algorithms for inferring networks topology and wiring starting from a collection of high-throughput measurements (He et al. (2009)). However, the tackled problem is hard (”a daunting task”, Baralla et al. (2009)) and these methods are not flawless Marbach et al. (2010), due to many factors. Among them, underdeterminacy is a major issue (De Smet and Marchal (2010)), and the ratio between the network dimension (number of nodes) and the number of available measurements to infer interactions plays a key role for the stability of the reconstructed structure. Although some effort has recently been put into facing this issue, the stability (and thus the reproducibility) of the process is still an open problem.
In this contribution we propose a pipeline for machine learning driven determination of the disruption of important molecular pathways induced or inducing a condition starting from microarray measurements in a case/control experimental design. The problem of underdeterminacy in the inference procedure is avoided by focussing only on subnetworks, and the relevance of the studied pathways for the disease is judged in terms of discriminative relevance for the underlying classification problem. The profiling part of the pipeline, composed of a classifier and a feature selection method embedded within an adequate experimental procedure or Data Analysis Protocol (The MicroArray Quality Control Consortium (2010)), is used to rank the genes with the highest discriminative power. These genes undergo an enrichment phase (Zhang et al. (2005a); Subramanian et al. (2005)) to individuate the involved whole pathways to keep track of the established functional dependencies that would otherwise get lost by limiting the subnetwork analysis to the sole selected genes. Finally, a network is inferred for both the case and the control samples on the selected pathways, and the two structure are compared to pinpoint the occurring differences and thus to detect the relevant pathway related variations.
A noteworthy point of this workflow is the independence from its ingredients: the classifier, the feature ranking algorithm, the enrichment procedure, the inference method and the network comparison function. This last point is worth a comment: although already fruitfully used even in a biological context (Sharan and Ideker (2006)), the problem of quantitatively comparing network (e.g. using a metric instead of evaluating network properties) is a widely open issue affecting many scientific disciplines. As discussed in (Jurman et al. (2011)), many classical distances (such as those of the edit family) have a relevant drawback in being local, that is focussing only on the portions of the network interested by the differences in the presence/absence of matching links. More recently, other metrics can overcome this problem so to consider the global structure of the compared topologies; among such distances, the spectral ones - based on the list of eigenvalues of the laplacian matrix of the underlying graph - are quite interesting, and, in particular, the Ipsen-Mikhailov (Ipsen and Mikhailov (2002)) distance has been proven to be the most robust in a wide range of situations.
In what follows we will describe the newly introduced workflow in details, providing three examples of application in problems of biological interest: the first tasks concerns the transcriptomics consequences of exposition to environmental pollution on a cohort of children in Czech Republic, the second one investigates the molecular characteristics between Parkinson’s disease (PD) at early and late stages and the third regards the characterization of Alzheimer’s disease (AD) at early and late stages. To strenghten the support to our proposal, the two problems will be dealt with by using different experimental conditions, i.e., varying the employed algorithms throughout the various steps of the workflow. In both cases, biologically meaningful considerations can be drawn, consistent with previous findings, showing the effectiveness of the proposed procedure in the assessment of the occuring subnetwork variations.
6 System and Methods
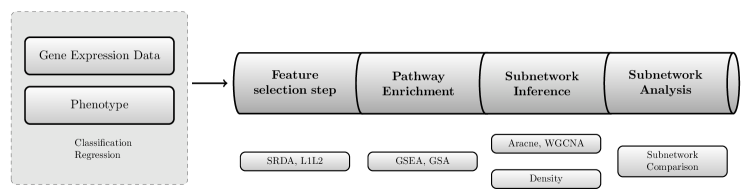
The proposed machine learning pipeline handles case/control transcription data through four main steps, from a profiling task output (a ranked list of genes) to the identification of discriminant pathways, see Figure 1. Alternative algorithms can be used at each step of the pipeline: as an example in the profiling part different classifiers, regression or feature selection methods can be adopted. In Section 10.1 we describe the elementary steps used in the experiments.
Formally, we are given a collection of subjects, each described by a -dimensional vector of measurements. Each sample is also associated with a phenotypical label , assigning it to a class (e.g. pollution vs. no-pollution in Section 8.1). The dataset is therefore represented by an gene expression data matrix , where and a corresponding labels vector .
The matrix is used to feed the profiling part of the pipeline. We choose a proper Data Analysis Protocol (The MicroArray Quality Control Consortium (2010)) for ensuring accurate and reproducible results and a prediction model. The model is built as a classifier (e.g., SRDA, Cai et al. (2008)) or a regression method (e.g., , De Mol et al. (2009)) coupled with a feature selection algorithm. Thus, we obtain a ranked list of genes from which we extract a gene signature taking the top- most discriminant genes. The choice is performed by finding a balance between the accuracy of the classifier and the stability of the signature (The MicroArray Quality Control Consortium (2010)).
Applying pathway enrichment techniques (e.g., GSEA or GSA, Zhang et al. (2005a); Subramanian et al. (2005)), we retrieve for each gene the corresponding whole pathway , where the genes not necessarily belong to the original signature . Extending the analysis to all the genes of the pathway allows us to explore functional interactions that would otherwise get lost.
The subnetwork inference phase (e.g., WGCN or ARACNE, Zhao et al. (2010); Meyer et al. (2008)) requires to reconstruct a network for each pathway by using the steady state expression data of the samples of each class . The network inference procedure is limited to the sole genes belonging to the pathway in order to avoid the problem of intrinsic underdeterminacy of the task. As an additional caution against this problem, in the following experiments we limit the analysis to pathways having more than 4 nodes and less than 1000 nodes. For each and for each , we obtain a real-valued adjacency matrix, which is then binarized by choosing a threshold on the correlation values. This choice requires the construction of a binary adjacency matrix for each , for each and for a grid of threshold values . For each value of the grid, we compute for each both the distance (e.g., the Ipsen-Mikhailov distance, see for details Section 10.1.6) between the case and control pathway graphs and the corresponding densities. We chose providing the best balance between the average distance across the pathways and the network density. For a fixed and for each , we obtain a score used to rank the pathways . As an additional scoring indicator for , we also provide the difference between the weighted degree in the control () and in the patient () network: . A final step of biological relevance assessment of the ranked pathways concludes the pipeline.
7 Data Description
Section 8 describes three different experiments. In the first experiment we used a genome-wide dataset created for investigating the effects of air pollution on children. In the second and third experiment we analyzed gene expression data on two neurodegenerative diseases: Parkinson’s (PD) and Alzheimer’s (AD). All the examples are based on publicly available datasets on the Gene Expression Omnibus (GEO).
7.1 Children susceptibility to air pollution
The first dataset (GSE7543) collects data of children living in two regions of the Czech Republic with different air pollution levels (van Leeuwen et al. (2008, 2006)): 23 children recruited in the polluted area of Teplice and 24 children living in the cleaner area of Prachatice. Blood samples were hybridized on Agilent Human 1A 22k oligonucleotide microarrays. After normalization we retained 17564 features.
7.2 Clinical stages of Parkinson’s disease
For PD we consider two publicly available datasets from GEO: GSE6613 (Scherzer et al. (2007)) and GSE20295 (Zhang et al. (2005c)). The former includes 22 controls and 50 whole blood samples from patients predominantly at early PD stages while the latter is composed of 53 controls and 40 patients with late stage PD. Biological data were hybridized on Affymetrix HG-U133A platform, estimating the expression of 22215 probesets for each sample.
7.3 Clinical stages of Alzheimer’s disease
For AD we analyzed two GEO datasets: GSE9770 and GSE5281 (Liang et al. (2010, 2008)). The first includes 74 controls and 34 samples from non-demented patients with AD (since it is the earliest AD diagnosed, we will label it as early hereafter) and the second is composed of 74 controls and 80 samples from patients with late onset AD. The samples were extracted from six brain regions, differently susceptible to the disease: entorhinal cortex (EC), hippocampus (HIP), middle temporal gyrus (MTG), posterior cingulate cortex (PC), superior frontal gyrus (SFG) and primary visual cortex (VCX). The latter is known to be relatively spared by the disease, therefore we did not consider the samples within the VCX region. Overall, we analyzed 62 controls and 29 AD samples for GSE9770 and 62 controls and 68 AD samples for GSE5281. Biological data were hybridized on Affymetrix HG-U133Plus2.0 platform, estimating the expression of 54713 probesets for each sample.
8 Discussion
8.1 Air Pollution Experiment
The SRDA analysis of the air pollution dataset was performed within a -fold cross validation (CV) schema, producing a gene signature, characterizing the molecular differences between children in Teplice (polluted) and Prachatice (not polluted). The signature consists of 50 probesets, corresponding to 43 genes, achieving accuracy.
The enrichment analysis on the signature allowed a functional characterization of the relevant genes, identifying 11 enriched ontologies in GO (listed in Appendix Table 4). We then constructed the corresponding WGCN network for the 11 selected pathways for both cases and controls. Full details about the experiment are reported in Appendix Section 10.2.1.
| \toprulePathway Code | Gene Symbol | |
| \midruleGO:0043066 | 0.257 | |
| GO:0001501 | 0.149 | MATN3 |
| GO:0007399 | 0.093 | NRGN |
| GO:0016787 | 0.078 | DHX32, CLC |
| GO:0005516 | 0.076 | MYH1 |
| GO:0007275 | 0.076 | FKHL18, HOXB8, OLIG1 |
| GO:0006954 | 0.048 | PROK2 |
| \botrule |
In Table 1 we report the most biologically relevant pathways, ranked for decreasing normalized Ipsen-Mikhailov distance , which provides a measure of the structural distance between the networks inferred for the two classes. The most disrupted pathway is GO:0043066, i.e. apoptosis followed by GO:0001501 i.e. skeletal development. Since the children under study are undergoing natural development, especially physical changes of their skeleton, the high differentiation between cases and controls of the GO:0001501 and the involvement of pathway GO:0007275 i.e. developmental process is biologically very sound. Another relevant pathway is GO:0006954, representing the response to infection or injury caused by chemical or physical agents. Several genes included in GO:0005516, (i.e. calmodulin binding) bind or interact with calmodulin, that is a calcium-binding protein involved in many essential processes, such as inflammation, apoptosis, nerve growth, and immune response. This is a key pathway that is linked with all the above mentioned terms as well as to GO:0007399, i.e. nervous system development, being one of the most stimulated pathways together with GO:0001501.
As described in Section 6 the pipeline also provides a score of the variation of the number of interactions for . The full list is provided in Appendix Table 10.2.1, here we discuss a subset of the most biologically relevant genes.
FKHL18, HOXB8, PROK2, DHX32, MATN3 are directly involved in the development. CLC is a key element in the inflammation and immune system. OLIG1 is a transcription factor that works in the oligodendrocytes within the brain. NRGN binds calcium and is a target for thyroid hormones in the brain. Finally, MYH1 encodes for myosin that is a major contractile protein that forms striated, smooth and non-muscle cells. MYH1 isoforms show expression that is spatially and temporally regulated during development.
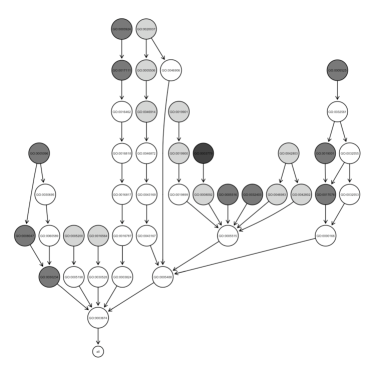
Figure 2 shows the network of the GO:0007399 pathway, related to the nervous system development in the two cohorts. It is clear that several connections among the genes within this pathway are missing in the subjects living in the polluted area (Teplice). Therefore the nervous system development in these children is potentially at risk compared to those living in the not polluted city (Prachatice).
 |
 |
| (a) Prachatice | (b) Teplice |
8.2 Parkinson’s Disease Experiment
The analysis of the two PD datasets was performed respectively within a -fold nested CV loop for the early PD and -fold nested CV for the late PD. The early PD signature consists of 77 probesets, mapped on 70 genes, and associated to accuracy. The late stage signature is composed of 94 probesets corresponding to 90 genes and achieving accuracy.
| \toprule | Pathway Code | Gene Symbol | |
| \midrulePD early | GO:0005506 | 0.38 | HBB |
| GO:0006952 | 0.37 | DEFA1/DEFA3 | |
| GO:0045087 | 0.36 | ||
| GO:0042802 | 0.33 | SYT1 | |
| GO:0042802 | 0.33 | HSPB1 | |
| GO:0006955 | 0.31 | DEFA1/DEFA3 | |
| GO:0006950 | 0.28 | HSPB1 | |
| GO:0020037 | 0.26 | HBB | |
| GO:0005938 | 0.26 | MYH10 | |
| GO:0005856 | 0.24 | VCL | |
| GO:0005856 | 0.24 | HSPB1 | |
| GO:0003779 | 0.23 | MYH10, VCL | |
| GO:0030097 | 0.15 | ||
| GO:0009615 | 0.14 | ||
| GO:0009615 | 0.14 | DEFA1/DEFA3 | |
| GO:0051707 | 0.00 | ||
| \midrulePD late | GO:0019226 | 0.31 | |
| GO:0007611 | 0.16 | ||
| GO:0042493 | 0.15 | ||
| GO:0009725 | 0.11 | ||
| GO:0030424 | 0.10 | MYH10 | |
| GO:0007267 | 0.09 | TAC1 | |
| GO:0005516 | 0.09 | MYH10, SYT1, RGS4 | |
| GO:0005096 | 0.09 | RGS4 | |
| GO:0007610 | 0.08 | ||
| GO:0003779 | 0.08 | MYH10, VCL | |
| GO:0005624 | 0.08 | SLC18A2 | |
| GO:0045202 | 0.08 | SYT1 | |
| GO:0003924 | 0.07 | CDC42 | |
| GO:0006928 | 0.07 | HSBP1, VCL | |
| GO:0042995 | 0.07 | CDC42 | |
| GO:0007268 | 0.06 | TAC1, SYT1 | |
| GO:0043234 | 0.06 | VCL | |
| GO:0005525 | 0.05 | CDC42 | |
| GO:0006412 | 0.05 | RPS4Y | |
| GO:0006836 | 0.05 | SLC18A2, SLC6A3 | |
| GO:0043005 | 0.05 | MYH10, SYT1 | |
| GO:0043025 | 0.04 | MYH10 | |
| GO:0042221 | 0.00 | ||
| GO:0009266 | 0.00 | ||
| GO:0014070 | 0.00 | ||
| \botrule |
Applying ARACNE, we constructed the relevance network for both cases and controls for the 35 enriched pathways for late stage PD case and 42 pathways for early stage PD. Table 2 reports the most biologically relevant pathways, ranked for decreasing normalized Ipsen-Mikhailov distance . The full list of the analyzed pathways is provided as Appendix Table 10.2.2.
Having characterized the functional alteration of pathways for both early and late stage PD, we attempt a comparative analysis of the outcome, commenting the most meaningful results from the biological viewpoint. We expected some common pathways between the two stages, especially within pathways that represent general processes and functions, but as commented in Section 6 the pipeline does not consider pathways having more that 1000 nodes, hence discarding the general terms in the GO. Indeed, the only common pathway is GO:0003779, i.e. actin binding. Actin participates in many important cellular processes, including muscle contraction, cell motility, cell division and cytokinesis, vescicle and organelle movement, cell signaling. Clearly, this term is strictly associated to the most evident movement-related symptoms in PD, including shaking, rigidity, slowness of movement and difficulty with walking and gait.
In both early and late PD we note some alteration within the biological process class of response to stimulus. In the early PD list we identified GO:0006950 i.e. response to stress, GO:0009615 i.e. response to virus and GO:0051707 i.e. response to other organism. In the late PD list we found GO:0042493, i.e. response to drug, GO:0009725 i.e. response to hormone stimulus, GO:0042221 i.e. response to chemical stimulus, GO:0014070 i.e. response to organic cyclic substance and GO:0009266 response to temperature stimulus.
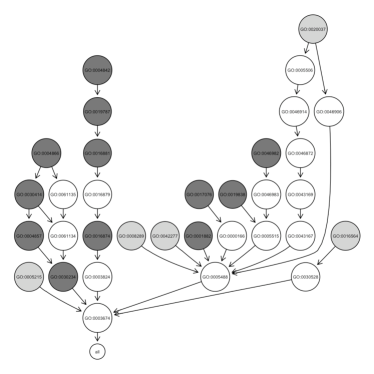
The pathways specific to early PD show a great involvement of the immune system, which is greatly stimulated by inflammation especially located in particular brain regions (mainly substantia nigra). Indeed, we identified: GO:0006952 i.e. defense response, GO:0045087 i.e. innate immuno response also visualized in Figure 3, GO:0006955 i.e. immune response and GO:0030097 i.e. hemopoiesis.
 |
 |
| (a) early PD patients | (b) controls |
From Figure 3 it is clear that since the early stages of PD the innate immune system is severly compromised: the body is highly subjected to the invasion and proliferation of microbes (like bacteria or viruses), resulting in a debilitated organism, less effective in fighting the consequent inflammation.
In late stage PD, we detected several differentiated terms related to the Central Nervous System. Among others, we mention: GO:0019226 i.e. transmission of nerve impulse, GO:0007611 i.e. learning or memory, GO:0007610 i.e. behavior and GO:007268 i.e. synaptic transmission. These findings are fitting the late stage PD scenario, where cognitive and behavioral problems may arise with dementia.
Table 2, and Appendix Table 10.2.2 and 10.2.2 report the genes belonging to the most relevant pathways for early and late PD, respectively.
Four common genes were identified between early and late stage PD: MYH10, SYT1, VCL and HSPB1. MYH10 is involved in several pathways: acting binding and calmodulin binding, neural cell body, neuron projection and cell cortex. These pathways indicate that the damage mostly occurs in the neurons and especially the actin binding and the cell cortex affect the cytoskeleton and the muscular tissue. At the same time, the calmodulin binding pathway indicates that other preprocesses, related to calmodulin and relevant for PD, might be damaged. These processes are related to the inflammation, metabolism, apoptosis, smooth muscle contraction, intracellular movement, short-term, long-term memory, nerve growth and the immune response. Moreover, it is known that MYH10 is involved in the regulation of the actin cytoskeleton pathways but also in that ones related to the axon guidance. Mutations in this gene are known to be present in disease phenotypes affecting the heart and the brain (Kim et al. (2005)). The synaptotagmin SYT1, also involved in the calmoduling binding, is an integral membrane protein of synaptic vesicles thought to serve as Ca(2+) sensor in the process of vesicular trafficking and exocytosis. Calcium binding to SYT1 participates in triggering neurotransmitter release at the synapse. This protein is therefore involved in the synaptic transmission and it predominantly works in the neuron projections and synapses. Vinculin (VCL) is a cytoskeletal protein associated with cell-cell and cell-matrix junctions, where it is thought to function as one of several interacting proteins involved in anchoring F-actin to the membrane. Defects in VCL are the cause of cardiomyopathy dilated type 1W. This protein is involved in cell motility, proliferation and differentiation but also in smooth muscle contraction, inflammation and immune surveillance. VCL is located on a locus of chromosome 10 strongly associated with late onset AD (Grupe et al. (2006)). HSPB1 is a heat shock protein induced by environmental stress and developmental changes. The encoded protein is involved in stress resistance and actin organization and translocates from the cytoplasm to the nucleus upon stress induction. This translocation occurs in order to modulate SP1-dependent transcriptional activity to promote neuronal protection (Friedman et al. (2009)). Furthermore, defects in this gene cause two neurophatic diseases (i.e. Charcot-Marie-Tooth disease type 2F and distal hereditary motor neuropathy).
Beside the common genes, early stage PD is characterized by several meaningful genes. HBB encodes for hemoglobin beta that, together with another hemoglobin beta and two hemoglobin alpha, forms the adult hemoglobin. The work of Atamna and Boyle (2006) shows that the binding of Abeta to the heme group (hemoglobins bond to iron) supports a unifying mechanism by which excessive Amyloid-beta (Abeta) induces heme deficiency, causes oxidative damage to macromolecules, and depletes specific neurotransmitters. Althought Abeta is a known marker for AD, a recent publication also places it within a panel of PD biomarkers (Shi et al. (2011)). DEFA1 and DEFA3 are both defensins, a family of microbicidal and cytotoxic peptides thought to be involved in host defense. They are abundant in the granules of neutrophils and also found in the epithelia of mucosal surfaces such as those of the intestine, respiratory tract, urinary tract, and vagina. Recently, Andrianov et al. (2007) presented some evidence for the recruitment of defensins in communication between the immune and nervous systems in the frog.
Among the genes specific to the late PD, we note CDC42, a GTPase of the Rho-subfamily, which regulates signaling pathways controlling diverse cellular functions including cell morphology, migration, endocytosis and cell cycle progression. Through the interaction with other proteins, CDC42 is known to regulate actin polymerization constituent both of the cytoskeleton and of the muscle cells. SLC6A3 is a dopamine transporter which is a member of the sodium- and chloride-dependent neurotransmitter transporter family. This gene is associated with Parkinsonism-dystonia infantile (Kurian et al. (2009)). Other significant genes within Table 2 are: TAC1, RGS4, SLC18A2 and RPS4Y.
8.3 Alzheimer’s Disease Experiment
Classification and feature selection via , performed within a 9-fold nested CV schema for AD early and 8-fold for AD late, gives respectively 90% accuracy and 95% with 50 probesets for both cases.
 |
 |
| (a) early AD patients | (b) controls |
We apply in the AD case the same network analysis strategy as in the PD experiment inferring for both cases and controls 51 selected pathways for early stage AD and 34 for late stage AD. The full list of reconstructed pathways is reported in Table 10.2.3. In Table 3 we summarize the main findings discussed hereafter.
Similarly to the PD analysis, we attempt a comparative analysis of the outcome for early and late stage AD having characterized the functional alteration of pathways for the two AD stages and comment the most meaningful results from the biological viewpoint.
| \toprule | Pathway Code | Gene Symbol | |
| \midruleAD early | GO:0042598 | 0.21 | |
| GO:0019787 | 0.16 | UBE2D3 | |
| GO:0007417 | 0.10 | MPB | |
| GO:0001508 | 0.14 | ||
| GO:0051246 | 0.15 | UBE2D3 | |
| GO:0016874 | 0.12 | UBE2D3 | |
| GO:0004842 | 0.11 | UBE2D3 | |
| GO:0005768 | 0.08 | EGFR | |
| GO:0016567 | 0.07 | UBE2D3 | |
| GO:0050877 | 0.06 | ||
| GO:0042552 | 0.05 | ||
| GO:0008015 | 0.04 | ||
| GO:0042391 | 0.04 | ||
| GO:0007399 | 0.04 | NTRK2 | |
| GO:0046982 | 0.03 | EGFR | |
| GO:0006633 | 0.02 | PTGDS | |
| GO:0019226 | 0.00 | ||
| GO:0000267 | 0.00 | ||
| \midruleAD late | GO:0040012 | 0.36 | SNCA |
| GO:0042598 | 0.23 | ||
| GO:0019226 | 0.12 | ||
| GO:0030334 | 0.10 | ||
| GO:0045892 | 0.09 | SPEN | |
| GO:0042493 | 0.06 | SNCA | |
| GO:0042127 | 0.05 | ||
| GO:0008283 | 0.04 | CAT | |
| GO:0005215 | 0.03 | XK | |
| GO:0008217 | 0.03 | HBD | |
| GO:0007601 | 0.03 | ||
| GO:0007268 | 0.03 | ||
| GO:0007610 | 0.03 | ||
| GO:0008289 | 0.03 | ||
| GO:0008015 | 0.02 | ||
| GO:0016564 | 0.02 | SPEN, ATXN1 | |
| GO:0008284 | 0.02 | ||
| GO:0008285 | 0.02 | EIF2AK1 | |
| GO:0020037 | 0.02 | EIF2AK1, CAT, HBD | |
| GO:0000267 | 0.00 | ||
| GO:0050890 | 0.00 | ||
| \botrule |
Four common pathways were identified: GO:0019226 i.e. transmission of nerve impulse, GO:0008015 i.e. blood circulation, GO:0000267 i.e. cell fraction and GO:0042598 i.e. vesicular fraction.
The majority of pathways characterizing early stages of AD are related to the nervous system, and the blood. Among the nervous system related pathways the most damaged are: GO:0007399 i.e. nervous system development, GO:0007417 i.e. central nervous system development, GO:0042391 i.e. regulation of membrane potential, GO:0042552 i.e. myelination, GO:0050877 i.e. neurological system process, GO:0001508 i.e. regulation of action potential and GO:0019226 i.e. transmission of nerve impulse.
The majority of the pathways characterizing late stage AD are related to the cell, to the nervous system and to the response of the organism to various stimuli, see Table 3 and 10.2.3. Among the pathways centered on the cell, mentioned in descending order based on the numerosity of the genes, there are: GO:0008283 i.e. cell proliferation, GO:0008283 i.e. negative regulation of cell proliferation, GO:0008284 i.e. positive regulation of cell proliferation, GO:0042127 i.e. regulation of cell proliferation, GO:0030334 i.e. regulation of cell migration. The pathways related to the nervous system are: GO:0007268 i.e. synaptic transmission, GO:0007610 i.e. behavior, GO:0050890 i.e. cognition. Other relevant nodes are those related to the transcription regulation (GO:0016564, GO:0045892), the visual perception (GO:0007601), and the heme and lipid binding (i.e. GO:0020037, GO:0008289).
The genes characterizing the early stage AD are reported in Table 3 and 10.2.3. UBE2D3 is an ubiquitin, targeting abnormal or short-lived proteins for degradation. It is a member of the E2 ubiquitin-conjugating enzyme family. This enzyme functions in the ubiquitination of the tumor-suppressor protein p53. It is also involved in several signaling pathways (BMP, TGF-, TNF-/NF-kB and in the immune system), in the protein processing in the endoplasmatic reticulum. PTGDS is an enzyme that catalyzes the conversion of prostaglandin H2 (PGH2) to postaglandin D2 (PGD2). It functions as a neuromodulator as well as a trophic factor in the central nervous system and it is also involved in smooth muscle contraction/relaxation and is a potent inhibitor of platelet aggregation. This gene is preferentially expressed in brain. Quantifying the protein complex of PGD2 and TTR in CSF may be useful in the diagnosis of AD, possibly in the early stages of the disease (Lovell et al. (2008)). EGFR is a transmembrane glycoprotein that is a member of the protein kinase superfamily. This protein is a receptor for members of the epidermal growth factor family that binds to epidermal growth factor. Binding of the protein to a ligand induces receptor dimerization and tyrosine autophosphorylation and leads to cell proliferation. This gene is involved in several pathways related to signaling, some type of cancer, to the cell proliferation, migration and adhesion and to the axon guidance. It is expressed in pediatric brain tumors (Patereli et al. (2010)). NTRK2 is member of the neurotrophic tyrosine receptor kinase (NTRK) family. This kinase is a membrane-bound receptor that upon neurotrophin binding phosphorylates itself and members of the MAPK pathway. Signalling through this kinase leads to cell differentiation. Mutations in this gene have been associated with obesity and mood disorders. SNPs in this gene is associated with AD (Cozza et al. (2008)).
The genes associated to late stage AD are listed in Table 3 and 10.2.3. Even if SNCA is a known hallmark for PD, it also known to be expressed in late-onset familial AD (Tsuang et al. (2006)). Other relevant genes are: SPEN, EIF2AK1, CAT, HBD, ATXN1, XK. The first gene a hormone inducible transcriptional repressor. Repression of transcription by this gene product can occur through interactions with other repressors by the recruitment of proteins involved in histone deacetylation or through sequestration of transcriptional activators. SPEN is involved in the Notch signaling pathway that is important for cell-dell communication since it involves gene regulation mechanisms that control multiple cell differentiation processes (i.e. neuronal function and development, stabilization of arterial endothelial fate and angiogenesis, cardiac valve homeostasis) during embryonic and adult life. EIF2AK1 acts at the level of translation initiation to downregulate protein synthesis in response to stress, therefore it seems to have a protective role diminishing the overproduction of proteins such as SNCA or beta amyloid. CAT encodes for catalase a key antioxidant enzyme in the bodies defense against oxidative stress, therefore it act against the oxidative stress present in the brain of AD patients. This gene together with EIF2AK1 seems to fight against the disease. HBD like, HBB commented in subsection 8.2, could display the same role (Atamna and Boyle (2006)). ATXN1 i s involved in the autosomal dominant cerebellar ataxias (ADCA), an heterogeneous group of neurodegenerative disorders characterized by progressive degeneration of the cerebellum brain stem and spinal cord. Therefore, because of specific characteristics of these diseases (like the affected brain areas and the characteristics of the movement disorders), it might as well play a role in AD. Finally, mutations of XK have been associated with McLeod syndrome an X-linked recessive disorder characterized by abnormalities in the neuromuscular and hematopoietic systems.
9 Conclusion
The theory of complex networks has recently proven to be a helpful tool for a systematic and structural knowledge of the cell mechanisms. Here we propose to enhance its capabilities by coupling it with a machine learning driven approach aimed at moving from a global to a local interaction scales, that is, focussing on pathways which are most likely to change, for instance within particular pathological stages. Such strategy is also better tailored to deal with situations where small sample size may affect the reliability of the network inference on a global scale. The method, demonstrated on three disease datasets of environmental pollution, PD and AD, was able to detect biologically meaningful differential pathways.
10 Appendix
10.1 Experimental setup for the examples
The presented analysis pipeline is independent from the single algorithms chosen for each step of the workflow. Here we give some details about the methods used for the experiments described in Section 8.
10.1.1 Spectral Regression Discriminant Analysis (SRDA).
SRDA belongs to the Discriminant Analysis algorithms family (Cai et al. (2008)). Its peculiarity is to exploit the regression framework for improving the computational efficiency. Spectral graph analysis is used for solving only a set of regularized least squares problems avoiding the eigenvector computation. A score is assigned to each feature and can be interpreted as a feature weight, allowing directly feature ranking and selection. The regularization value is the only parameter needed to be tuned. The method is implemented in Python and it is available within the mlpy library 111\hrefhttp://mlpy.fbk.eu/http://mlpy.fbk.eu/.
10.1.2 The feature selection framework (FS).
FS with double optimization is a feature selection method that can be tuned to give a minimal set of discriminative genes or larger sets including correlated genes (Zou and Hastie (2005); De Mol et al. (2009)). The objective function is a linear model , whose sign gives the classification rule that can be used to associate a new sample to one of the two classes. The sparse weight vector is found by minimizing the functional: where the least square error is penalized with the and norm of the coefficient vector . The training for selection and classification requires a careful choice of the regularization parameters for both and RLS. Indeed, model selection and statistical significance assessment is performed within two nested -cross validation loops as in Fardin et al. (2009). The framework is implemented in Python and uses the L1L2Py library222\hrefhttp://slipguru.disi.unige.it/Research/L1L2Pyhttp://slipguru.disi.unige.it/Research/L1L2Py.
10.1.3 Functional Characterization.
The Gene Set Enrichment Analysis (GSEA) was performed by using WebGestalt, an online toolkit333\hrefhttp://bioinfo.vanderbilt.edu/webgestalt/http://bioinfo.vanderbilt.edu/webgestalt/ (Zhang et al. (2005b)). This web-service takes as input a list of relevant genes/probesets and performs a GSEA analysis (Subramanian et al. (2005)) in Kyoto Encyclopedia of Genes and Genomes (KEGG, Kanehisa and Goto (2000)) and Gene Ontology (GO, Ashburner et al. (2000)), identifying the most relevant pathways and ontologies in the signatures. Both for KEGG and GO we selected the WebGestalt human genome as reference set, as level of significance, as the minimum number of genes and the default Hypergeometric test as statistical method.
10.1.4 Weighted Gene Co-Expression Networks (WGCN).
WGCN networks are based on the idea of using (a function of) the absolute correlation between the expression of a couple of genes across the samples to define a link between them. Soft thresholding techniques are then employed to obtain a binary adjacency matrix, where a suitable biologically motivated criterion (such as the scale-free topology, or some other prior knowledge) can be adopted (Zhang and Horvath (2005); Zhao et al. (2010)). Due to the very small sample size, scale-freeness can not be considered as a reliable criterion for threshold selection so we adopted a different heuristics: for both networks in the two classes the selected threshold is the one maximising the average Ipsen-Mikhailov distance on the selected pathways.
10.1.5 Algorithm for the Reconstruction of Accurate Cellular Networks (ARACNE).
ARACNE is a recent method for inferring networks from the transcription level (Margolin et al. (2006)) to the metabolic level (Nemenman et al. (2007)). Beside it was originally designed for handling the complexity of regulatory networks in mammalian cells, it is able to address a wider range of network deconvolution problems. This information-theoretic algorithm removes the vast majority of indirect candidate interactions inferred by co-expression methods by using the data processing inequality property (Cover and Thomas (1991)). In this work we use the MiNET (Mutual Information NETworks) Bioconductor package keeping the default value for the data processing inequality tolerance parameter (Meyer et al. (2008)). The adopted threshold criterion is the same as the one applied for WGCN.
10.1.6 Ipsen-Mikhailov distance .
Although already fruitfully used even in a biological context (Sharan and Ideker (2006)), the problem of quantitatively comparing network (e.g. using a metric instead of evaluating network properties) is a widely open issue affecting many scientific disciplines. As discussed in (Jurman et al. (2011)), many classical distances (such as those of the edit family) have a relevant drawback in being local, that is focussing only on the portions of the network interested by the differences in the presence/absence of matching links. More recently, other metrics can overcome this problem so to consider the global structure of the compared topologies; among such distances, the spectral ones - based on the list of eigenvalues of the laplacian matrix of the underlying graph - are quite interesting, and, in particular, the Ipsen-Mikhailov (Ipsen and Mikhailov (2002)) distance has been proven to be the most robust in a wide range of situations.
The definition of the metric follows the dynamical interpretation of a -nodes network as a -atoms molecules connected by identical elastic strings, where the pattern of connections is defined by the adjacency matrix of the corresponding network (Ipsen and Mikhailov (2002)). The vibrational frequencies of the dynamical system are given by the eigenvalues of the Laplacian matrix of the network: , with . The spectral density for a graph as the sum of Lorentz distributions is defined as , where is the common width444 specifies the half-width at half-maximum (HWHM), equal to half the interquartile range. and is the normalization constant solution of . Then the spectral distance between two graphs and with densities and can then be defined as To get a meaningful comparison of the value of on pairs of networks with different number of nodes, we define the normalized version , where , indicate respectively the empty and the fully connected network on nodes: they are the two most -distant networks for each . The common width is set to as in the original reference: being a multiplicative factor, it has no impact on comparing different values of the Ipsen-Mikhailov distance. The network analysis phase is implemented in R through the igraph package.
10.2 Experiments
10.2.1 Air Pollution Experiment
Table 4 lists the 11 enriched pathways identified during the analysis of the air pollution dataset and the total number of the genes belonging to each pathway. The list is ranked by the normalized Ipsen-Mikhailov distance (see Section 10.1.6): the top elements of the list are the most disrupted pathways between the two conditions. The pathways listed in Table 1 are a subset of those reported in Table 4.
Most of these pathways concern the developmental processes: this GO class contains ontologies especially related to the development of skeletal and nervous systems (GO:0001501 and GO:0007399) that undergo a rapid and constant growth in children. Other enriched terms are related to the capacity of an organism to defend itself (i.e response to wounding, GO:0009611 and inflammatory response, GO:0006954), to the regulation of the cell death (i.e. negative regulation of apoptosis, GO:0043066), the multicellular organismal process, GO:0032501, the glycerlolipid metabolic process, GO:0046486, the response to external stimuli (i.e. inflammatory response, response to wounding) and to the locomotion (i.e. GO:0040011, GO:0007626).
| \toprulePathway | # Genes | |
| \midruleGO:0043066 | 0.257 | 21 |
| GO:0001501 | 0.149 | 89 |
| GO:0009611 | 0.123 | 16 |
| GO:0007399 | 0.093 | 252 |
| GO:0016787 | 0.078 | 718 |
| GO:0005516 | 0.076 | 116 |
| GO:0007275 | 0.076 | 453 |
| GO:0006954 | 0.048 | 180 |
| GO:0005615 | 0.038 | 417 |
| GO:0007626 | 0.000 | 5 |
| GO:0006066 | 0.000 | 8 |
| \botrule |
Table 10.2.1 provides the subset of Agilent probesets (together with their corresponding Gene Symbol and GO pathway) belonging to the signature and having a non zero value of the differential node degree . Since the score is computed as the difference between the weighted degree in the two classes, the top elements in Table 10.2.1 are those whose number of interactions varies most between the two conditions.
| \toprule Agilent ID | Gene Symbol | Pathway | |
| \midrule4701 | NRGN | GO:0007399 | -2.477 |
| 12235 | DUSP15 | GO:0016787 | -1.586 |
| 8944 | CLC | GO:0016787 | -1.453 |
| 3697 | ITGB5 | GO:0007275 | -1.390 |
| 4701 | NRGN | GO:0005516 | -1.357 |
| 12537 | PROK2 | GO:0006954 | 1.069 |
| 13835 | OLIG1 | GO:0007275 | 0.834 |
| 11673 | HOXB8 | GO:0007275 | -0.750 |
| 16424 | FKHL18 | GO:0007275 | -0.685 |
| 13094 | DHX32 | GO:0016787 | -0.575 |
| 8944 | CLC | GO:0007275 | 0.561 |
| 14787 | MATN3 | GO:0001501 | 0.495 |
| 15797 | CXCL1 | GO:0006954 | 0.467 |
| 15797 | CXCL1 | GO:0005615 | 0.338 |
| 11302 | MYH1 | GO:0005516 | -0.194 |
| 15797 | CXCL1 | GO:0007399 | 0.131 |
| \botrule |
10.2.2 Parkinson’s Disease Experiment
Table 10.2.2 reports the list of the pathways selected by the presented approach both for the early and late PD case, ranked by the normalized distance . Some of these pathways are also reported in Table 2.
| \toprule PD early | PD late | ||||
|---|---|---|---|---|---|
| Pathway | # Genes | Pathway | # Genes | ||
| \midruleGO:0012501 | 0.49 | 4 | GO:0019226 | 0.31 | 20 |
| GO:0005764 | 0.39 | 257 | GO:0010033 | 0.20 | 30 |
| GO:0019901 | 0.38 | 116 | GO:0007611 | 0.16 | 34 |
| GO:0005506 | 0.38 | 434 | GO:0030234 | 0.15 | 20 |
| GO:0008219 | 0.38 | 110 | GO:0042493 | 0.15 | 109 |
| GO:0016323 | 0.37 | 111 | GO:0032403 | 0.12 | 14 |
| GO:0006952 | 0.37 | 160 | GO:0019717 | 0.12 | 79 |
| GO:0046983 | 0.36 | 153 | GO:0009725 | 0.11 | 27 |
| GO:0045087 | 0.36 | 112 | GO:0030424 | 0.10 | 93 |
| GO:0046914 | 0.35 | 51 | GO:0005096 | 0.09 | 252 |
| GO:0016265 | 0.33 | 6 | GO:0007267 | 0.09 | 264 |
| GO:0042802 | 0.33 | 473 | GO:0050790 | 0.09 | 15 |
| GO:0042803 | 0.32 | 411 | GO:0019001 | 0.09 | 34 |
| GO:0050896 | 0.31 | 213 | GO:0017111 | 0.09 | 157 |
| GO:0006955 | 0.31 | 778 | GO:0007585 | 0.09 | 47 |
| GO:0006915 | 0.31 | 687 | GO:0005516 | 0.09 | 215 |
| GO:0042981 | 0.30 | 206 | GO:0005626 | 0.09 | 41 |
| GO:0030218 | 0.29 | 33 | GO:0045202 | 0.08 | 278 |
| GO:0006950 | 0.28 | 253 | GO:0007610 | 0.08 | 40 |
| GO:0020037 | 0.26 | 176 | GO:0005624 | 0.08 | 616 |
| GO:0005938 | 0.26 | 50 | GO:0043087 | 0.08 | 22 |
| GO:0005856 | 0.24 | 816 | GO:0003779 | 0.08 | 423 |
| GO:0016567 | 0.23 | 103 | GO:0008047 | 0.07 | 60 |
| GO:0003779 | 0.23 | 431 | GO:0042995 | 0.07 | 231 |
| GO:0042592 | 0.22 | 9 | GO:0006928 | 0.07 | 166 |
| GO:0051607 | 0.21 | 26 | GO:0003924 | 0.07 | 294 |
| GO:0016564 | 0.18 | 229 | GO:0007568 | 0.06 | 35 |
| GO:0005200 | 0.16 | 127 | GO:0043234 | 0.06 | 233 |
| GO:0030097 | 0.15 | 76 | GO:0007268 | 0.06 | 201 |
| GO:0009615 | 0.14 | 111 | GO:0030030 | 0.05 | 27 |
| GO:0008092 | 0.12 | 77 | GO:0005525 | 0.05 | 450 |
| GO:0030099 | 0.07 | 19 | GO:0006412 | 0.05 | 466 |
| GO:0019900 | 0.04 | 32 | GO:0043005 | 0.05 | 51 |
| GO:0034101 | 0.00 | 8 | GO:0006836 | 0.05 | 42 |
| GO:0051707 | 0.00 | 5 | GO:0043025 | 0.04 | 82 |
| GO:0042221 | 0.00 | 16 | |||
| GO:0009266 | 0.00 | 6 | |||
| GO:0014070 | 0.00 | 13 | |||
| GO:0046578 | 0.00 | 8 | |||
| GO:0050804 | 0.00 | 11 | |||
| GO:0017076 | 0.00 | 7 | |||
| \botrule | |||||
The only common pathway between early and late stage PD is actin binding (GO:0003779), as commented in Section 8.2. The specific ones for the early stage PD concern the immune system (i.e. GO:0045087, GO:0006955), the response to stimulus (i.e. stress or other organism like virus, GO:0006950, GO:0009615), the regulation of metabolic processes, the biological quality and cell death. The specific pathways for late stage are related to the nervous system (e.g. neurotransmitter transport, transmission of nerve impulse, learning or memory, GO:0006836, GO:0019226) and to response to stimuli (e.g. behavior, temperature, organic substances, drugs or endogenous stimuli).
Figure 5 visualizes the enriched pathways in the Molecular Function and Biological Process domains. Despite only one pathway was found as common between early and late AD, it is easy to note that the majority of selected pathways belong to common GO classes.
 |
 |
| (a) MF | (b) BP |
Tables 10.2.2 and 10.2.2 list respectively the subset of elements of the early PD signature and late PD signature having non zero differential node degree . We recall here that the top elements in the two tables are those whose number of interactions varies most between the two case/control conditions.
| \toprule Affy Probeset ID | Gene Symbol | Pathway | |
| \midrule200931_s_at | VCL | GO:0005856 | -2.124 |
| 200931_s_at | VCL | GO:0003779 | -2.107 |
| 213067_at | MYH10 | GO:0003779 | 1.879 |
| 202887_s_at | DDIT4 | GO:0006915 | -1.872 |
| 201841_s_at | HSPB1 | GO:0042802 | -1.691 |
| 204439_at | IFI44L | GO:0006955 | -1.585 |
| 201841_s_at | HSPB1 | GO:0005856 | -1.532 |
| 209480_at | HLA-DQB1 | GO:0006955 | -1.340 |
| 209116_x_at | HBB | GO:0005506 | -1.008 |
| 203998_s_at | SYT1 | GO:0042802 | 0.862 |
| 36711_at | MAFF | GO:0006950 | -0.807 |
| 209116_x_at | HBB | GO:0020037 | -0.599 |
| 36711_at | MAFF | GO:0046983 | 0.567 |
| 214414_x_at | HBA1/HBA2 | GO:0020037 | -0.376 |
| 205033_s_at | DEFA1/DEFA3 | GO:0009615 | -0.360 |
| 217232_x_at | HBB | GO:0005506 | -0.239 |
| 205033_s_at | DEFA1/DEFA3 | GO:0006955 | -0.228 |
| 213067_at | MYH10 | GO:0005938 | 0.183 |
| 214414_x_at | HBA1/HBA2 | GO:0005506 | -0.182 |
| 201841_s_at | HSPB1 | GO:0006950 | -0.154 |
| 217232_x_at | HBB | GO:0020037 | -0.088 |
| 218197_s_at | OXR1 | GO:0006950 | -0.059 |
| 205033_s_at | DEFA1/DEFA3 | GO:0006952 | 0.027 |
| \botrule |
In Table 10.2.2, we note that the most disrupted genes for early PD (IFI44L, HSPB1, MAFF, DEFA1/DEFA3, OXR1) belong to pathways related to response to stress and to virus. Moreover, several genes (HLA-DQB1, HBB, HBA1/HBA2, DEFA1/DEFA3) are related to the following pathways: heme binding, iron ion binding and immune response.
In Table 10.2.2 the majority of disrupted genes for late PD (RGS4, CDC42, RABGAPIL) occur in pathways that are related to GTP, a purine nucleotide that can function either as source of energy for protein synthesis and in the signal transduction particularly with G-proteins. Other genes in the list (MYH10, RGS4, PHACTR1, SYT1, VCL) are related to the acting and calmodulin binding, to the synaptic transmission, the neurotransmitter transport, the cell-cell signaling, the translation and the cellular component movement. The majority of the disrupted pathways are located in several components of the neurons.
| \toprule Affy Probeset ID | Entrez Gene Symbol | Pathway | |
| \midrule213638_at | PHACTR1 | GO:0045202 | -3.255 |
| 213067_at | MYH10 | GO:0003779 | -3.252 |
| 213067_at | MYH10 | GO:0005516 | -2.597 |
| 204337_at | RGS4 | GO:0005096 | -2.194 |
| 213067_at | MYH10 | GO:0043025 | -2.107 |
| 213067_at | MYH10 | GO:0043005 | -1.696 |
| 214230_at | CDC42 | GO:0003924 | 1.677 |
| 213638_at | PHACTR1 | GO:0003779 | -1.587 |
| 213067_at | MYH10 | GO:0030424 | -1.170 |
| 205857_at | SLC18A2 | GO:0006836 | -1.094 |
| 206552_s_at | TAC1 | GO:0007268 | -0.834 |
| 206552_s_at | TAC1 | GO:0007267 | 0.809 |
| 205110_s_at | FGF13 | GO:0007267 | -0.804 |
| 203998_s_at | SYT1 | GO:0005516 | -0.787 |
| 208319_s_at | RBM3 | GO:0006412 | -0.759 |
| 201909_at | RPS4Y | GO:0006412 | -0.688 |
| 200931_s_at | VCL | GO:0043234 | -0.655 |
| 204337_at | RGS4 | GO:0005516 | -0.602 |
| 205105_at | MAN2A1 | GO:0007585 | -0.502 |
| 205857_at | SLC18A2 | GO:0005624 | -0.428 |
| 201841_s_at | HSPB1 | GO:0006928 | 0.424 |
| 214230_at | CDC42 | GO:0042995 | -0.379 |
| 214230_at | CDC42 | GO:0005525 | 0.370 |
| 203998_s_at | SYT1 | GO:0043005 | -0.357 |
| 203998_s_at | SYT1 | GO:0045202 | -0.339 |
| 200931_s_at | VCL | GO:0003779 | -0.311 |
| 200931_s_at | VCL | GO:0006928 | -0.308 |
| 206836_at | SLC6A3 | GO:0006836 | -0.238 |
| 215342_s_at | RABGAP1L | GO:0005096 | -0.211 |
| 211727_s_at | COX11 | GO:0007585 | 0.188 |
| 203998_s_at | SYT1 | GO:0007268 | -0.159 |
| \botrule |
10.2.3 Alzheimer’s Disease Experiment
Table 10.2.3 reports the most discriminant pathways for the two AD stages as selected by the presented pipeline, ranked by decreasing normalized distance. Table 3 summarizes the main results here detailed in Table 10.2.3, 10.2.3 and 10.2.3.
| \toprule AD early | AD late | ||||
| Pathway | # Genes | Pathway | # Genes | ||
| \midruleGO:0048514 | 0.22 | 22 | GO:0040012 | 0.36 | 9 |
| GO:0042598 | 0.21 | 16 | GO:0042598 | 0.23 | 16 |
| GO:0016881 | 0.19 | 109 | GO:0019226 | 0.12 | 27 |
| GO:0019787 | 0.16 | 116 | GO:0030334 | 0.10 | 93 |
| GO:0019725 | 0.16 | 14 | GO:0045892 | 0.09 | 218 |
| GO:0051246 | 0.15 | 121 | GO:0009968 | 0.06 | 107 |
| GO:0001508 | 0.14 | 31 | GO:0042493 | 0.06 | 160 |
| GO:0006631 | 0.14 | 171 | GO:0050877 | 0.06 | 31 |
| GO:0030234 | 0.13 | 29 | GO:0042127 | 0.05 | 140 |
| GO:0016874 | 0.12 | 735 | GO:0009725 | 0.05 | 47 |
| GO:0004842 | 0.11 | 368 | GO:0042277 | 0.05 | 63 |
| GO:0007417 | 0.10 | 199 | GO:0015630 | 0.05 | 99 |
| GO:0012505 | 0.10 | 216 | GO:0008283 | 0.04 | 785 |
| GO:0050880 | 0.09 | 26 | GO:0005819 | 0.04 | 142 |
| GO:0048471 | 0.08 | 263 | GO:0008217 | 0.03 | 106 |
| GO:0005792 | 0.08 | 409 | GO:0005626 | 0.03 | 68 |
| GO:0005768 | 0.08 | 490 | GO:0000165 | 0.03 | 94 |
| GO:0004857 | 0.08 | 57 | GO:0005215 | 0.03 | 685 |
| GO:0031982 | 0.07 | 34 | GO:0007268 | 0.03 | 377 |
| GO:0016567 | 0.07 | 206 | GO:0007601 | 0.03 | 402 |
| GO:0008217 | 0.07 | 105 | GO:0008289 | 0.03 | 285 |
| GO:0001666 | 0.07 | 225 | GO:0007610 | 0.03 | 84 |
| GO:0030141 | 0.06 | 69 | GO:0008284 | 0.02 | 507 |
| GO:0050877 | 0.06 | 31 | GO:0001503 | 0.02 | 171 |
| GO:0042552 | 0.05 | 36 | GO:0007243 | 0.02 | 220 |
| GO:0001568 | 0.05 | 79 | GO:0008285 | 0.02 | 578 |
| GO:0048511 | 0.04 | 49 | GO:0008015 | 0.02 | 103 |
| GO:0016023 | 0.04 | 108 | GO:0016564 | 0.02 | 380 |
| GO:0007399 | 0.04 | 806 | GO:0020037 | 0.02 | 265 |
| GO:0008015 | 0.04 | 103 | GO:0051270 | 0.00 | 9 |
| GO:0042391 | 0.04 | 67 | GO:0010033 | 0.00 | 44 |
| GO:0031410 | 0.03 | 482 | GO:0050890 | 0.00 | 31 |
| GO:0046982 | 0.03 | 364 | GO:0050953 | 0.00 | 24 |
| GO:0006633 | 0.02 | 109 | GO:0000267 | 0.00 | 5 |
| GO:0045121 | 0.02 | 136 | |||
| GO:0004866 | 0.02 | 194 | |||
| GO:0008366 | 0.00 | 22 | |||
| GO:0019228 | 0.00 | 19 | |||
| GO:0006873 | 0.00 | 10 | |||
| GO:0042592 | 0.00 | 25 | |||
| GO:0001974 | 0.00 | 28 | |||
| GO:0019226 | 0.00 | 27 | |||
| GO:0001944 | 0.00 | 4 | |||
| GO:0048771 | 0.00 | 12 | |||
| GO:0048856 | 0.00 | 20 | |||
| GO:0019838 | 0.00 | 85 | |||
| GO:0017076 | 0.00 | 11 | |||
| GO:0030414 | 0.00 | 42 | |||
| GO:0001882 | 0.00 | 8 | |||
| GO:0000267 | 0.00 | 4 | |||
| GO:0031090 | 0.00 | 6 | |||
| \botrule | |||||
The common pathways are: GO:0019226 i.e. transmission of nerve impulse, GO:0008015 i.e. blood circulation, GO:0000267 i.e. cell fraction and GO:0042598 i.e. vesicular fraction. The relevance of blood circulatory system in AD has already been highlighted in Brown and Thore (2011) and references therein.
Figure 6 visualizes the enriched pathways in the Molecular Function and Biological Process domains. Despite only 4 pathways were found as common between early and late AD, it is easy to note that the majority of selected pathways belong to common GO classes.
 |
 |
| (a) MF | (b) BP |
Tables 10.2.3 and 10.2.3 provide details of the network analysis results on early and late stage AD, respectively. The elements of the two signatures having non zero are listed for decreasing absolute value of the differential node degree score, thus giving top positions to genes that change most the interaction network between the case/control condition.
| \toprule Affy Probeset ID | Gene Symbol | Pathway | |
| \midrule209116_x_at | HBB | GO:0050880 | 1.670 |
| 209116_x_at | HBB | GO:0008217 | 1.445 |
| 211748_x_at | PTGDS | GO:0006633 | 1.273 |
| 240383_at | UBE2D3 | GO:0016874 | -1.165 |
| 240383_at | UBE2D3 | GO:0019787 | -0.703 |
| 201061_s_at | STOM | GO:0045121 | -0.662 |
| 240383_at | UBE2D3 | GO:0051246 | -0.613 |
| 201983_s_at | EGFR | GO:0046982 | -0.476 |
| 221795_at | NTRK2 | GO:0007399 | -0.262 |
| 212226_s_at | PPAP2B | GO:0001568 | 0.259 |
| 201983_s_at | EGFR | GO:0005768 | -0.256 |
| 211696_x_at | HBB | GO:0050880 | -0.224 |
| 209072_at | MBP | GO:0008366 | 0.166 |
| 211696_x_at | HBB | GO:0008217 | -0.149 |
| 212187_x_at | PTGDS | GO:0006633 | -0.139 |
| 201185_at | HTRA1 | GO:0019838 | 0.124 |
| 240383_at | UBE2D3 | GO:0004842 | 0.120 |
| 209072_at | MBP | GO:0007417 | 0.113 |
| 240383_at | UBE2D3 | GO:0016567 | -0.047 |
| \botrule |
Table 10.2.3 reports the most disrupted probesets within the early stage AD, ranked according to the differential node degree . We note that the most disrupted gene is HBB, within regulation of blood vessel size and regulation of blood vessels.
| \toprule Affy Probeset ID | Gene Symbol | Pathway | |
| \midrule201996_s_at | SPEN | GO:0016564 | 1.590 |
| 211546_x_at | SNCA | GO:0040012 | 1.410 |
| 211546_x_at | SNCA | GO:0042493 | 1.310 |
| 201996_s_at | SPEN | GO:0045892 | 1.246 |
| 217736_s_at | EIF2AK1 | GO:0020037 | -1.066 |
| 201005_at | CD9 | GO:0008285 | 0.725 |
| 210943_s_at | LYST | GO:0015630 | 0.706 |
| 204466_s_at | SNCA | GO:0042493 | 0.461 |
| 207827_x_at | SNCA | GO:0040012 | 0.434 |
| 206698_at | XK | GO:0005215 | 0.433 |
| 209184_s_at | IRS2 | GO:0008283 | 0.208 |
| 212420_at | ELF1 | GO:0016564 | -0.203 |
| 207827_x_at | SNCA | GO:0042493 | 0.201 |
| 205592_at | SLCA4A1 | GO:0005215 | 0.180 |
| 211922_s_at | CAT | GO:0008283 | 0.173 |
| 211922_s_at | CAT | GO:0020037 | -0.094 |
| 203231_s_at | ATXN1 | GO:0016564 | -0.073 |
| 217736_s_at | EIF2AK1 | GO:0008285 | -0.072 |
| 204466_s_at | SNCA | GO:0040012 | 0.048 |
| 206834_at | HBD | GO:0008217 | 0.045 |
| 206834_at | HBD | GO:0020037 | 0.019 |
| \botrule |
Table 10.2.3 reports the most disrupted genes within the late stage AD, ranked according to the differential node degree . The majority of such genes (SPEN, SNCA, EIF2AK1, ELF1, CAT, ATXN1, HBD) belong to regulation of locomotion, transcription repressor activity, response to drug and heme binding.
References
- Andrianov et al. (2007) Andrianov, G. N., Nozdrachev, A. D., and Ryzhova, I. V. (2007). The role of defensins in the excitability of the peripheral vestibular system in the frog: evidence for the presence of communication between the immune and nervous systems. Hear Res, 230(1-2), 1–8.
- Ashburner et al. (2000) Ashburner, M., Ball, C. A., Blake, J. A., Botstein, D., Butler, H., Cherry, J. M., Davis, A. P., K., D., Dwight, S. S., Eppig, J. T., Harris, M. A., Hill, D. P., Issel-Tarver, L., Kasarskis, A., Lewis, S., Matese, J. C., Richardson, J. E., Ringwald, M., Rubin, G. M., and Sherlock, G. (2000). Gene ontology: tool for the unification of biology. the gene ontology consortium. Nature Genetics, 25(1), 25–9.
- Atamna and Boyle (2006) Atamna, H. and Boyle, K. (2006). Amyloid-beta peptide binds with heme to form a peroxidase: relationship to the cytopathologies of Alzheimer’s disease. PNAS, 103(9), 3381–6.
- Barabasi et al. (2011) Barabasi, A. L., Gulbahce, N., and Loscalzo, J. (2011). Network medicine: a network-based approach to human disease. Nature Review Genetics, 12, 56–68.
- Baralla et al. (2009) Baralla, A., Mentzen, W., and de la Fuente, A. (2009). Inferring Gene Networks: Dream or Nightmare? Ann. N.Y. Acad. Sci., 1158, 246–256.
- Boccaletti et al. (2006) Boccaletti, S., Latora, V., Moreno, Y., Chavez, M., and Hwang, D.-U. (2006). Complex networks: Structure and dynamics. Physics Reports, 424(4–5), 175–308.
- Brown and Thore (2011) Brown, W. R. and Thore, C. R. (2011). Review: cerebral microvascular pathology in ageing and neurodegeneration. Neuropathol Appl Neurobiol, 37(1), 56–74.
- Buchanan et al. (2010) Buchanan, M., Caldarelli, G., De Los Rios, P., Rao, F., and Vendruscolo, M., editors (2010). Networks in Cell Biology. Cambridge University Press.
- Cai et al. (2008) Cai, D., He, X., and Han, J. (2008). Srda: An efficient algorithm for large-scale discriminant analysis. IEEE Transactions on Knowledge and Data Engineering, 20, 1–12.
- Cover and Thomas (1991) Cover, T. and Thomas, J. (1991). Elements of Information Theory. Wiley.
- Cozza et al. (2008) Cozza, A., Melissari, E., Iacopetti, P., Mariotti, V., Tedde, A., Nacmias, B., Conte, A., Sorbi, S., and Pellegrini, S. (2008). Snps in neurotrophin system genes and alzheimer’s disease in an italian population. J Alzheimers Dis, 15(1), 61–70.
- De Mol et al. (2009) De Mol, C., Mosci, S., Traskine, M., and Verri, A. (2009). A regularized method for selecting nested groups of relevant genes from microarray data. Journal of Computational Biology, 16, 1–15.
- De Smet and Marchal (2010) De Smet, R. and Marchal, K. (2010). Advantages and limitations of current network inference methods. Nature Review Microbiology, 8, 717–729.
- Fardin et al. (2009) Fardin, P., Barla, A., Mosci, S., Rosasco, L., Verri, A., and Varesio, L. (2009). The l1-l2 regularization framework unmasks the hypoxia signature hidden in the transcriptome of a set of heterogeneous neuroblastoma cell lines. BMC Genomics.
- Friedman et al. (2009) Friedman, M. J., Li, S., and Li, X.-J. (2009). Activation of gene transcription by heat shock protein 27 may contribute to its neuronal protection. J Biol Chem, 284(41), 27944–51.
- Grupe et al. (2006) Grupe, A., Li, Y., Rowland, C., Nowotny, P., Hinrichs, A. L., Smemo, S., Kauwe, J. S. K., Maxwell, T. J., Cherny, S., Doil, L., Tacey, K., van Luchene, R., Myers, A., Vrièze, F. W.-D., Kaleem, M., Hollingworth, P., Jehu, L., Foy, C., Archer, N., Hamilton, G., Holmans, P., Morris, C. M., Catanese, J., Sninsky, J., White, T. J., Powell, J., Hardy, J., O’Donovan, M., Lovestone, S., Jones, L., Morris, J. C., Thal, L., Owen, M., Williams, J., and Goate, A. (2006). A scan of chromosome 10 identifies a novel locus showing strong association with late-onset alzheimer disease. Am J Hum Genet, 78(1), 78–88.
- He et al. (2009) He, F., Balling, R., and Zeng, A.-P. (2009). Reverse engineering and verification of gene networks: Principles, assumptions, and limitations of present methods and future perspectives. J. Biotechnol., 144(3), 190–203.
- Ipsen and Mikhailov (2002) Ipsen, M. and Mikhailov, A. (2002). Evolutionary reconstruction of networks. Phys. Rev. E, 66(4), 046109.
- Jurman et al. (2011) Jurman, G., Visintainer, R., and Furlanello, C. (2011). An introduction to spectral distances in networks. In Proc. WIRN 2010, pages 227–234.
- Kanehisa and Goto (2000) Kanehisa, M. and Goto, S. (2000). KEGG: Kyoto Encyclopedia of Genes and Genomes. Nucleic Acids Res, 28(1), 27–30.
- Kim et al. (2005) Kim, K.-Y., Kovács, M., Kawamoto, S., Sellers, J. R., and Adelstein, R. S. (2005). Disease-associated mutations and alternative splicing alter the enzymatic and motile activity of nonmuscle myosins ii-b and ii-c. J Biol Chem, 280(24), 22769–75.
- Kurian et al. (2009) Kurian, M. A., Zhen, J., Cheng, S.-Y., Li, Y., Mordekar, S. R., Jardine, P., Morgan, N. V., Meyer, E., Tee, L., Pasha, S., Wassmer, E., Heales, S. J. R., Gissen, P., Reith, M. E. A., and Maher, E. R. (2009). Homozygous loss-of-function mutations in the gene encoding the dopamine transporter are associated with infantile parkinsonism-dystonia. J Clin Invest, 119(6), 1595–603.
- Liang et al. (2008) Liang, W., Reiman, E., Valla, J., Dunckley, T., Beach, T., Grover, A., Niedzielko, T., Schneider, L., Mastroeni, D., Caselli, R., Kukull, W., Morris, J., Hulette, C., Schmechel, D., Rogers, J., and Stephan, D. (2008). Alzheimer’s disease is associated with reduced expression of energy metabolism genes in posterior cingulate neurons. PNAS, 105, 4441–4446.
- Liang et al. (2010) Liang, W., Dunckley, T., Beach, T., Grover, A., Mastroeni, D., Ramsey, K., Caselli, R., Kukull, W., Mckeel, D., Morris, J., Hulette, C., Schmechel, D., Reiman, E., Rogers, J., and Stephan, D. (2010). Neuronal gene expression in non-demented individuals with intermediate alzheimer’s disease neuropathology. Neurobiol Aging, 31, 1–16.
- Lovell et al. (2008) Lovell, M. A., Lynn, B. C., Xiong, S., Quinn, J. F., Kaye, J., and Markesbery, W. R. (2008). An aberrant protein complex in csf as a biomarker of alzheimer disease. Neurology, 70(23), 2212–8.
- Marbach et al. (2010) Marbach, D., Prill, R., Schaffter, T., Mattiussi, C., Floreano, D., and Stolovitzky, G. (2010). Revealing strenghts and weaknesses of methods for gene network inference. PNAS, 107(14), 6286–6291.
- Margolin et al. (2006) Margolin, A., Nemenman, I., Basso, K., Wiggins, C., Stolovitzky, G., Dalla-Favera, R., and Califano, A. (2006). Aracne: an algorithm for the reconstruction of gene regulatory networks in a mammalian cellular context. BMC Bioinform., 7(7).
- Meyer et al. (2008) Meyer, P., Lafitte, F., and Bontempi, G. (2008). minet: A R/Bioconductor Package for Inferring Large Transcriptional Networks Using Mutual Information. BMC Bioinform., 9(1), 461.
- Nemenman et al. (2007) Nemenman, I., Escola, G., Hlavacek, W., Unkefer, P., Unkefer, C., and Wall, M. (2007). Reconstruction of Metabolic Networks from High-Throughput Metabolite Profiling Data. Ann. N.Y. Acad. Sci., 1115, 102–115.
- Newman (2003) Newman, M. (2003). The Structure and Function of Complex Networks. SIAM Review, 45, 167–256.
- Newman (2010) Newman, M. (2010). Networks: An Introduction. Oxford University Press.
- Patereli et al. (2010) Patereli, A., Alexiou, G. A., Stefanaki, K., Moschovi, M., Doussis-Anagnostopoulou, I., Prodromou, N., and Karentzou, O. (2010). Expression of epidermal growth factor receptor and her-2 in pediatric embryonal brain tumors. Pediatr Neurosurg, 46(3), 188–92.
- Scherzer et al. (2007) Scherzer, C., Eklund, A., Morse, L., and al. (2007). Molecular markers of early Parkinson’s disease based on gene expression in blood. PNAS.
- Sharan and Ideker (2006) Sharan, R. and Ideker, T. (2006). Modeling cellular machinery through biological network comparison. Nature Biotechnology, 24(4), 427–433.
- Shi et al. (2011) Shi, M., Bradner, J., Hancock, A. M., Chung, K. A., Quinn, J. F., Peskind, E. R., Galasko, D., Jankovic, J., Zabetian, C. P., Kim, H. M., Leverenz, J. B., Montine, T. J., Ginghina, C., Kang, U. J., Cain, K. C., Wang, Y., Aasly, J., Goldstein, D., and Zhang, J. (2011). Cerebrospinal fluid biomarkers for parkinson disease diagnosis and progression. Ann Neurol, 69(3), 570–80.
- Strogatz (2001) Strogatz, S. (2001). Exploring complex networks. Nature, 410, 268–276.
- Subramanian et al. (2005) Subramanian, A., Tamayo, P., Mootha, V. K., Mukherjee, S., Ebert, B. L., Gillette, M. A., Paulovich, A., Pomeroy, S. L., Golub, T. R., Lander, E. S., and Mesirov, J. P. (2005). Gene set enrichment analysis: A knowledge-based approach for interpreting genome-wide expression profiles. PNAS, 102(43), 15545–15550.
- The MicroArray Quality Control Consortium (2010) The MicroArray Quality Control Consortium, . (2010). The MAQC-II Project: A comprehensive study of common practices for the development and validation of microarray-based predictive models. Nature biotechnology, 28(8), 827–838.
- Tsuang et al. (2006) Tsuang, D. W., Riekse, R. G., Purganan, K. M., David, A. C., Montine, T. J., Schellenberg, G. D., Steinbart, E. J., Petrie, E. C., Bird, T. D., and Leverenz, J. B. (2006). Lewy body pathology in late-onset familial alzheimer’s disease: a clinicopathological case series. J Alzheimers Dis, 9(3), 235–42.
- van Leeuwen et al. (2006) van Leeuwen, D., van Herwijnen, M., Pedersen, M., Knudsen, L., Kirsch-Volders, M., Sram, R., Staal, Y., Bajak, E., van Delft, J., and Kleinjans, J. (2006). Genome-wide differential gene expression in children exposed to air pollution in the czech republic. Mutation Research/Fundamental and Molecular Mechanisms of Mutagenesis, 600(1–2), 12–22.
- van Leeuwen et al. (2008) van Leeuwen, D., Pedersen, M., Hendriksen, P., Boorsma, A., van Herwijnen, M., Gottschalk, R., Kirsch-Volders, M., Knudsen, L., Sram, R., Bajak, E., van Delft, J., and Kleinjans, J. (2008). Genomic analysis suggests higher susceptibility of children to air pollution. Carcinogenesis, 29(5).
- Zhang and Horvath (2005) Zhang, B. and Horvath, S. (2005). A General Framework for Weighted Gene Co-Expression Network Analysis. Statistical Applications in Genetics and Molecular Biology, 4(1), Article 17.
- Zhang et al. (2005a) Zhang, B., Kirov, S., and Snoddy, J. (2005a). WebGestalt: an integrated system for exploring gene sets in various biological contexts. Nuc. Acid. Res., 33.
- Zhang et al. (2005b) Zhang, B., Kirov, S., and Snoddy, J. (2005b). Webgestalt: an integrated system for exploring gene sets in various biological contexts. Nucleic Acids Res, 33.
- Zhang et al. (2005c) Zhang, Y., James, M., Middleton, F., and Davis, R. (2005c). Transcriptional analysis of multiple brain regions in Parkinson’s disease supports the involvement of specific protein processing, energy metabolism and signaling pathways and suggests novel disease mechanisms. American Journal of Medical Genetics Part B Neuropsychiatric Genetics, 137B, 5–16.
- Zhao et al. (2010) Zhao, W., Langfelder, P., Fuller, T., Dong, J., Li, A., and Horvath, S. (2010). Weighted gene coexpression network analysis: state of the art. Journal of Biopharmaceutical Statistics, 20(2), 281–300.
- Zou and Hastie (2005) Zou, H. and Hastie, T. (2005). Regularization and variable selection via the elastic net. Journal of the Royal Statistical Society, Series B.