A high-frequency study of the Sunyaev-Zel’dovich effect morphology in galaxy clusters
Abstract
High-frequency, high-resolution imaging of the Sunyaev-Zel’dovich (SZ) effect is an important technique to study the complex structures of the atmospheres of merging galaxy clusters. Such observations are sensitive to the details of the electron spectrum. We show that the morphology of the SZ intensity maps in simulated galaxy clusters observed at 345 GHz, 600 GHz, and 857 GHz are significantly different because of SZ relativistic corrections. These differences can be revealed by high-resolution imaging instruments.
We calculate relativistically corrected SZ intensity maps of a simulated, massive, merging galaxy cluster and of the massive, merging clusters 1E0657-558 (the Bullet Cluster) and Abell 2219. The morphologies of the SZ intensity maps are remarkably different between 345 GHz and 857 GHz for each merging cluster. We show that high-resolution imaging observations of the SZ intensity maps at these frequencies, obtainable with the LABOCA and HERSCHEL-SPIRE instruments, allow to fully exploit the astrophysical relevance of the predicted SZ morphological effect.
keywords:
galaxies: cluster: general – cosmology: cosmic microwave background.1 Introduction
Galaxy clusters are the largest gravitationally bound structures in the Universe, with sizes of the order Mpcs. The space between galaxies in the most massive clusters is filled with a low-density (– cm-3) high temperature ( keV), highly ionized X-ray emitting plasma. Inverse Compton scattering of hot free electrons in clusters of galaxies by the cosmic microwave background (CMB) radiation field causes a change in the spectrum of the CMB radiation towards clusters of galaxies (the Sunyaev-Zel’dovich effect, hereinafter the SZ effect; see Sunyaev & Zel’dovich 1980). The SZ effect measures the pressure of the electron population integrated along the line of sight. Relativistic effects are significant for high temperature plasmas in massive galaxy clusters (see, e.g., Rephaeli 1995). A relativistically correct formalism for the SZ effect that is based on the probability distribution of the photon frequency shift after scattering was given by Wright (1979) to describe the Comptonization process of soft photons by high temperature plasma. We use the Wright formalism in this paper, which has been proven to be relativistically covariant (Nozawa & Kohyama. 2009, Colafrancesco & Marchegiani 2010). The relativistic treatment of the SZ effect allows us to measure the temperature of intracluster plasma (see Pointecouteau et al. 1998; Hansen et al. 2002) and even the cluster temperature profile (Colafrancesco & Marchegiani 2010). Relativistic corrections of the SZ effect from massive galaxy clusters are significant at high frequencies (above GHz). The first detection of the SZ effect increment at frequencies above 600 GHz, where the relativistic corrections of the SZ effect dominate, has recently been obtained with HERSCHEL-SPIRE (Zemcov et al. 2010) for the cluster 1E0657-558, the so-called Bullet Cluster. The present-day and planned microwave and millimeter instruments are able to provide spatially resolved observations of the SZ intensity maps for extended galaxy clusters, approaching the precision of X-ray observations. In fact, the LABOCA bolometer camera on APEX provides us with SZ intensity maps with an angular resolution of 19.5′′ at a frequency of 345 GHz (e.g. Nord et al. 2010), while HERSHEL-SPIRE allows to obtain SZ intensity maps with angular resolutions of 36 ′′ at 600 GHz and 25′′ at 857 GHz (Zemcov et al. 2010). Such instruments are promising to reveal the morphology of the SZ intensity maps in order to study the complex structures of the atmospheres of massive merging clusters.
In this paper we use the results of both a simulated, hot, merging cluster and X-ray observations of the clusters 1E0657-558 and A2219 to show that the SZ relativistic effect provides us with a method to study the complex structure of the electron distribution in massive merging clusters. We calculate SZ effect intensity maps at 345 GHz, 600 GHz and 857 GHz and show that the difference in their morphologies could be revealed by LABOCA and HERSCHEL-SPIRE.
Both SZ measurements and X-ray observations allow us to determine the gas temperature of hot merging clusters of galaxies. We will show that an analysis of the morphology of SZ intensity maps at high frequencies provides us with a method to study high-temperature regions in galaxy clusters. This method is more suitable to analyze high-temperature plasmas compared with the method based on X-ray observations because of uncertainties in the determination of the gas temperature from X-ray measurements. Note that the X-ray surface brightness is proportional to the factor of and that this dependence provides us with a possibility to derive the gas temperature, where is the X-ray photon energy, is the electron temperature and is the Boltzmann constant. However, this exponential factor slightly depends on the gas temperature if the gas temperature is significantly higher than the energy of an emitted X-ray photon. The modern X-ray instruments (Suzaku, Chandra, and XMM-Newton) have the energy range of (0.5 keV-10 keV) and a small effective area at energies higher 8 keV. Therefore, the gas temperature of hot regions of galaxy clusters is derived with a large uncertainty from X-ray observations. Furthermore, X-ray spectra of high-temperature merging clusters can be contaminated by a non-thermal-like X-ray component (see Million & Allen 2009) which is possibly caused by the Inverse Compton effect of CMB photons on ultra-relativistic electrons.
The layout of the paper is as follows. We describe the morphological properties of the SZ effect in Sect. 2. We calculate the SZ intensity maps at 345 GHz, 600 GHz, and 857 GHz (in the framework of the Wright formalism) for the simulated galaxy cluster and show in Sect. 3.1 that the evidence for the morphological SZ effect from this cluster could be revealed by the combined analysis of LABOCA and HERSCHEL-SPIRE. The morphological properties of the SZ effect from the clusters 1E0657-558 and A2219 are considered in Sects. 3.2 and 3.3, respectively. In Sect. 3.4, we demonstrate that the ratio of the SZ intensities at frequencies of 600 GHz to 345 GHz can be used to quantify the difference in the morphology of the SZ intensity maps. We show that the formalism based on the generalized Kompaneets equation can be applied for calculating the SZ intensity maps in Sect. 3.5, and our conclusions are presented in Sect. 4.
2 Morphology of the SZ effect in massive galaxy clusters
The CMB intensity change produced by the SZ effect of non-relativistic electrons in the framework of the Kompaneets approximation is (for a review, see Birkinshaw 1999)
| (1) |
where , , K, and the spectral function is given by
| (2) |
The subscript denotes that Eq. (1) was obtained in the non-relativistic limit. The Comptonization parameter is given by
| (3) |
where the line-of-sight integral extends from the last scattering surface of the CMB radiation to the observer at redshift z=0, is the electron temperature, is the number density of the gas, is the Thomson cross-section, the electron mass, the speed of light, the Boltzmann constant, and the Planck constant.
Note that all the SZ intensity maps derived in the framework of the Kompaneets approximation have the same spatial morphology at each frequency, since the spectral function does not depend on gas temperature. The morphologies of the SZ intensity simulated maps at frequencies GHz and GHz are similar for the cool merging cluster in Prokhorov et al. (2010b). This is because the SZ effect from cool galaxy clusters can approximately be described in the framework of the non-relativistic Kompaneets approximation. However, we will show here that the relativistic corrections of the SZ effect can significantly change the morphology of the SZ intensity maps especially at high frequencies.
The CMB intensity change in the Wright formalism can be written in the form proposed by Prokhorov et al. (2010a) given by
| (4) |
where the spectral function is replaced by the relativistic spectral function , which depends explicitly on the electron temperature. The relativistic spectral function derived in the framework of the Wright formalism is given by
| (5) |
where , and is the distribution of frequency shifts for single scattering (Wright 1979; Rephaeli 1995; for a review, see Birkinshaw 1999), and is the logarithmic frequency shift caused by a scattering (see Birkinshaw 1999).
We calculated the scattering kernels (the distribution of frequency shifts for single scattering), , for thermal plasmas at 10 keV and 20 keV by using Eq. (33) of Birkinshaw (1999), which is a relativistically correct expression. These scattering kernels are shown in Fig. 1 by dashed and dash-dotted lines for thermal plasmas at 10 keV and 20 keV, respectively. We also calculated the approximate scattering kernels for thermal plasmas at 10 keV and 20 keV by using Eq. (4) of Sunyaev (1980), which is based on the expression of the source term (see Appendix I of Babuel-Payrissac & Rouvillois 1970) calculated in the non-relativistic limit. The approximate scattering kernels are shown in Fig. 1 by solid and dotted lines for thermal plasmas at 10 keV and 20 keV, respectively. We find that the approximate scattering kernels tend to have a stronger tail at large values of s, this agrees with the comparison of the approximate and relativistically correct kernels performed by Birkinshaw (1999). The non-relativistic expression of the source term derived by Babuel-Payrissac & Rouvillois (1970) was generalized by Sazonov & Sunyaev (2000), who included terms describing relativistic effects in the source term and analytically derived an approximate expression for the source term which is valid for a high-temperature plasma. Since we apply a numerical method to calculate the SZ effect in this paper, we use the relativistically correct expression for the scattering kernel described by Birkinshaw (1999). Below we compare the relativistically corrected SZ signal with that obtained in the framework of the Kompaneets formalism (which is derived in the diffusion approximation) because the Kompaneets formalism is usually used to describe the non-relativistic SZ effect.

Since the relativistic spectral function depends on the electron temperature, the SZ intensity maps of massive merging galaxy clusters should appear different at higher and higher frequencies. This is due to the increasing dominance of SZ relativistic corrections and to the fact that merging clusters are expected to produce complex temperature distributions. Evidence for the relativistic effects on the SZ intensity maps will be called here, for the sake of conciseness, as the ’morphological SZ effect’. To study the properties of the morphological SZ effect we calculate the SZ intensity maps from a hydrodynamic simulation of a massive merging cluster presented in Akahori & Yoshikawa (2010) and for the clusters 1E0657-558 and A2219 analyzed by Million & Allen (2009). We expect two morphological SZ effects: i) an increase of the SZ intensity at very high frequencies caused by the presence of shocked regions, and ii) a decrease of the SZ intensity at very high frequencies caused by the presence of cool substructures.
We have checked that the contribution of the kinematical SZ effect at very high frequencies (such as 857 GHz) is negligible compared with that of the SZ relativistic corrections for high temperature plasmas. Therefore, SZ observations at very high frequencies are an important tool to reveal unusually hot and cold regions in massive merging clusters of galaxies.
3 Morphology simulations
We calculate the SZ intensity maps for the simulated cluster in Sect. 3.1 and for the 1E0657-558 and A2219 galaxy clusters in Sects. 3.2 and 3.3, respectively. We study the ratio of the SZ intensity signals at two frequencies in Sect. 3.4 and show that the generalized Kompaneets formalism can be used instead of the Wright formalism to derive the SZ intensity maps in Sect. 3.5. We now discuss SZ measurements which can be performed with the LABOCA and HERSCHEL-SPIRE instruments.
Note that the intensity of equals and that the SZ intensity, , does not depend on redshift of galaxy clusters (see, e.g., Birkinshaw 1999).
In Sects. 3.1, 3.2, and 3.3, we calculate the SZ effect from a simulated massive galaxy cluster and from the 1E0657-558 and A2219 galaxy clusters at frequencies of 345 GHz, 600 GHz, and 857 GHz and demonstrate that the SZ intensities at these frequencies are of the order of , , and , respectively. Using the beam sizes of LABOCA at 345 GHz and of HERSCHEL-SPIRE at 600 GHz and 857 GHz, we derive the SZ intensities in the units of mJy/beam.
The SZ intensity of at a frequency of 345 GHz corresponds to 3.5 mJy/beam. We find a noise rms value of 1.4 mJy/beam in the LABOCA map, using the LABOCA observing time calculator 111http://www.apex-telescope.org/bolometer/laboca/obscalc/ for the integration time of 55 hrs. Therefore, the SZ signal to noise ratio (which can be measured by LABOCA with the integration time of 55 hrs) is 2.5. To measure the SZ signal of 3.5 mJy/beam with the signal to noise ratio of 4, we find that the integration time of 130 hrs is required.
The SZ intensity of at a frequency of 600 GHz corresponds to 6.3 mJy/beam. The SZ intensity of at a frequency of 857 GHz corresponds to 0.75 mJy/beam. The instrument noise of HERSCHEL-SPIRE (Nguyen et al. 2010) can be reduced with integration time. Using the Herschel Observation Planning Tool 222http://herschel.esac.esa.int/Tools.shtml, we find that the total on-source integration time of 1 hr is sufficient to make the instrumental noise level of 1.0 mJy/beam for a frequency of 600 GHz much smaller than the expected SZ signal. The total on-source integration time of 4 hrs is sufficient to make the instrumental noise level of 0.25 mJy/beam for a frequency of 857 GHz. Foreground contamination is a source of additional noise at frequencies of 600 GHz and 857 GHz. The foreground contamination can be subtracted from the 350 m (corresponding to 857 GHz) and 500 m (corresponding to 600 GHz) channels by analyzing the 250 m emission. Zemcov et al. (2010) generated a 250 m source catalog and corrected the 350 m and 500 m emission maps to obtain foreground-free measurements of the SZ effect.
3.1 The morphological SZ effect from a simulated merging cluster
To show that the morphologies of the SZ intensity maps of a high temperature merging galaxy cluster, derived in the Wright formalism, are significantly different at 345 GHz, 600 GHz, and 857 GHz, we use the 3D numerical simulations of the merging hot galaxy cluster presented in Akahori & Yoshikawa (2010). These authors considered an encounter of two free-falling galaxy clusters from the epoch of their turn-around (for a review, see Sarazin 2002). We assume in this simulation that the two galaxy clusters have equal virial masses of , and that the impact parameter is zero (for detail on the simulation, see Akahori & Yoshikawa 2010). 3D numerical simulations are an interesting tool which provides us with precisely determined 3D gas temperature maps, while X-ray data have large uncertainties in a determination of the gas temperature in high-temperature regions of galaxy clusters. Therefore, numerical simulations are a useful tool to test theoretical predictions of the morphological SZ effect.
A possible candidate for a high temperature cluster undergoing a major cluster merger is MACSJ0717.5+3745 at z=0.545 (Ma et al. 2009). The angular extent of the simulated box of 4 Mpc4 Mpc at this redshift is close to and is covered by the field of views (FOVs) of LABOCA and HERSCHEL-SPIRE. To obtain SZ effect intensity maps smoothed to the resolution of LABOCA and HERSCHEL-SPIRE, we locate the simulated cluster at a redshift z=0.545.
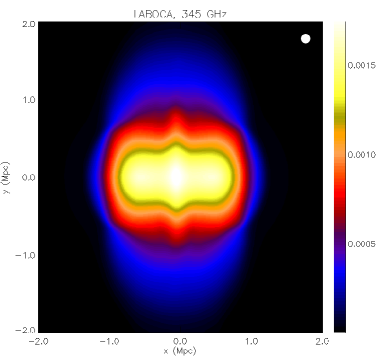
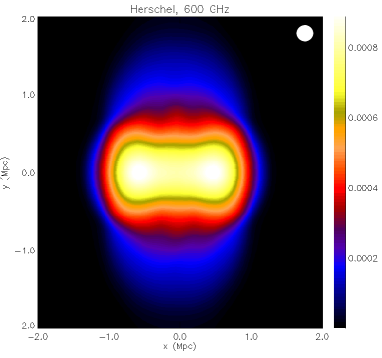
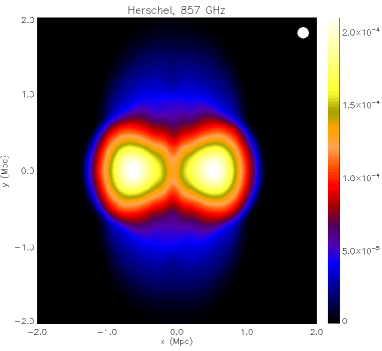
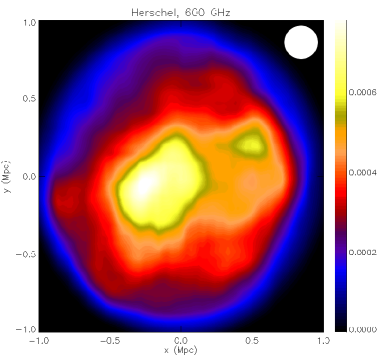
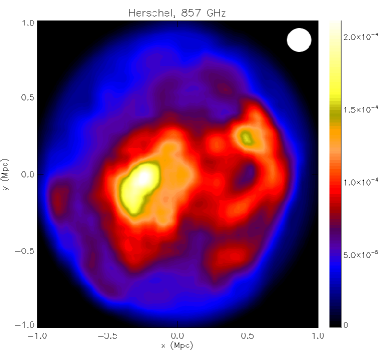
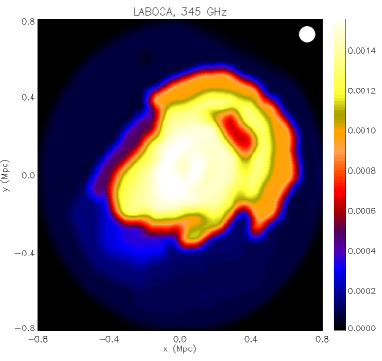
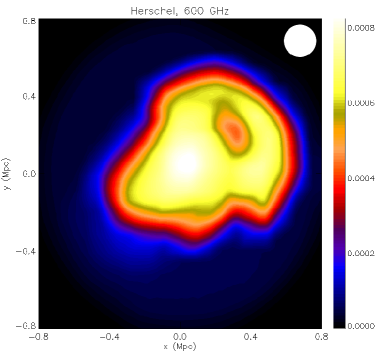
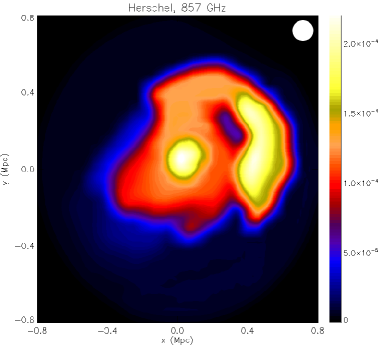
To produce the SZ intensity maps at GHz, 600 GHz, and GHz we use the 3D density and temperature maps (see Figs. 2 and 3 from Akahori & Yoshikawa 2010) for the simulated merging galaxy cluster at a time of Gyr, where Gyr corresponds to the time of the closest approach of the centers of the dark matter halos. We finally calculated the SZ intensity maps using the Wright formalism in the approach described in Prokhorov et al. (2010a, 2010b). The SZ intensity map at a frequency of 345 GHz derived from the simulated maps of the gas density and temperature, and smoothed to the resolution of FWHM of LABOCA (19′′) is shown in Fig. 2. 333We show the beam size of the corresponding instruments by a circle in the upper corners of all the Figs. on which the SZ intensity maps are plotted. We calculate the SZ intensity maps at frequencies of 600 GHz and 857 GHz derived from the simulated maps of the gas density and temperature, and smoothed to the resolution of FWHM of HERSCHEL-SPIRE (36′′ and 25′′, respectively). The calculated SZ intensity maps at frequencies of 600 GHz and 857 GHz are shown in Fig. 3 and 4, respectively.
We find that the maximum of the SZ intensity increment at a frequency of 345 GHz (see Fig. 2) is at the center of this map, while the maximal values of the SZ intensity increment at frequencies of 600 GHz and 857 GHz (see Figs. 3 and 4) are in the post-shock regions (see the Mach number distribution of ICM in Fig. 2 of Akahori & Yoshikawa 2010). This is because the gas temperature in the post-shock regions is the highest and SZ relativistic corrections are significant in these regions.
Figures 2 and 4 show that this difference in the SZ intensity maps at frequencies of 345 GHz and 857 GHz could be revealed by the combined analysis of the LABOCA and HERSCHEL-SPIRE SZ intensity maps. This is because the difference between the calculated central SZ signal at 857 GHz and the expected central SZ increment at 857 GHz, derived from the SZ intensity map at 345 GHz by using the Kompaneets approximation, is , which corresponds to 0.38 mJy/beam. The on-source integration time of foreground-free HERSCHEL-SPIRE observations of 2 hrs is sufficient to reduce the instrumental noise for a detection of the morphological SZ effect at 857 GHz. Analyzing the SZ intensity maps at frequencies of 345 GHz and 600 GHz (see Figs. 2, 3, and also Fig. 11, which shows the ratio of the SZ signals at frequencies of 600 GHz to 345 GHz), we find that foreground-free SZ measurements at 600 GHz by HERSCHEL-SPIRE with the sensitivity of (which corresponds to 1.6 mJy/beam) are required to reveal the difference in morphologies in the central SZ map region. Therefore, the on-source integration time of 45 min is necessary to reduce the instrumental noise for a detection of the difference in morphologies between the calculated and expected (from the SZ intensity map at 345 GHz by using the Kompaneets approximation) SZ intensity maps at 600 GHz in the central region.
3.2 The morphological SZ effect from the cluster 1E0657-558
We calculate the SZ intensity maps in the Wright formalism for the cluster 1E0657-558 (the Bullet Cluster) to show that the morphological SZ effect from this cluster could be revealed by observations of the SZ signal at frequencies of 345 GHz, 600 GHz and 857 GHz.
The cluster 1E0657-558 at z=0.296 consists of two colliding subclusters: a less massive (with keV) western subcluster and a more massive (with keV) eastern subcluster (e.g. Markevitch et al. 2002). The peak of the X-ray surface brightness is centered on the fast-moving, merging western subcluster, i.e. the ‘Bullet’, rather than the overall X-ray center. We use the temperature and pressure maps of the cluster 1E0657-558 which were obtained by Million & Allen (2009) by analyzing Chandra observations. These maps include the most interesting morphological features of this cluster and have the angular extent close to . The analyzed region can be therefore covered by the FOVs of LABOCA and HERSCHEL-SPIRE instruments.
The cluster 1E0657-558 has been recently observed by the APEX-SZ instrument at a frequency of 150 GHz (Halverson et al. 2009). The observed SZ intensity map at 150 GHz has an effective resolution of 85′′ FWHM and is shown in Fig. 3 of Halverson et al. (2009). This intensity map does not show any significant SZ intensity change in the western subcluster region compared to that of the eastern subcluster.
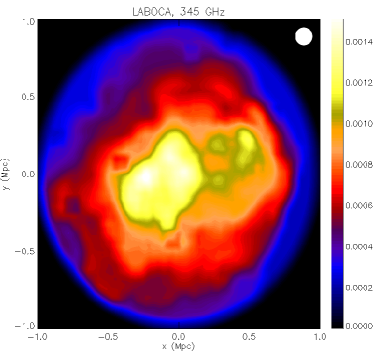
To produce the SZ intensity maps at frequencies of 345 GHz, 600 GHz, and 857 GHz we use the 2D temperature and pressure maps found by Chandra (see Fig. 4 of Million & Allen 2009). Since the X-ray data are projected spectra, temperature and pressure information corresponds to a column of gas through the cluster. We use the average MEKAL normalization K 444, where is the angular diameter distance, is the redshift, and are electron and hydrogen electron densities to derive the pressure in the energy density units from the value of given in Fig. 4 of Million & Allen (2010), where A is the area of the region. Applying the operation of translation we produce 3D density and temperature maps. Using the Wright formalism and the approach described in Sect. 2, we calculate the SZ intensity maps and smooth the SZ intensity maps at frequencies of 345 GHz, 600 GHz, and 857 GHz to obtain the resolution of LABOCA and HERSCHEL-SPIRE, respectively. The SZ intensity maps at 345 GHz, 600 GHz, 857 GHz of the cluster 1E0657-558 smoothed to the resolution of 19′′, 36′′, and 25′′ (FWHM), respectively, are shown in Figs. 5, 6 and 7.
A comparison of Figs. 5 and 7 suggests that the spatial feature on the SZ intensity map, caused by the presence of the cool western subcluster, is seen on the SZ intensity map at a frequency of 857 GHz, while this feature does not appear on the SZ intensity map at a frequency of 345 GHz. This is because the relativistic SZ corrections are small for low temperature plasmas compared to those for high temperature plasmas. Since the relativistic SZ corrections are the dominant contribution to the SZ effect at very high frequencies for high-temperature plasma, the cool ‘Bullet’ substructure is seen as a decrement in the SZ intensity map at 857 GHz. Figure 6 shows that the SZ intensity at 600 GHz from the cool western subcluster has a local decrement caused by the cool ‘Bullet’ substructure. We calculate the ratio of the SZ intensities at 600 GHz to 345 GHz in Sect. 3.4 and find that the ratio is the lowest at the location of the cool ‘Bullet’ substructure. A comparison of Figs. 5 and 7 also shows the presence of a bright, hot region in the eastern subcluster in Fig. 7. This hot region is bright at 857 GHz because the relativistic SZ corrections are the highest in the hottest regions and increase with frequency.
We find that the combined analysis of the LABOCA and HERSCHEL-SPIRE SZ intensity maps is a method to reveal the cool ‘Bullet’ substructure. The difference between the calculated SZ signal at 857 GHz at the location of the cool ‘Bullet’ substructure and the expected SZ increment at 857 GHz at this location, derived from the SZ intensity map at 345 GHz by using the Kompaneets approximation, is . This difference corresponds to 0.19 mJy/beam. The SZ intensity map observable by HERSCHEL-SPIRE at 857 GHz should be more consistent with the SZ intensity map shown in Fig.7 than with that obtained by APEX-SZ at 150 GHz. Using the SZ intensity maps at 345 GHz and 600 GHz, we find that the difference between the calculated and expected (derived from the SZ intensity map at 345 GHz by using the Kompaneets approximation) SZ signals at 600 GHz in the region of the cool western subcluster is and corresponds to 0.35 mJy/beam. Foreground-free SZ measurements by HERSCHEL-SPIRE at 600 GHz with an on-source integration time of 10 hrs are required to reduce the instrumental noise for a detection of the difference in the SZ map morphologies caused by the presence of the cool ‘Bullet’ substructure. We also find that the bright, hot region (in the eastern subcluster) on the foreground-free SZ intensity map at a frequency of 857 GHz can be unveiled by HERSCHEL-SPIRE with an on-source integration time of 2 hrs.
3.3 The morphological SZ effect from the cluster Abell 2219
We calculate the SZ intensity maps in the Wright formalism for the cluster A2219 to show that the morphological SZ effect from this cluster could be revealed by observations of the SZ signal at frequencies of 345 GHz, 600 GHz, and 857 GHz.
The massive galaxy cluster A2219 at redshift z=0.22 is an interesting target to observe the SZ effect at very high frequencies, since the average temperature of this cluster is very high (Million & Allen 2009). The temperature map of A2219 (see Fig. A1 from Million & Allen 2009) shows two extremely hot regions. The first is associated with the merger shock front, and the second is that coincides with the X-ray surface brightness peak. These features are likely associated with recent merger activity. Therefore, SZ relativistic corrections should be important in these regions and these high temperature regions should be bright on the SZ intensity maps at very high frequencies. The angular extent of the cluster A2219 observed by Chandra is close to and can be therefore covered by the FOVs of LABOCA and HERSCHEL-SPIRE instruments.
To produce the SZ intensity maps at frequencies of 345 GHz, 600 GHz, and 857 GHz we use the 2D temperature and pressure maps found by Chandra (from Million & Allen 2009) and consider them as projected. We construct 3D density and temperature maps of A2219 by analogy with those for the cluster 1E0657-558 discussed above. Using the Wright formalism and the approach described in Sect. 2, we calculate the SZ intensity maps and smooth the SZ intensity maps at frequencies of 345 GHz, 600 GHz, and 857 GHz to obtain the resolution of LABOCA and HERSCHEL-SPIRE, respectively. The SZ intensity maps at frequencies of 345 GHz, 600 GHz, and 857 GHz of the cluster A2219 smoothed to the resolution of 19′′, 36′′ and 25′′ (FWHM), respectively, are shown in Figs. 8, 9 and 10.
Comparing Fig.8 with Fig.10, we find that the SZ intensity map at a frequency of 345 GHz is more uniform than that at frequency of 857 GHz. The SZ intensity map at a frequency of 857 GHz shows evidence for a large-scale shock heated region and a very hot region coincident with the peak of the X-ray surface brightness found by Million & Allen (2010). Therefore, observations of the SZ effect at a frequency of 857 GHz should confirm the presence of these hot plasma regions in A2219. High-frequency analysis of the SZ effect morphology will permit us to discover exceptionally hot gas regions in massive galaxy clusters. A comparison of the SZ intensity maps at 345 GHz, 600 GHz, and 857 GHz shows that the brightness of the shock region on the SZ intensity maps increases with frequency (we will perform a comparison of the SZ maps of the cluster A2219 at frequencies of 345 GHz and 600 GHz by means of the SZ intensity ratio in Sect. 3.4). We find that the the on-source integration time of 2 hrs of HERSCHEL-SPIRE at a frequency of 857 GHz is required to reduce the instrumental noise for unveiling both the shock and hot cental region in the galaxy cluster A2219.
We conclude that the galaxy cluster A2219 is an interesting target to analyze by means of the SZ effect at very high frequencies and exhibits regions of very hot gas which could potentially be observed by SZ observations at frequencies of 600 GHz and 857 GHz. Therefore, an analysis of massive galaxy clusters by means of the SZ effect at very high frequencies is a promising tool to study gas-dynamics processes.
3.4 The ratio of the SZ intensity at frequency 600 GHz to that at frequency 345 GHz
Studying of the ratio of the SZ intensities at two frequencies is a way to measure the gas temperature (see Prokhorov et al. 2010b). We checked that the ratio of the SZ intensity at a frequency of 600 GHz to that at a frequency of 345 GHz is a monotonically increasing function of gas temperature and, therefore, measurements of this ratio allows us to unambiguously determine the gas temperature. In this section, we demonstrate that the SZ intensity ratio can be used to quantify the morphological SZ effect.
In the framework of the Kompaneets approximation, the SZ intensity ratio at any two given frequencies does not depend on gas temperature. Therefore, in this approximation the SZ intensity map at a dimensionless frequency of can be derived from the SZ intensity map at a dimensionless frequency of by using the rule and SZ intensity maps look similarly for any frequencies. SZ relativistic corrections contribute to the SZ signal and the morphology of SZ intensity maps at two different frequencies are different in the relativistically correct formalism. Thus, we propose to use the SZ intensity ratio as a quantity which characterizes the morphological SZ effect. Note that the morphological SZ effect is caused by SZ relativistic corrections.
Using the SZ intensity maps at frequencies of 345 GHz and 600 GHz derived in the framework of the Wright formalism in Sects. 3.1, 3.2, and 3.3, we calculate the SZ intensity ratio at frequencies 600 GHz to 345 GHz for the galaxy clusters studied above. The derived maps of the SZ intensity ratio are shown in Figs. 11, 12, and 13 for the simulated galaxy cluster, 1E0657-558, and A2219, respectively. These maps are smoothed to the resolution of HERSCHEL-SPIRE of 36′′ at a frequency of 600 GHz, since this angular resolution is lower than that of LABOCA at a frequency of 345 GHz.
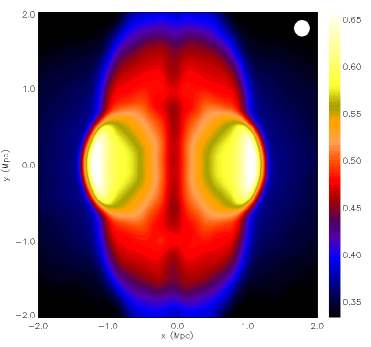
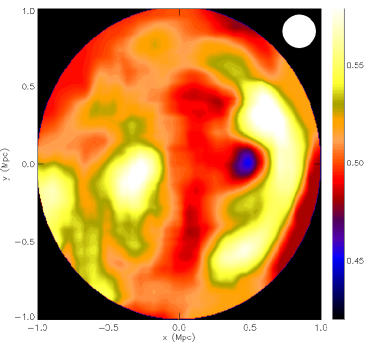
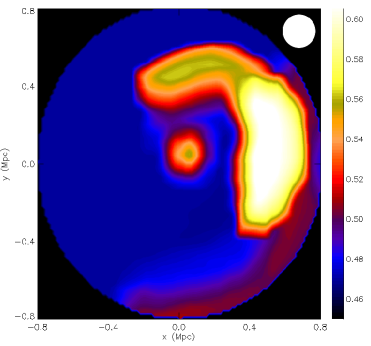
Figure 11 shows the presence of two regions with high values of the SZ intensity ratio in the simulated galaxy cluster. These regions correspond to the hottest regions of the simulated cluster (see Akahori & Yoshikawa 2009) and these regions on the SZ intensity map at a frequency of 600 GHz (see Fig. 3) are the most brightest. Therefore, the SZ intensity maps at frequencies of 345 GHz and 600 GHz look different. The map of the SZ intensity ratio for the galaxy cluster 1E0657-558 which is shown in Fig. 12 has a region with low values of the SZ intensity ratio and this region coincides with the position of the cold substructure ‘Bullet’. Therefore, the cold substructure ‘Bullet’ is clearly seen on the SZ intensity maps at high frequencies (600 GHz and 857 GHz) as a decrement of the SZ intensity. Note that Fig. 12 shows evidence for a high-temperature region in the eastern subcluster and a merger shock. Figure 13 shows that the SZ intensity ratio for the galaxy cluster A2219 is high at the position of the shock wave and in the central region of the map. This is because the gas temperature is higher in these regions compared with the average gas temperature in the galaxy cluster A2219. Thus, the SZ intensity in these regions are bright at high frequencies (600 GHz and 857 GHz) compared with the average SZ intensity.
We conclude that the maps of the SZ intensity ratio at frequencies 600 GHz to 345 GHz demonstrate that the morphologies of the SZ intensity maps at these frequencies are different. This permits us to quantify the SZ morphological effect.
3.5 The generalized Kompaneets formalism
In this section, we consider an alternative method to calculate the SZ effect including SZ relativistic corrections which was proposed by Challinor & Lasenby (1998) and Itoh et al. (1998). This method is based on a study of the generalized Kompaneets equation. An analytical expression for the SZ effect including relativistic terms up to O() terms was derived by Itoh et al. (1998), where is the relativistic expansion parameter.
To compare the SZ effect derived from the Wright formalism with that derived from the generalized Kompaneets formalism, we use Eqs. (2.25-2.30) of Itoh et al. (1998). Note that the terms describing SZ relativistic corrections up to O() given by Eqs. (2.26-2.28) of Itoh et al. (1998) agree with the results obtained by Challinor & Lasenby (1998), the terms describing SZ corrections correct to higher order in the expansion parameter are given only by Itoh et al. (1998).
The SZ effect in the framework of the generalized Kompaneets formalism can be written in the form given by Eq. (4), where the relativistic spectral function equals
| (6) |
where the spectral functions of , , , , and are given by Eqs. (2.26-2.30) of Itoh et al. (1998).
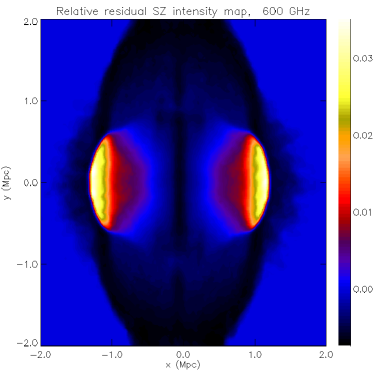
To demonstrate that the generalized Kompaneets formalism can also be used to derive the SZ intensity maps, we calculate the SZ effect at a frequency of 600 GHz for the simulated galaxy cluster by using both the Wright and generalized Kompaneets formalisms. We estimate the number of terms in the expansion of in the framework of the generalized Kompaneets formalism which are necessary to be taken into account for calculating the SZ effect with a precision better than 5%. We find that the four terms in the expansion of are sufficient to calculate the SZ effect with a precision better than 5% for the simulated cluster. We calculate the relative residual SZ signal at a frequency of 600 GHz from the simulated cluster, which is determined by the expression , where is the SZ intensity derived by using the Wright formalism and is the SZ intensity derived by using the generalized Kompaneets formalism correct to third order in . The relative residual SZ intensity map at a frequency of 600 GHz for the simulated cluster between the SZ signals derived in the frameworks of the Wright and generalized Kompaneets (correct to third order in ) formalisms is shown in Fig. 14. Figure 14 shows that the precision of calculation of the SZ effect by means of the generalized Kompaneets formalism (correct to the third term in ) is better than 5% for the simulated cluster. The presence of positive and negative regions on the residual SZ intensity map are caused by the fact that the frequency of 600 GHz is close to the frequency at which the numerical (precisely calculated) and analytical (approximately calculated) curves shown in Fig. 5 of Itoh et al. (1998) are crossing.
We calculate the residual SZ intensity map at a frequency of 600 GHz for the simulated cluster between the SZ signals derived from the Wright and (non-extended) Kompaneets formalisms and find that the difference in the SZ intensities is around 30% in the regions where the difference in the SZ intensities in Fig. 14 is maximal. Since the precision of the generalized Kompaneets formalism is sufficiently high for a plasma with temperature of 20 keV to estimate the relativistic SZ corrections, we conclude that the generalized Kompaneets formalism can be used instead of the Wright formalism to derive the SZ intensity maps.
4 Conclusions
Merging galaxy clusters are an interesting astrophysical laboratory for studying gas-dynamics processes. Mergers of galaxy clusters are very energetic astrophysical events in which huge gravitational energy is released. In the course of a merger, a significant portion of this energy is dissipated by merger shock waves. This leads to a heating of the gas to higher temperatures. On the other hand, cool, dense gas clouds in the ambient high temperature gas of clusters, such as the ‘Bullet’ in the cluster 1E0657-558, are also present in merging clusters. We show that observations of the SZ effect at very high frequencies can provide a method to study these phenomena by analyzing the relativistic corrections to the SZ effect.
To produce a realistic high temperature merging cluster, we have
used the cosmological simulation from Akahori & Yoshikawa (2010).
We have found that the simulated cluster undergoes a violent merger,
which drives the cluster gas to higher temperatures. We have
incorporated the relativistic Wright formalism for modeling the SZ
effect in the numerical simulation using the procedure proposed by
Prokhorov et al. (2010a). We have calculated the SZ intensity maps
at frequencies of 345 GHz, 600 GHz, and 857 GHz at which the SZ
effect is observable by LABOCA and HERSCHEL-SPIRE, respectively. We
have demonstrated that the morphology of the SZ intensity maps at
these frequencies are different (i.e., there is evidence for a
morphological SZ effect), since SZ relativistic corrections are
large for a high temperature plasma compared with those for a low
temperature plasma and are the dominant contribution to the SZ
effect at very high frequencies. The morphological SZ effect from
the simulated galaxy cluster is caused by a violent merger activity.
Using the Wright formalism and the density and temperature maps of
the cluster 1E0657-558 obtained by Chandra (Million & Allen 2009),
we calculated the SZ intensity maps of the cluster 1E0657-558 at
frequencies of 345 GHz, 600 GHz, and 857 GHz. We found that the SZ
intensity map at 857 GHz has a spatial feature caused by the
presence of the cold substructure ‘Bullet’ seen in the X-ray surface
brightness map. However, this cold substructure is not present on
the SZ intensity map at 345 GHz. This is a consequence of the
relativistic corrections of the SZ effect and shows that
observations of the SZ intensity maps at very high frequencies are
promising to reveal the complex substructures within massive galaxy
clusters.
We have also calculated the SZ effect from the cluster A2219 at frequencies of 345 GHz, 600 GHz, and 857 GHz using the Wright formalism and the density and temperature maps obtained by Chandra (Million & Allen 2009). The SZ intensity maps at high frequencies show evidence for a large-scale shock heated region and a very hot region coincident with the peak of the X-ray surface brightness. Therefore, an analysis of the SZ signal at high frequencies is a promising method for unveiling high temperature regions in massive merging clusters.
This paper is a theoretical study of the morphological changes in the images of the SZ effect in bright merging galaxy clusters caused by the contribution of the relativistic corrections to the SZ effect and by variations in the temperature of the intracluster medium. We show that integration times of several hours are required to reveal the differences in the SZ map morphologies of the considered clusters. Note that foreground-free maps predicted for HERSCHEL-SPIRE are not a fully realistic realization. These maps should be clean of contaminating sources up to the level that the structure remaining in the maps is predominantly the SZ effect signal. The remaining unresolved sources are going to be both a source of uncertainty and a bias for the measurements. The differences in the SZ intensity maps at 345 GHz, 600 GHz, and 857 GHz can be marginally revealed by the combined analysis of the LABOCA and HERSCHEL-SPIRE intensity maps. We conclude that the SZ intensity maps at very high frequencies will permit us to reveal very hot plasma regions in galaxy clusters.
The energy ranges of the modern X-ray instruments of (0.5 keV – 10 keV) constrain our ability to analyze the most massive galaxy clusters with temperatures of ( keV) and the hottest regions in these clusters. We suggest that the morphological SZ effect will provide us with an important additional tool to study the merger activity in the most massive galaxy clusters.
Acknowledgments
We are grateful to Steven Allen for valuable suggestions and discussions and thank the referee for valuable suggestions.
References
- [1] Akahori, T., Yoshikawa, K. 2010, PASJ, 62, 335
- [2] Babuel-Peyrissac, J. P., Rouvillois, G. 1970, J. Quant. Spectr. Transfer., 10, 1277
- [3] Birkinshaw, M. 1999, Phys. Rep., 310, 97
- [4] Colafrancesco, S., Marchegiani, P. 2010, A&A, 520, A31
- [5] Halverson, N. W., Lanting, T., Ade, P. A. R. et al. 2009, ApJ, 701, 42
- [6] Hansen, S. H., Pastor, S., Semikoz, D. V. 2002, ApJ, 573, L69
- [7] Itoh, N., Kohyama, Y., Nozawa, S. 1998, ApJ, 502, 7
- [8] Kompaneets, A. S. 1957, Soviet Phys.-JETP, 4, 730
- [9] Nguyen, H. T. et al. 2010, A&A, 518L, 5
- [10] Nozawa, S., Kohyama, Y. 2009, PhRvD, 79, 3005
- [11] Ma, C.-J., Ebeling, H., Barrett, E. 2009, ApJL, 693, L56
- [12] Markevitch, M., Gonzalez, A. H., David, L. et al. 2002, ApJL, 567, L27
- [13] Million, E. T., Allen, S. W. 2009, MNRAS, 399, 1307
- [14] Pointecouteau, E., Giard, M., Barret, D. 1998, A&A, 336, 44
- [15] Prokhorov, D. A., Antonuccio-Delogu, V., Silk, J. 2010a, A&A, 520, A106
- [16] Prokhorov, D. A., Dubois, Y., Nagataki, S. 2010b, A&A, 524, A89
- [17] Rephaeli, Y. 1995, ApJ, 445, 33
- [18] Sazonov, S. Y., Sunyaev, R. S. 2000, ApJ, 543, 28
- [19] Sunyaev, R. A. 1980, Sov. Astron. Lett., 6, 213
- [20] Sunyaev, R. A., Zel dovich, Ya. B. 1980, ARA&A, 18, 537
- [21] Wright, E. L. 1979, ApJ, 232, 348
- [22] Zemcov, M., Rex, M., Rawle, T. D. et al. 2010, A&A, 518, L16