Quantum Monte Carlo study of the formation of molecular polarizations and
the antiferroelectric ordering in squaric acid crystals
Abstract
Effects of geometrical frustration and quantum fluctuation are theoretically investigated for the proton ordering in a quasi-two-dimensional hydrogen-bonded system, squaric acid crystal. We elucidate the phase diagram for an effective model, the transverse-field Ising model on a frustrated checkerboard lattice, by using quantum Monte Carlo simulation. A crossover to liquidlike paraelectric state with well-developed molecular polarizations is identified, distinguishably from long-range ordering. Emergence of long-range order from the liquidlike state exhibits peculiar aspects originating from the lifting of quasi-macroscopic degeneracy, such as colossal enhancement of the transition temperature and a vanishingly small anomaly in the specific heat.
pacs:
77.80.-e,77.84.Fa,75.10.Jm,75.40.MgI Introduction
Proton ordering in hydrogen-bonded systems has long been one of the central topics in condensed matter physics. Each proton is in a double-minimum potential on the hydrogen bond, and spatial correlations among the proton configurations strongly affect macroscopic properties of hydrogen-bonded crystals. A famous example is the “ice-rule” configuration of protons and its relation to the residual entropy in water ice Bernal1933 ; Pauling1933 . Another example is the ferroelectricity due to the proton ordering in KH2PO4 Slater1941 ; Blinc1960 ; deGennes1963 . Electronic polarization emerging from proton ordering has been extensively studied with emphasis on both the fundamental physics and the application to electronic devices Lines1977 ; Horiuchi2008 .
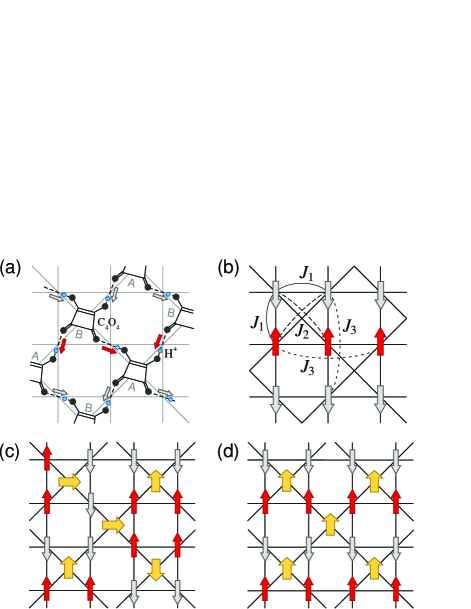
Here, we focus on one of such hydrogen-bonded materials, squaric acid crystal H2C4O4 (H2SQ). H2SQ is a quasi-two-dimensional (2D) molecular solid. In each 2D layer, squaric acid molecules form a network of hydrogen bonds, as shown in Fig. 1(a) Semmingsen1973 . A particular configuration of protons induces a polarization in each molecule, and an ordering of the polarizations can lead to ferroelectricity. In fact, H2SQ exhibits antiferroelectricity below K, which is driven by the 2D ferroelectric ordering with interlayer antiferroelectric coupling Samuelsen1977 .
H2SQ has two striking aspects. One is the local constraint on the proton positions similar to the ice rule in water ice. Each molecule has four hydrogen bonds; two out of four protons come close to the C4O4 unit and the other two are far. The local constraint alone is not sufficient to determine a unique ground state and brings about a macroscopic degeneracy, as seen in water ice; H2SQ has geometrical frustration in nature.
The other aspect is the effect of quantum tunneling of protons. In general, the external pressure increases the tunneling rate of protons between two potential minima, which reduces local polarizations, and consequently, suppresses the ferroelectricity. Indeed, in H2SQ, is suppressed with increasing pressure. A peculiar intermediate state, however, appears before the polarization is lost in each molecule: the macroscopic polarization vanishes while the polarization in each molecule is retained Moritomo1991_3 . Consequently, a quantum paraelectric state is realized in the low-temperature limit.
There have been many theoretical studies for the antiferroelectric transition in H2SQ. The local constraint and associated frustration were considered on the basis of vertex models or frustrated pseudospin models Deininghaus1981 ; Stilck1981 ; Zinenko1976 ; Matsushita1980 . The coupling between pseudospins and phonons was also studied Chaudhuri1990 ; Wesselinowa1995 ; Dalal1998 . Most of the studies, however, were limited at the mean-field level, and the effect of geometrical frustration has not been fully clarified yet. In particular, quantum fluctuation under the geometrical frustration, which is presumably important for understanding the quantum paraelectricity under pressure, has not been seriously considered so far.
In the present study, we investigate an effective model for H2SQ, a 2D checkerboard-lattice Ising model with transverse field which corresponds to the application of external pressure. With a sophisticated quantum Monte Carlo (QMC) method, we map out the numerically-exact phase diagram. We identify a liquidlike state intervening between the ferroelectric phase and the paraelectric phase. In the intermediate state, molecular polarizations are well retained by ice-rule type local correlations, but they are globally disordered. The peculiar nature of transition from the intermediate state to ferroelectric phase is discussed.
The organization of this paper is as follows. In Sec. II, we introduce models and methods. After introducing the pseudo-spin model in Sec. II.1, we explain the numerical method and the definition of the observables in Sec. II.2 and Sec. II.3, respectively. The results of calculation are presented in Sec. III. The temperature dependence of observables is given in Sec. III.1 and the phase diagram in Sec. III.2. Discussions on our results with the previous studies are elaborated in Sec. IV. Section V is devoted to summary.
II Model and method
II.1 Pseudo-spin model
We here consider a pseudospin model for H2SQ following the previous studies Zinenko1976 ; Matsushita1980 . In the pseudospin model, proton displacements in a plane of the bipartite square lattice of H2SQ molecules [Fig. 1(a)] are represented by the -component of pseudospins as [Fig. 1(b)] Blinc1960 ; deGennes1963 . Here the appropriate signs are assigned so that protons belonging to A(B) sublattice H2SQ molecules correspond to the up(down) spins. The local constraint similar to the ice rule in water ice Bernal1933 ; Pauling1933 (two out of four protons are close and the other two are far) is taken into account by the antiferromagnetic interactions between nearest neighbors, , and crisscrossing next-nearest neighbors, , on the checkerboard lattice Zinenko1976 ; Matsushita1980 . When , the model is a 2D variant of the spin-ice model Harris1997 ; Ramirez1999 , in which sixfold degeneracy in each plaquette results in a macroscopic number of energetically-degenerate ground states . In the present case, we take since two closer protons favor an edge of the C4O4 square, not a diagonal Zinenko1976 ; Matsushita1980 . larger than partially lifts the degeneracy, but the ground-state degeneracy still remains: all configurations with different stacking of antiferromagnetic 1D diagonal chains, exemplified in Figs. 1(c) and 1(d), give the same lowest energy. The degeneracy is reduced but still quasi-macroscopic, i.e., . Hence, the present - model does not show any long-range order down to zero Deininghaus1981 ; Stilck1981 , although a finite- transition was discussed in the previous mean-field studies Zinenko1976 ; Matsushita1980 .
To stabilize a ferroelectric ordering [a stripe ordering in terms of pseudospins, shown in Fig. 1(d)], a further degeneracy-lifting perturbation must be included. In the present study, we consider an inter-molecular coupling originating from the distortion by forming C=C double bonds. A C=C double bond induces a trapezoid-type distortion of C4 square, and favors a ferro-type alignment of the molecules since a short C=C bond tends to elongate the neighboring parallel C-C bonds in the adjacent molecules. The inter-molecular correlation is incorporated by a third-neighbor ferromagnetic interaction [Fig. 1(b)]. lifts the remaining degeneracy and selects the ferroelectrically-ordered state.
By summarizing the above argument, our model is given by the following Hamiltonian
| (1) |
where, is the component of the Pauli matrix, representing the pseudospin operator at site ; , and the first, second, and third sums are taken between the nearest, second (crisscrossing), third neighbors on the checkerboard lattice, as shown in Fig. 1(b). Here, the last term with the transverse field is introduced to represent the quantum tunneling of protons. We take as the energy unit, and focus on the case with . The results are qualitatively the same for . We analyze the 2D model by changing , , and to clarify the nature of inplane ferroelectricity in H2SQ; the effect of the interplane coupling will be mentioned later.
II.2 Quantum Monte Carlo method
To investigate the thermodynamics of the model given by Eq. (1), we employ a recently-developed continuous-time QMC method with a cluster update in the imaginary-time direction Nakamura2008 . In order to overcome the slow relaxation in the present frustrated system, we use the replica exchange method Fukushima1996 and the loop-flip update algorithm Rahman1972 . In the replica exchange, the replicas are chosen along the constant lines since the Boltzmann weight strongly depends on the numbers of domain walls along the imaginary-time direction which are proportional to . For the loop-flip algorithm, we applied two variants of the original algorithm. One is the original algorithm which forms a loop by connecting up spins and down spins alternatively, with treating the and bonds equivalently. The other one is the diagonal flipping process; a diagonal chain of spins connected by is flipped at once. The system sizes are taken from to () under periodic boundary conditions. Typically, MC measurements are performed for 100000 samplings after 30000 initial thermalizations. Results are divided into six bins to estimate statistical errors by the variance among the bins.
II.3 Physical quantities
To distinguish the long-range order and “ice-rule” type local correlations, we calculate the macroscopic polarization and local correlation parameter . is calculated as
| (2) |
via the spin structure factor
| (3) |
which detects the stripe-type ordering in Fig. 1(d). The critical temperature is determined by the Binder analysis Binder1981 using the Binder parameter for ,
| (4) |
On the other hand, detects the fourfold-degenerate stable configuration in each plaquette by
| (5) |
where the sum runs over all the crisscrossing plaquettes, and is a function giving 1 for the fourfold stable states and otherwise in th plaquette: when the spins are completely disordered, and when all the plaquettes are in the fourfold stable states. Note that is not an order parameter but characterizes a crossover associated with the formation of molecular polarizations as demonstrated below. We also measure the corresponding susceptibilities, and , from the fluctuations of and as
| (6) | |||||
| (7) |
respectively. The specific heat is calculated by
| (8) |
III Results
III.1 Locally-correlated liquidlike state
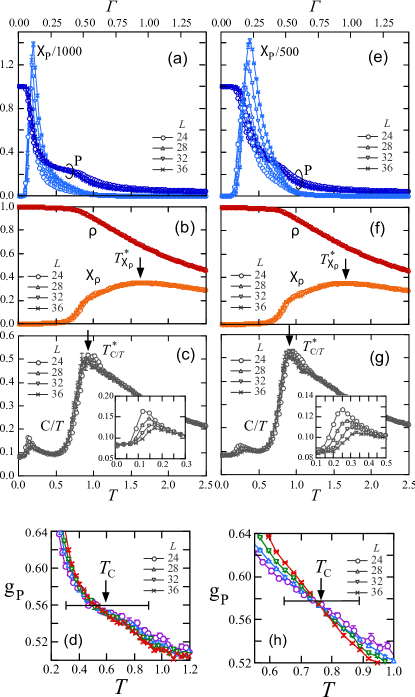
Figure 2 shows QMC results along axis at and . At the lowest , the system shows a ferroelectric ordering with fully-saturated polarization , as shown in Figs. 2(a) and 2(e). With increasing and , steeply decreases and the corresponding susceptibility shows a sharp peak which grows as increases, indicating a phase transition into a paraelectric state. The critical temperature is estimated from the crossing point of the Binder parameter of given by Eq. (4), as shown in Figs. 2(d) and 2(h): for and for . On the other hand, the local correlation parameter remains to be large even above and gradually decreases for [Figs. 2(b) and 2(f)]. Correspondingly, the specific heat divided by has a peak, as shown in Figs. 2(c) and 2(g). The susceptibility for , , shows a broad peak at a higher . These indicate that the system does not directly enter into a completely disordered state at but exhibits an intermediate state in which molecular polarizations are retained; the system shows a crossover to a completely-disordered paraelectric state characterized by the peak of or at or . The intermediate state is a liquidlike paraelectric state originating from the ice-rule type local correlations.
In the ferroelectric phase transition and crossover to liquidlike phase, most of the entropy is released at the crossover by forming the ice-rule type manifold. As shown in Figs. 2(c) and 2(g), sharply decreases with the saturation of , and the peak associated with the phase transition at a lower is very small. In fact, as shown in the insets, the intensity of the small peak decreases as increases, while the peak position approaches . This suggests that the entropy associated with the phase transition becomes vanishingly small in the thermodynamic limit. The peculiar behavior is understood by considering the quasi-macroscopic degeneracy in the ice-rule type manifold where the remaining entropy is in the order of not Stilck1981 .
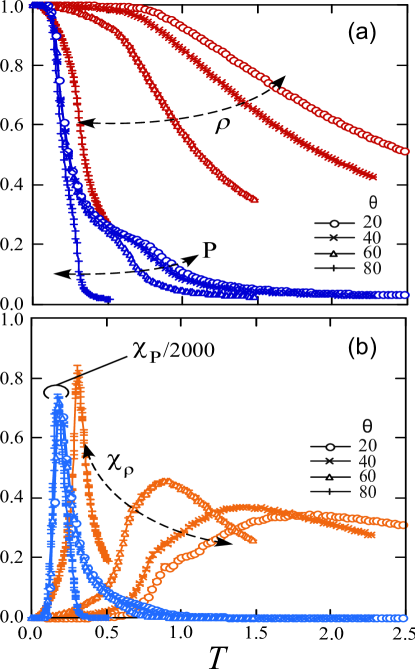
The intermediate liquidlike state is widely observed while changing . Figure 3 shows , , and their susceptibilities along the various axes. As indicated by a decrease of and a broad peak of , the crossover temperature largely decreases with increasing , while the data of and show that does not decreases so rapidly. There, however, is always a window of the intermediate state with well-developed local correlations and suppressed global order.
III.2 Phase diagrams
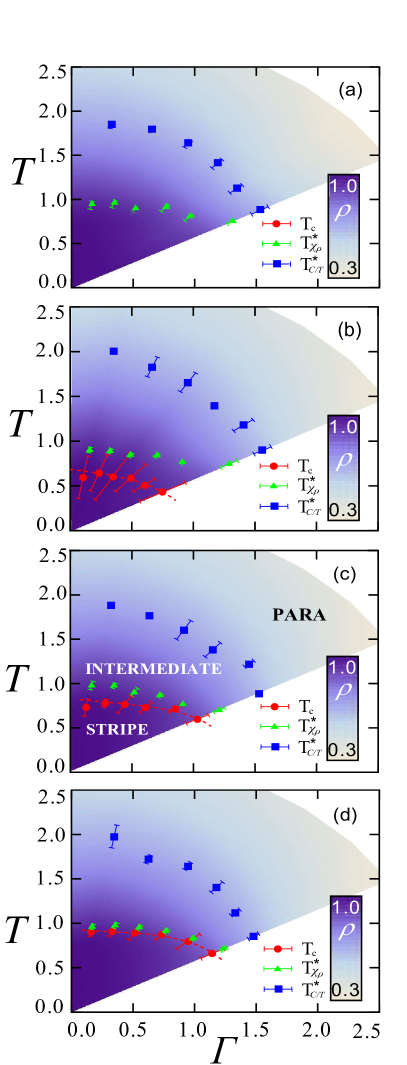
The phase diagrams for , , and are summarized in Fig. 4. are estimated by the Binder analysis of , and are identified by a peak of or . In the case of , the system exhibits only the crossover into the liquidlike state with quasi-macroscopic degeneracy [the region below ; see Figs. 2(b) and (f)], and remains paraelectric down to the lowest calculated. One might expect a quantum order by disorder as predicted for the case of Moessner2001 , but it will be limited to very low region, if any, and is out of the scope of the present study. With switched on, the degeneracy is lifted and the ferroelecrically-ordered phase emerges inside the liquidlike state. The ordered state rapidly extends with increasing , but a sequential change of the three different regimes is clearly observed in the region where is sufficiently small. With further increasing , exceeds and the intermediate liquidlike state is taken over by the long-range ordered state.
A remarkable point of the phase diagram is the rapid growth of with , which is more than 100 times larger than . This colossal enhancement of is also ascribed to the peculiar nature of the intermediate state with quasi-macroscopic degeneracy; the spatial correlations are strongly enhanced along the diagonal chains. This strong correlation reinforces the effect of as and are not frustrated, and the system becomes extremely sensitive to the degeneracy-lifting perturbation . Another point is the fate of the intermediate state at low temperatures. Since the QMC simulation becomes harder for larger , it is difficult to conclude whether the intermediate state remains at low temperatures. Nonetheless, we expect a finite window down to low for small from the systematic change of the phase diagram shown in Fig. 4.
IV Discussions
Comparing with experiments, we successfully identify the liquidlike state with well-developed molecular polarizations, which might account for the peculiar intermediate state in experiments Moritomo1991_3 . Our results suggest that the intriguing physics related with the ice-rule type degeneracy is involved within the 2D layers of H2SQ crystal. We note, however, that the qualitative shape of the phase diagram appears to be different; in experiments, both and decrease almost linearly in applied pressure and their difference is almost independent of pressure. This can be ascribed to the parametrization of the realistic situation; i.e., how the model parameters change under pressure. The first-principle calculations may help further quantitative studies Rovira2001 . Another possible origin of the discrepancy is an ambiguity in assigning ; in general, crossover boundary depends on how to define or detect it. With regard to the nature of the phase transition, our results indicate that it is second order and the associated anomaly of the specific heat is vanishingly small. These apparent contradictions with experiments Barth1979 ; Kuhn1979 ; Mehring1981 might be reconciled by considering the interlayer coupling or more complicated couplings to lattice distortions, which are neglected in our model Mehring1981-2 ; Wang1989 ; Wesselinowa1995 .
Comparing with the previous theoretical researches, our results are obtained by seriously including both geometrical frustration and quantum fluctuation, which were not fully taken into account in the previous studies. For instance, in the absence of , our result shows no phase transition as expected in the frustrated situation, in contrast to the previous research in which a finite-temperature phase transition was predicted because of the mean-field type treatment. Furthermore, our result clearly indicated existence of the liquidlike state as well as several significant consequences of the local correlation on the thermodynamical properties. In particular, the absence of anomaly in the specific heat at and the strong enhancement of by are revealed for the first time by our calculations. On the other hand, as mentioned above, our result also showed continuous transition as in many previous theoretical studies using pseudospin or an equivalent approach. This suggests that an extension of the model is necessary to account for the first-order transition in experiments.
V Summary
To summarize, we have investigated the geometrically-frustrated transverse-field Ising model as an effective model for squaric acid crystals. By unbiased QMC simulations, we have identified an intermediate liquidlike state between the ferroelectrically-ordered state and the completely-disordered paraelectric state, in which molecular polarizations are well preserved but they are globally disordered due to the frustration. Furthermore, we found out that the emergence of locally correlated state significantly affects the thermodynamic behavior of this system. In particular, we unveiled the vanishingly-small anomaly in the specific heat at the transition point and the colossal enhancement of by the degeneracy-lifting perturbation . Emergence of such state and the remarkable effects have never been reported in the previous theories. The liquidlike state accounts for a peculiar intermediate paraelectric state observed under external pressure in the squaric acid crystal.
Although our results qualitatively reproduce the peculiar phase diagram of the squaric acid under pressure, the quantitative changes of the critical temperature and the crossover temperature are different from those in experiments. Further quantitative researches are necessary. For example, experimentally, detailed analysis of the structure under pressure will be quite important for more quantitative comparison between experiment and theory. Moreover, the first-principle calculation will help to identify the model parameters and their changes under pressure more precisely. On the other hand, our result exhibits second order phase transition, which is in contrast to the first order transition observed experimentally. This might require further extension of the model, for example, by including the interlayer coupling and complicated couplings to lattice distortions. Such extension is left for the future work.
Acknowledgement
The authors thank Y. Tokura for fruitful discussions. H.I. and Y.M. thank T. Misawa, Y. Motoyama, H. Shinaoka, and M. Udagawa for helpful comments. This research was supported by KAKENHI (No. 19052008, No. 20740225, and No. 22540372), and Global COE Program “the Physical Sciences Frontier.”
References
- (1) J. D. Bernal and R. H. Fowler, J. Chem. Phys. 1, 515 (1933).
- (2) L. Pauling, J. Am. Chem. Soc. 57, 2680 (1935).
- (3) J. C. Slater, J. Chem. Phys. 9, 16 (1941).
- (4) R. Blinc, J. Phys. Chem. Solids 13, 204 (1960).
- (5) P. G. de Gennes, Solid State Commun. 1, 132 (1963).
- (6) M. E. Lines and A. M. Glass, Principles and Applications of Ferroelectrics and Related Materials (Oxford University Press Inc., New York, 1977).
- (7) S. Horiuchi and Y. Tokura, Nature Mater. 7, 357 (2008).
- (8) D. Semmingsen, Acta. Chem. Scand. 27, 3961 (1973).
- (9) E. J. Samuelsen and D. Semmingsen, J. Phys. Chem. Solid 38, 1275 (1977).
- (10) Y. Moritomo, Y. Tokura, H. Takahashi, and N. Mri, Phys. Rev. Lett. 67, 2041 (1991).
- (11) U. Deininghaus, Z. Phys. B. 45, 71 (1981).
- (12) J. F. Stilck and S. R. Salinas, J. Chem. Phys. 75, 1368 (1981).
- (13) V. I. Zinenko, Phys. Stat. Sol. (b) 78, 721 (1976).
- (14) E. Matsushita, K. Yoshimitsu, and T. Matsubara, Prog. Theor. Phys. 64, 1176 (1980).
- (15) B. K. Chaudhuri, P. K. Dey, and T. Matsuo, Phys. Rev. B 41, 2479(1990).
- (16) J. M. Wesselinowa, A. T. Apostolov, and M. S. Marinov, J. Phys.: Cond. Matter 7, 1701 (1995).
- (17) N. Dalal, A. Klymachyov, and A. Bussmann-Holder, Phys. Rev. Lett. 81, 5924 (1998).
- (18) M. J. Harris et al., Phys. Rev. Lett. 79, 2554 (1997).
- (19) A. P. Ramirez et al., Nature 399, 333 (1999).
- (20) T. Nakamura, Phys. Rev. Lett. 101, 210602 (2008).
- (21) K. Hukushima and K. Nemoto, J. Phys. Soc. Jpn. 65, 1604 (1996).
- (22) A. Rahman and F. H. Stillinger, J. Chem. Phys. 57, 4009 (1972).
- (23) K. Binder, Z. Phys. B 43, 119 (1981).
- (24) R. Moessner and S. L. Sondhi, Phys. Rev. B 63, 224401 (2001).
- (25) C. Rovira, J. J. Novoa, and P. Ballone, J. Chem. Phys. 115, 6406 (2001).
- (26) E. Barth, J. Helwig, H.-D. Maier, H.E. Muser, and J. Petersson, Z. Phys. B 34, 393(1979).
- (27) W. Kuhn, H.-D. Maier, and J. Petersson, Sol. Stat. Commun. 32, 249 (1979).
- (28) M. Mehring and J.D. Becker, Phys. Rev. Lett. 47, 366 (1981).
- (29) U. Deiningham and M. Mehring, Solid State Commun. 39, 1257 (1981).
- (30) C. L. Wang, Z. K. Qin, and D. L. Lin, Phys. Rev. B 40, 680 (1989).