CO (2-1) Line Emission in Redshift 6 Quasar Host Galaxies
Abstract
We report new observations of CO (2-1) line emission toward five z6 quasars using the Ka-band receiver system on the Expanded Very Large Array (EVLA). Strong detections were obtained in two of them, SDSS J092721.82+200123.7 and CFHQS J142952.17+544717.6, and a marginal detection was obtained in another source, SDSS J084035.09+562419.9. Upper limits of the CO (2-1) line emission have been obtained for the other two objects. The CO (2-1) line detection in J0927+2001, together with previous measurements of the CO (6-5) and (5-4) lines, reveals important constraints on the CO excitation in the central 10 kpc region of the quasar host galaxy. The CO (2-1) line emission from J1429+5447 is resolved into two distinct peaks separated by 1.2′′ ( kpc), indicating a possible gas-rich, major merging system, and the optical quasar position is consistent with the west peak. This result is in good agreement with the picture in which intense host galaxy star formation is coeval with rapid supermassive black hole accretion in the most distant universe. The two EVLA detections are ideal targets for further high-resolution imaging (e.g., with ALMA or EVLA observations) to study the gas distribution, dynamics, and SMBH-bulge mass relation in these earliest quasar-host galaxy systems.
1 Introduction
Observations of high-redshift quasars probe the growth of supermassive black holes (SMBH) and their connection to galaxy formation at the earliest cosmic epochs. The discovery of strong submillimeter/millimeter [(sub)mm] dust continuum in about 30% of the quasars known at z6 provides the first evidence of active star formation in young quasar host galaxies at the end of the reionization era (Bertoldi et al., 2003a, b; Petric et al., 2003; Priddey et al., 2003; Robson et al., 2004; Wang et al., 2007, 2008). The star formation rates estimated from the FIR luminosities (a few to ) are on the order of to , which are comparable to the typical values found in so-called submillimeter galaxies at (Scott et al., 2002; Greve et al., 2005; Kovcs et al., 2006). The spatially resolved [C II] line emission from one of the most FIR luminous z6 quasars, SDSS J114816.64+525150.3 (hereafter J1148+5251), further suggests a high star formation surface density of over the central 1.5 kpc region of the quasar host galaxy (Maiolino et al., 2005; Walter et al., 2009).
Molecular CO (6-5) line emission has been detected in ten of the FIR luminous z6 quasars (Bertoldi et al., 2003b; Walter et al., 2003; Carilli et al., 2007; Wang et al., 2010, 2011, in prep.), indicating the existence of highly-excited molecular gas in the quasar hosts. The CO (3-2), (6-5), and (7-6) transitions detected in the z=6.42 quasar J1148+5251 reveal a molecular gas component on scales of 5 kpc in the host galaxy with CO excitation conditions similar to those found in local starburst galaxies and CO-detected quasars at lower redshifts (Bertoldi et al., 2003b; Walter et al., 2004; Riechers et al., 2009).
Emission in the low-order CO transitions () from the z6 quasar host galaxies is poorly constrained due to the limited sensitivity and frequency coverage of the previous instruments (Wagg et al., 2008; Wang et al., 2010). The new Ka band receivers on the Expanded Very Large Array (EVLA, Perley et al., 2011) open an important frequency window for studies of the cold molecular gas in high-redshift galaxies (e.g., Ivison et al., 2010, 2011; Riechers et al., 2010). In this paper, we report our EVLA observations of the CO (2-1) line emission in five z6 quasars (Fan et al., 2004, 2006; Willott et al., 2010a, b) Three of them are from the Sloan Digital Sky Survey (SDSS, Fan et al., 2004, 2006), with two objects, SDSS J084035.09+562419.9 and SDSS J092721.82+200123.7, previously detected in strong () 250 GHz dust continuum and molecular CO (6-5) and (5-4) line emission. Another object, SDSS J162331.81+311200.5, was detected in the [C II] line, but undetected in millimeter dust continuum and high-J CO transitions (Bertoldi et al. 2011, in prep.). The other two objects are from the Canada-France High-z Quasar Survey (CFHQS, Willott et al., 2010a, b) and do not have published CO observations yet. One of them, CFHQS 142952.17+544717.6, was detected in 250 GHz dust continuum (Omont et al. 2011, in prep.). We describe the observations in Section 2, present the results in Section 3, and discuss the CO excitation and host galaxy evolution properties of the detections in Section 4. A -CDM cosmology with , and is adopted throughout this paper (Spergel et al., 2007).
2 Observations
The observations were carried out using the Ka-band receiver on the EVLA in 2010 in the D, DnC, and C configurations. The WIDAR correlator in Open Shared Risk Observing mode provided a maximum bandwidth of 128 MHz and a resolution of 2 MHz in each of the two basebands (A/C and B/D intermediate frequency [IF] bands). The A/C IFs could not be tuned below 32 GHz. The redshifts and observing frequencies of the CO (2-1) line of the five targets are estimated with previous detections of the CO (6-5), [C II], or quasar UV lines (Carilli et al. 2007; Wang et al. 2010; Bertoldi et al 2011, in prep.). For the three sources with redshifts of [corresponding to redshifted CO (2-1) line frequencies of GHz], we use the two 128 MHz IF pairs overlapped by 30 MHz and cover a total bandwidth of 226 MHz (i.e., 2000 in velocity and in redshift at )11110 MHz overlap and a total bandwidth of 246 MHz for J1429+5447.. For the other two objects with , we centered the 128 MHz window of the B/D IF pairs on the line frequency and observed the continuum at 32 GHz with the other window. The observing time is 15 to 20 hours for each of the five targets (see Table 1). Flux calibrations were performed using the standard VLA calibrators, 3C286 and 3C48, and we use 5-minute scan loops between targets and phase calibrators to calibrate the phase. The data were reduced with AIPS, and the spatial resolutions (FWHM) of the final images are typically 2′′ for data taken in the D configuration and 0.7′′ for the C configuration.
3 Result
CO (2-1) line emission has been detected in two of the five z6 quasars, J0927+2001 and J1429+5447, and marginally detected in J0840+5624. We present all the observing parameters and measurements in Table 1. The detailed results are listed below.
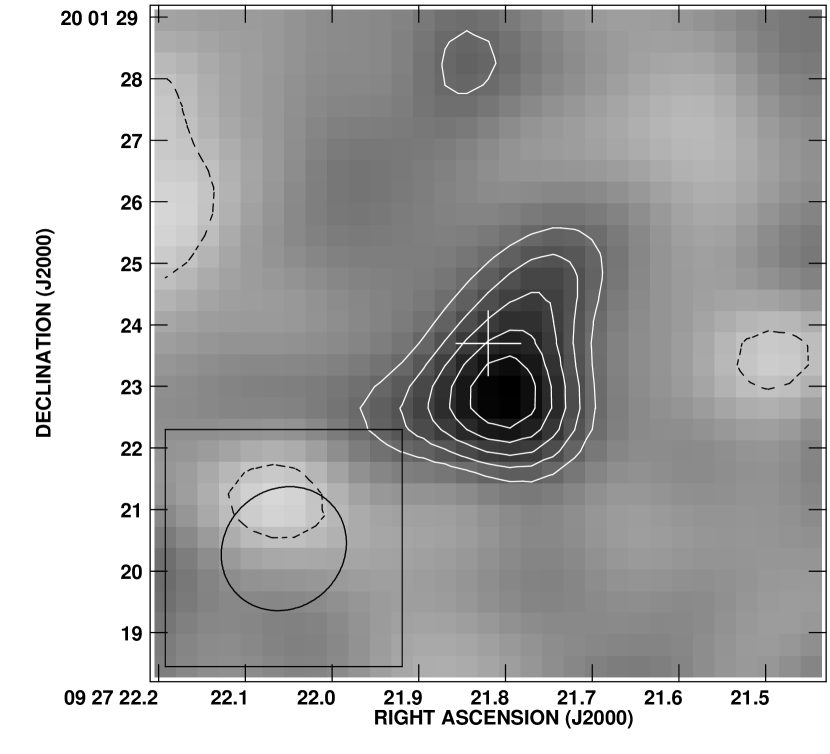
J0927+2001 Toward this source strong dust continuum at 850 GHz, 250 GHz, and 85 GHz, and CO (6-5) and (5-4) line emission were detected (Carilli et al., 2007; Wang et al., 2010). We have detected the CO (2-1) line and the emission distribution (averaged over a velocity range of 880 ) along with a spectrum is shown in Figure 2. The line peak emission centeroid is consistent with the optical quasar position and the peaks of the high-J CO lines. The line width (FWHM) and redshift fitted with a single Gaussian profile are and which are in good agreement with the measurements from the high-order CO transitions ( and , Carilli et al. 2007). The line emission appears marginally resolved by the synthesized beam with a peak surface brightness of and a total intensity of , with a source size of determined from a fit with a two-dimensional Gaussian distribution (the deconvolved source size is about , or ). The corresponding line fluxes and luminosities (Table 1) are higher than the upper limits estimated from previous GBT observations, but are still consistent given the large uncertainties and baseline feature contamination in the GBT data (Wagg et al., 2008; Wang et al., 2010).
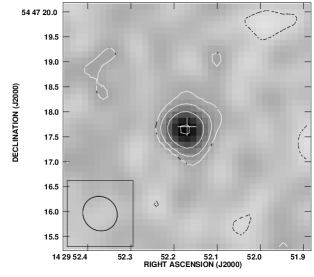
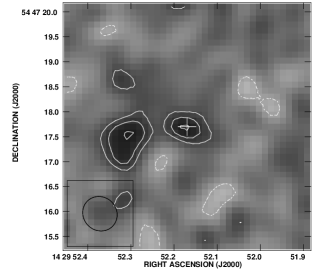
J1429+5447 Toward this object strong radio continuum emission was detected in the FIRST survey (Becker et al., 1995) and recent VLBI observations (Frey et al., 2011), making it the strongest radio source among the known z6 quasars and the most distant radio-loud quasar. It has also been detected in dust continuum at 250 GHz with a flux density of mJy (Omont et al. 2011, in prep.). We have detected both CO (2-1) line emission and continuum emission at the line frequency. The continuum source is unresolved by the synthesized beam and the flux density averaged over the line-free channels at 32 GHz is Jy. We subtract the continuum by performing linear fitting to the visibility data, using the UVLIN task in AIPS. The CO line emission is resolved into two peaks with a spatial separation of 1.2′′ (6.9 kpc at the quasar redshift), and the optical and radio quasar positions are consistent with the west peak (Figure 3). A Gaussian fit to the spectra yields a redshift of and a line width of for the west source, and and for the east source. The line fluxes estimated with the peak surface brightness on the velocity-averaged map averaging over a velocity range of are and for the west and east components, respectively. However, a two-dimensional Gaussian distribution fitted to the east component suggest possible extension with a source size of , which should be checked with deeper observations at higher spatial resolution.
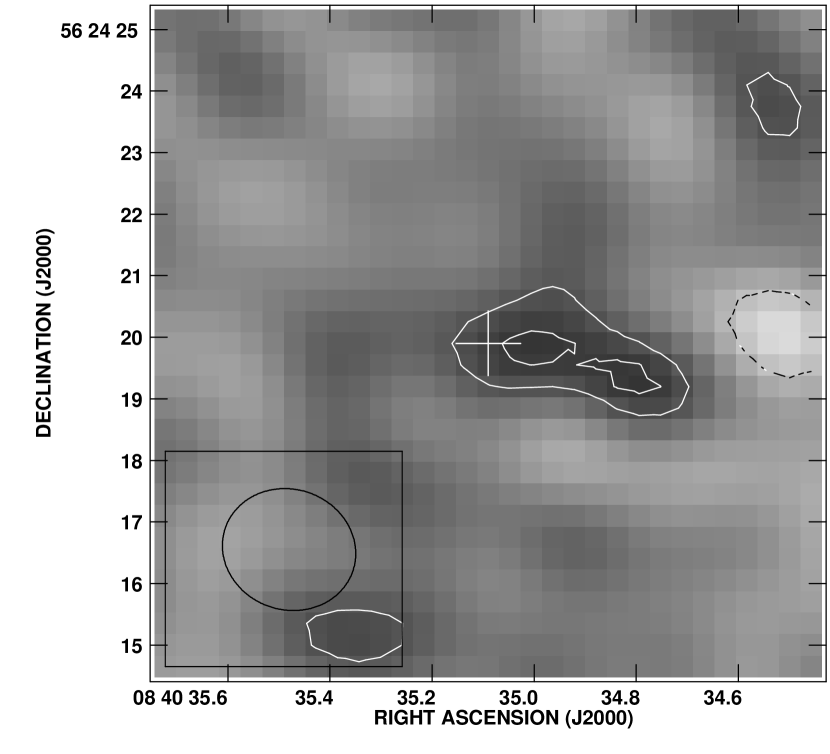
J0840+5624 This source was detected in (sub)mm dust continuum emission and CO (6-5) and (5-4) line emission; it has the broadest line width, , among the CO-detected z6 quasars (Wang et al., 2007, 2010). We observed the line at the redshift of derived from the high-order CO detections and find no clear detection in a velocity-averaged map averaging over 1070 made at the full resolution of . At a lower resolution of , marginal signal () appears on the map (Figure 1), with a double-peaked mophology along the east-west direction. The optical quasar position is 0.8′′ away from the east peak. We plot the spectrum at the position of east peak in the right panel of Figure 1, and there is only very marginal signal (1 to 2) over to , i.e., the typical velocity range of the CO (6-5) and (5-4) line emission (Wang et al., 2010). The CO (2-1) line flux estimated with the surface brightness of the east peak is (Table 1). However, the signal is indeed marginal and deeper observations with a wider bandwidth are required to improve the measurement.
J02100456 This object is the highest redshift quasar known to date with determined from the object’s line emission (Willott et al., 2010b). We searched for CO (2-1) line emission in the 128 MHz window centered at the redshift but did not detect it. Here we assume a line width of , which is the typical full width at zero intensity () value found with samples of high-z CO-detected quasars (Coppin et al., 2008; Wang et al., 2010) to estimate the upper limit of the line intensity. The rms noise level on the map averaged over this velocity range is , and the upper limit of the line flux is estimated as . The corresponding 3 upper limit of the line luminosity is (see equation (3) in Solomon & Vanden Bout 2005). However, we cannot rule out that the line emission is significantly offset from the quasar host galaxy redshift and CO (2-1) line falls outside the 128 MHz window. The continuum emission is also undetected with the other window centered at 32.1 GHz, and the channel-averaged map yields a 3 upper limit of .
J1623+3112 This object is detected in 158m fine structure line emission by Bertoldi et al. (2011, in prep.), but undetected in 250 GHz dust continuum (Wang et al., 2007). We searched for the CO (2-1) line in the 128 MHz-bandwidth window centered at the redshift of and did not detect the line. The rms on the map averaged over a velocity range of is . This yields a 3 upper limit of for the line flux and for the line luminosity. The 3 upper limit of the continuum emission at 35 GHz measured with A/C IFs is .
4 Discussion
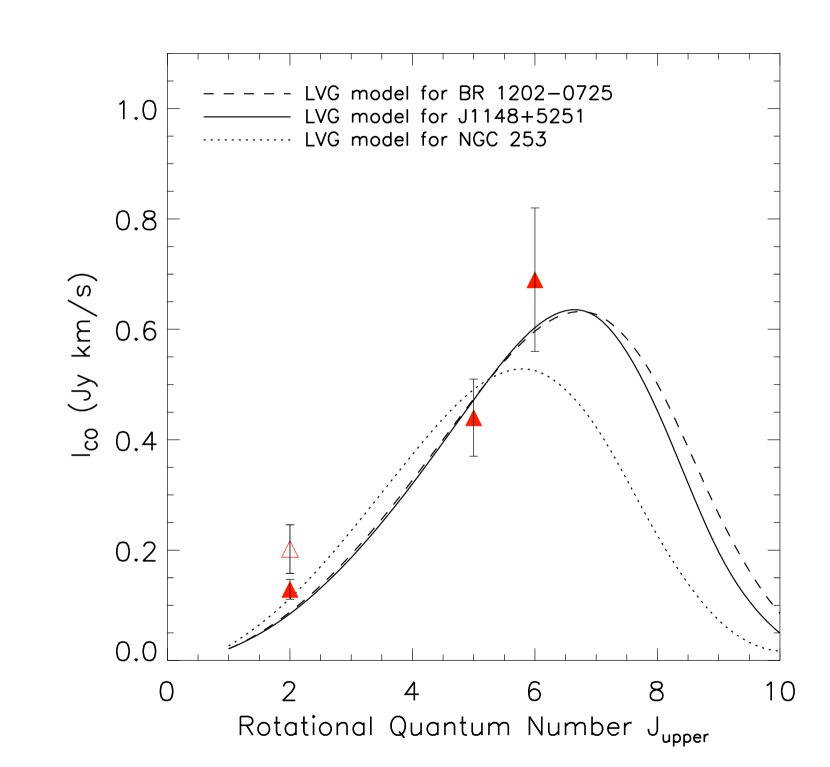
We have observed molecular CO (2-1) line emission toward five quasars at z6 using the EVLA, and detections/marginal detection have been obtained from the three objects that have strong FIR dust continuum emission. This is consistent with the picture of massive star formation fueling by huge amount of molecular gas in these young quasar hosts. The detection of in J1623+3112 is also likely to be a sign of star formation, but the current sensitivity of our EVLA observations cannot detect molecular CO from the host galaxy. J0927+2001 and J0840+5624, were previously detected strongly in the CO (6-5) and (5-4) transitions. CO (2-1) line emission has been detected and marginally resolved in the host galaxy of J0927+2001 over a scale of 10 kpc. The molecular gas masses () estimated from the CO (2-1) line peak surface brightness and the total intensity on the velocity-averaged map are listed in Table 1, assuming a CO luminosity-to-gas mass conversion factor of appropriate for local ultraluminous infrared galaxies (Solomon et al., 1997; Downes et al., 1998). These estimates are 1.7 and 2.5 times higher than the value of estimated from the high-order CO transitions (Carilli et al., 2007; Wang et al., 2010). We plot the CO excitation ladder of this source in Figure 4, together with the results of Large Velocity Gradient (LVG) modeling of the highly-excited molecular gas components (gas densities of order , kinetic temperatures of 50 to 60 K, and peak at ) found in other high-z FIR and CO luminous quasars and nearby starburst galaxies (Riechers et al., 2006, 2009; Güsten et al., 2006). We normalize the models to the high-order CO transitions. The CO (2-1) line flux measured with the peak surface brightness on the velocity-averaged map is consistent/marginally consistent with the values expected by these single-component models, while the total line flux integrated over the line-emitting area falls above all the models. This may suggest the exsitence of additional low excitation gas in the central region as was found in the submillimeter galaxy AzTEC-3 at z=5.3 (Riechers et al., 2010) and the nearby starburst galaxy M82 (Wei et al., 2005). However, there are still large uncertainties in the measurements of all the three transitions, and observations of other CO transitions are necessary to address if there are multiple CO excitation components in the quasar host galaxy. Our observations show no evidence of excess CO (2-1) line emission and additional low excitation component in the host galaxy of J0840+5624.
The C array imaging of the CO (2-1) line emission from J1429+5447 has resolved the molecular gas into two distinct peaks, with a spatial separation of 6.9 kpc; the quasar position is consistent with the West peak. There is no clear velocity offset () between the two components. These results suggest a gas-rich, major merging system with two distinct components that are comparable in CO luminosity and molecular gas mass. The west component of this system is in a radio-loud quasar phase. Similar quasar-starburst systems with multiple CO emission peaks were previously found in the CO luminous quasars BRI 12020725 at z=4.7 (Omont et al., 1996; Carilli et al., 2002), BRI 13350417 at z=4.4 (Riechers et al., 2008) and J1148+5251 at z=6.42 (Walter et al., 2004). These systems demonstrate the early phase of quasar-galaxy formation in which both AGN and starburst activities are triggered by major mergers and the molecular gas in the nuclear region is not fully coalesced (Narayanan et al., 2008). We will expect further high-resolution observations with the EVLA in C or B array to constrain the gas surface density and dynamics, and with ALMA or the PdBI to resolve the dust continuum and distributed star formation in these young quasar host galaxies.
References
- Becker et al. (1995) Becker, R. H., White, R. L., & Helfand, D. J. 1995, ApJ, 450, 559
- Bertoldi et al. (2003a) Bertoldi, F., Carilli, C. L., Cox, P., Fan, X., Strauss, M. A., Beelen, A., Omont, A., & Zylka, R., 2003a, A&A, 406, L55
- Bertoldi et al. (2003b) Bertoldi, F. et al. 2003b, A&A, 409, L47
- Carilli et al. (2002) Carilli, C. L. et al. 2002, AJ, 123, 1838
- Carilli et al. (2007) Carilli, C. L. et al. 2007, ApJ, 666, L9
- Coppin et al. (2008) Coppin, K. E. K. et al. 2008, MNRAS, 389, 45
- Downes et al. (1998) Downes, D., & Solomon, P. M. 1998, ApJ, 507, 615
- Fan et al. (2004) Fan, X. et al. 2004, AJ, 128, 515
- Fan et al. (2006) Fan, X. et al. 2006, AJ, 131, 1203
- Frey et al. (2011) Frey, S., Paragi, Z., Gurvits, L. I., Gabnyi, K. ., & Cseh, D. 2011, Proceedings of the 10th European VLBI Network Symposium
- Greve et al. (2005) Greve, T. R. et al. 2005, MNRAS, 359, 1165
- Güsten et al. (2006) Güsten, R., Philipp, S. D., Wei, A., Klein, B. 2006, A&A, 454, L115
- Ivison et al. (2010) Ivison, R. J., Smail, I., Papadopoulos, P. P., Wold, I., Richard, J., Swinbank, A. M., Kneib, J.-P., & Owen, F. N. 2010, MNRAS, 404, 198
- Ivison et al. (2011) Ivison, R. J., Papadopoulos, P. P., Smail, I., Greve, T. R., Thomson, A. P., Xilouris, E. M., & Chapman, S. C. 2011, MNRAS, 412, 1913
- Kovcs et al. (2006) Kovcs, A., Chapman, S. C., Dowell, C. D., Blain, A. W., Ivison, R. J., Smail, I., & Phillips, T. G., 2006, ApJ, 650, 592
- Maiolino et al. (2005) Maiolino, R. et al. 2005, A&A, 440, L51
- Narayanan et al. (2008) Narayanan, D. et al. 2008, ApJS, 174, 13
- Omont et al. (1996) Omont, A., Petitjean, P., Guilloteau, S., McMahon, R. G., Solomon, P. M., & Pcontal, E. 1996, Nature, 382, 428
- Petric et al. (2003) Petric, A. O., Carilli, C. L., Bertoldi, F., Fan, X., Cox, P., Strauss, M. A., Omont, A., & Schneider, D. P. 2003, AJ, 126, 15
- Perley et al. (2011) Perley, R.A., Chandler, C.J., Butler, B.J., Wrobel, J.M. 2011, ApJ Letters, in press.
- Priddey et al. (2003) Priddey, R. S., Isaak, K. G., McMahon, R. G., Roboson, E. I., & Pearson, C. P. 2003, MNRAS, 344, L74
- Riechers et al. (2006) Riechers, D. A. et al. 2006, ApJ, 650, 604
- Riechers et al. (2008) Riechers, D. A., Walter, F., Carilli, C. L., Bertoldi, F., & Momjian, E. 2008, ApJ, 686, L9
- Riechers et al. (2009) Riechers, D. A., et al. 2009, ApJ, 703, 1338
- Riechers et al. (2010) Riechers, D. A., et al. 2010, ApJ, 720, L131
- Robson et al. (2004) Robson, I., Priddey, R. S., Isaak, K. G., & McMahon, R. G. 2004, MNRAS, 351, L29
- Scott et al. (2002) Scott, S., E. et al. 2002, MNRAS, 331, 817
- Solomon et al. (1997) Solomon, P. M., Downes, D., Radford, S. J. E., & Barrett, J. W. 1997, ApJ, 478, 144
- Solomon & Vanden Bout (2005) Solomon, P. M., & Vanden Bout, P. A. 2005, ARA&A, 43, 677, SV05
- Spergel et al. (2007) Spergel, D. N. et al. 2007, ApJS, 170, 377
- Wagg et al. (2007) Wagg, J., Hughes, D. H., Aretxaga, I., Chapin, E. L., Dunlop, J. S., Gaztaaga, E., & Devlin, M. 2007, MNRAS, 375, 745
- Wagg et al. (2008) Wagg, J , Wang, R., Carilli, C., Walter, F., Maddalena, R. & Pisano D.J. 2008, GBT memo #256,
- Walter et al. (2003) Walter, F. et al. 2003, Nature, 424, 406
- Walter et al. (2004) Walter, F., Carilli, C. L., Bertoldi, F., Menten, K., Cox, P., Lo, K. Y., Fan, X., & Strauss, M. A. 2004, ApJ, 615, L17
- Walter et al. (2009) Walter, F., Riechers, D., Cox, P., Neri, R., Carilli, C., Bertoldi, F., Wei, A., & Maiolino, R. 2009, Nature, 457, 699
- Wang et al. (2007) Wang, R. et al. 2007, AJ, 134, 617
- Wang et al. (2008) Wang, R. et al. 2008, ApJ, 687, 848
- Wang et al. (2010) Wang, R. et al. 2010, ApJ, 714, 699
- Wei et al. (2005) Wei, A., Walter, F., & Scoville, N. Z. 2005, A&A, 438, 533
- Willott et al. (2010a) Willott, C. J. et al. 2010a, AJ, 139, 906
- Willott et al. (2010b) Willott, C. J. et al. 2010b, AJ, 140, 546
| Name | Configuration | Redshift | FWHM | Iv | |||
|---|---|---|---|---|---|---|---|
| hour | |||||||
| (1) | (2) | (3) | (4) | (5) | (6) | (7) | (8) |
| SDSS J092721.82+200123.7 | 20 | D, DnC | 5.77160.0012 | 590130 | 3.700.52c | 3.00.4c | |
| 0.2020.040d | 5.801.15d | 4.60.9d | |||||
| CFHQS J142952.17+544717.6We | 15 | C | 6.18310.0007 | 28070 | 0.0650.011 | 2.060.35 | 1.60.3 |
| CFHQS J142952.17+544717.6E | 15 | C | 6.18370.0015 | 400140 | 0.0500.013 | 1.590.41 | 1.30.3 |
| SDSS J084035.09+562419.9 | 20 | D, DnC, C | 5.8441b | 860b | 1.810.64 | 1.40.5 | |
| CFHQS J021013.19045620.9 | 15 | C | 6.438a | – | 0.038 | 1.28 | 1.0 |
| SDSS J162331.81+311200.5 | 20 | D | 6.26f | – | 1.6 |
aRedshift measured from the quasar line emission (Willott et al. 2010); bRedshift and CO line width measured from the CO (6-5) and (5-4) lines (Wang et al. 2010). cCO (2-1) line flux and luminosity derived from the peak surface brightness on the velocity-averaged map; dCO (2-1) line flux and luminosity derived from the total intensity integrated over the line-emitting area on the velocity-averaged map. eThe West component of J1429+5447 is consistent with the optical quasar position. fRedshift from the line detection (Bertoldi et al. 2011 in prep.)