Extended Cold Molecular Gas Reservoirs in 3.4 Submillimeter Galaxies
Abstract
We report the detection of spatially resolved CO(=10) emission in the 3.4 submillimeter galaxies (SMGs) SMM J09431+4700 and SMM J13120+4242, using the Expanded Very Large Array (EVLA). SMM J09431+4700 is resolved into the two previously reported millimeter sources H6 and H7, separated by 30 kpc in projection. We derive CO(=10) line luminosities of K km s-1 pc2 for H6 and H7, and K km s-1 pc2 for SMM J13120+4242. These are 1.5–4.5 higher than what is expected from simple excitation modeling of higher- CO lines, suggesting the presence of copious amounts of low-excitation gas. This is supported by the finding that the CO(=10) line in SMM J13120+4242, the system with lowest CO excitation, appears to have a broader profile and more extended spatial structure than seen in higher- CO lines (which is less prominently seen in SMM J09431+4700). Based on and excitation modeling, we find =2.0–4.3 and 4.7–12.71010 for H6 and H7, and =18.7–69.41010 for SMM J13120+4242. The observed CO(=10) properties are consistent with the picture that SMM J09431+4700 represents an early-stage, gas-rich major merger, and that SMM J13120+4242 represents such a system in an advanced stage. This study thus highlights the importance of spatially and dynamically resolved CO(=10) observations of SMGs to further understand the gas physics that drive star formation in these distant galaxies, which becomes possible only now that the EVLA rises to its full capabilities.
Subject headings:
galaxies: active — galaxies: starburst — galaxies: formation — galaxies: high-redshift — cosmology: observations — radio lines: galaxies1. Introduction
With star formation rates of typically 500 yr-1, submillimeter galaxies (SMGs) are the most intense starbursts known at early cosmic times (see review by Blain et al. 2002). A significant fraction of the stellar mass assembly in massive galaxies at high redshift is thought to occur at early epochs (2) on rapid timescales (100 Myr) through a dusty, gas-rich SMG phase (e.g., Greve et al. 2005), making SMGs the likely progenitors of massive galaxies in the present day universe.
A particularly useful probe to better understand the physical conditions for star formation in these extreme starbursts are studies of the molecular interstellar medium that fuels the formation of stars. Dense molecular gas traced through CO was detected in 34 SMGs to date, typically revealing gas reservoirs of few 1010 (see review by Solomon & Vanden Bout 2005). However, most of these detections are of CO rotational lines from 3 transitions, which may bias these studies toward highly-excited gas, and do not necessarily trace the entire molecular gas reservoir as traced by CO(=10). Indeed, recent studies hint at the presence of substantial amounts of low-excitation gas in some SMGs (e.g., Hainline et al. 2006; Carilli et al. 2010; Harris et al. 2010; Ivison et al. 2010; Riechers et al. 2010a). Unfortunately, previous CO(=10) studies in SMGs (which do not suffer from excitation bias) were either carried out with single-dish telesopes lacking spatial information, or with the old correlator of the Very Large Array (VLA) lacking detailed spectral information.
To overcome the limitations of previous studies, we have initiated a systematic study of the CO(=10) content of SMGs and other galaxy populations with the Expanded Very Large Array (EVLA; Perley et al. 2011). We here report early results on two 3.4 SMGs that appear to trace different stages of gas-rich, major mergers only 1.9 Gyr after the Big Bang. SMM J09431+4700 (=3.346) hosts two SMGs detected in 4 CO emission, separated by 30 kpc in projection, likely representing an early phase of a merger (e.g., Tacconi et al. 2006; Engel et al. 2010). SMM J13120+4242 (=3.408) shows a complex, disturbed structure in CO(=65), suggesting that it may represent an advanced-stage merger (Engel et al. 2010). We use a concordance, flat CDM cosmology throughout, with =71 km s-1 Mpc-1, =0.27, and =0.73 (Spergel et al. 2003, 2007).
2. Observations
We observed the CO(=10) ( GHz) emission line toward SMM J09431+4700 and SMM J13120+4242, using the EVLA. At =3.346 and 3.408, this line is redshifted to 26.5235 and 26.1505 GHz (1.14 cm; band). Observations were carried out under good weather conditions in D array on 2010 May 19 and in C array between 2010 December 16 and 2011 January 19, resulting in 4.0 hr (2.0 hr) total (on-source) observing time for SMM J09431+4700 (C array), and 7.5 hr (4.6 hr) for SMM J13120+4242 (C+D array). The nearby quasars J0920+4441 and J1312+4828 were observed every 4 to 7 minutes for pointing, secondary amplitude and phase calibration. For primary flux calibration, the standard calibrator 3C286 was observed, leading to a calibration that is accurate within 10%. Observations were set up using a total bandwidth of 252 MHz (dual polarization; corresponding to 2900 km s-1 at 1.14 cm) with the WIDAR correlator.
For data reduction and analysis, the AIPS package was used. All data were mapped using ‘natural’ weighting. The data result in a final rms of 105 and 70 Jy beam-1 per 45 km s-1 (4 MHz) channel for SMM J09431+4700 and SMM J13120+4242, respectively. Maps of the velocity-integrated CO =10 line emission yield synthesized clean beam sizes of 0.91′′0.81′′ and 1.01′′0.72′′ at rms noise levels of 30 and 12 Jy beam-1 over 543 and 1513 km s-1 (48 and 132 MHz) for SMM J09431+4700 and SMM J13120+4242.
3. Results

3.1. SMM J09431+4700
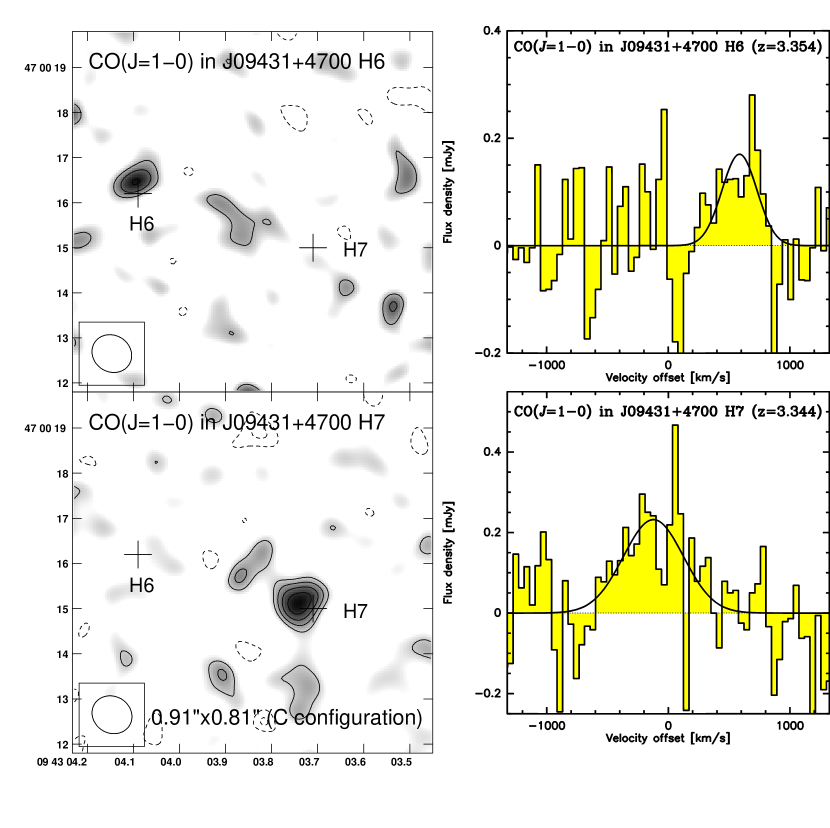
We detected spatially resolved CO(=10) emission toward SMM J09431+4700. The emission is resolved into two components that are separated by 30 kpc in projection, and are identified with the radio/millimeter continuum sources H6 and H7 (Fig. 1). Component H7 appears marginally resolved at the 6.5 kpc resolution of our observations, suggesting an approximate source radius of 31 kpc. This suggests that the CO(=10) line emission may be somewhat more extended than what is observed in higher- lines (1.850.60 and 1.130.23 kpc in the CO =43 and 65 lines; Engel et al. 2010). Component H6 appears unresolved at the moderate achieved signal–to–noise ratio. There is marginal evidence for some low surface brightness emission in between H6 and H7, but more sensitive observations are required to investigate this in more detail. We do not detect continuum emission toward either component down to a 3 limit of 44 Jy beam-1 at 1.1 cm (rest-frame 2.6 mm), consistent with the spectral energy distribution of this source.
From Gaussian fitting to the line profiles of H6 and H7, we obtain line peak strengths of =17058 and 23247 Jy at line FWHMs of d=339136 and 580143 km s-1, centered at redshifts of =3.35450.0009 and =3.34420.0009, respectively. The line widths correspond to 1.9 (H6) and 1.5 (H7) those measured in CO(=65) (Engel et al. 2010). The line parameters for H6 and H7 correspond to velocity-integrated emission line strengths of =0.0610.021 and 0.1430.030 Jy km s-1, suggesting CO(=10) line luminosities of =(2.490.86) and (5.821.22) 1010 (/1.2)-1 K km s-1 pc2 (where =1.2 is the lensing magnification factor; this SMG is located behind the galaxy cluster A851; Cowie et al. 2002).
3.2. SMM J13120+4242
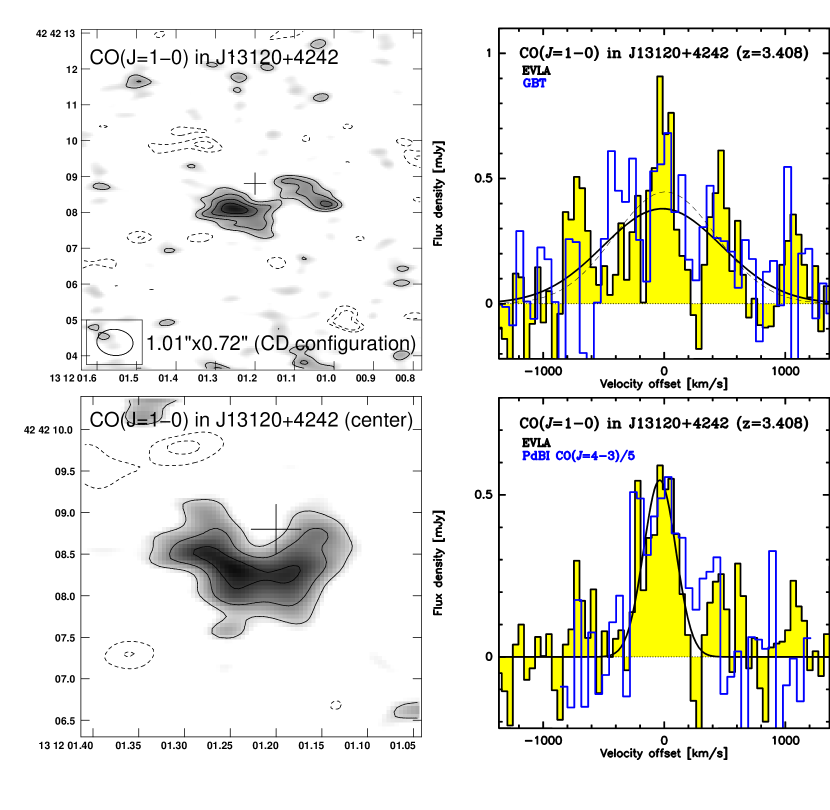
We detected spatially resolved CO(=10) emission toward SMM J13120+4242. The emission peaks on a (2.0′′0.6′′)(0.9′′0.4′′) (15.06.7 kpc2) size region (Fig. 2, bottom). The line profile averaged over this region is consistent with that seen in the CO(=43) line (empty histogram in Fig. 2, bottom; Greve et al. 2005), and its complex morphological structure is consistent with what is seen in CO(=65) line emission (Engel et al. 2010). This component, however, carries only 40% of the observed CO(=10) line flux, and appears to be embedded in a kinematically a few times broader component that extends out to 2 larger scales (Fig. 2, top). The line profile over this whole extended structure appears to consist of multiple peaks. For consistency, we fit the line with a Gaussian profile, yielding =38065 Jy and d=1153235 km s-1, and =0.4640.081 Jy km s-1, centered at =3.40780.0014. Within the relative uncertainties, the line profile and parameters are consistent with a single-dish measurement of this line, carried out with the Green Bank Telescope at 28′′ resolution (empty histogram and dashed curve in Fig. 2, top; Hainline et al. 2006). This suggests that the large apparent spatial extent of the CO(=10) emission is real, and that virtually all line flux is recovered in the EVLA map. The line FWHM corresponds to 2.2 and 1.3 those measured in the CO(=43) and CO(=65) lines. We do not detect any rest-frame 2.6 mm continuum emission down to a 3 limit of 60 Jy beam-1, consistent with the spectral energy distribution of this source. Averaged over the full region where CO(=10) line emission is detected, this suggests a conservative 3 limit of 270 Jy. From the line intensity, we derive =(23.44.1) 1010 K km s-1 pc2.
4. Analysis
4.1. Line Excitation Modeling
Besides the EVLA CO(=10) observations presented here, SMM J09431+4700 and SMM J13120+4242 were studied in CO(=43) and CO(=65) line emission (see Engel et al. 2010 for a summary of previous studies). Based on the observed CO excitation ladders, we can constrain the line radiative transfer through Large Velocity Gradient (LVG) models, treating the gas kinetic temperature and density as free parameters. For all calculations, the H2 ortho–to–para ratio was fixed to 3:1, the cosmic microwave background temperature was fixed to 11.84 and 12.01 K (at =3.346 and 3.408), and the Flower (2001) CO collision rates were used. We adopted a CO abundance per velocity gradient of [CO]/(( km s-1)-1 (e.g., Weiß et al. 2005a, 2007; Riechers et al. 2006). Components H6 and H7 of SMM J09431+4700 are fitted individually.
The sources are poorly fit by single-component models, which underpredict the observed CO(=10) fluxes by factors of 1.5–4.5 when fitted to the higher- lines.111Given the limited constraints on H6, this source can be marginally fit with a single component. The data for all sources can be fitted reasonably well with two gas components, which are represented by a ‘diffuse’, low-excitation component with a kinetic temperature of =25 K and a gas density of =102.5 cm-3, and a more ‘dense’, high-excitation component with =40 K (comparable to the dust temperature in SMM J13120+4242; Kovács et al. 2006) and =104.3 cm-3 in our models (=104.2 cm-3 is used for H7, as it provides a slightly better fit). The two gas components differ in relative strength between the sources (Fig. 3). For H6 and H7, we find that the dense gas components have surface filling factors of 13% and 7% relative to the low-excitation component. For SMM J13120+4242, we find that only 2% of the surface area associated with emission from the low-excitation component also shows emission from the dense gas component. This suggests that only a small fraction of the volume in these galaxies occupied by gas is associated with dense regions. Also, these model parameters suggest that the low-excitation gas components fill a dominant fraction of the area over which the sources are resolved in these observations.
The physical properties of the low-excitation gas components in these models are comparable to those of the gas in nearby spiral galaxies and ‘normal’ high- star-forming galaxies (e.g., Dannerbauer et al. 2009) and the low-excitation components found in other SMGs (e.g., Carilli et al. 2010; Riechers et al. 2010a). The properties of the high-excitation components are also comparable to what is found in other SMGs, ultra-luminous infrared galaxy (ULIRG) nuclei, and high- FIR-luminous quasars (e.g., Riechers et al. 2006, 2009; Weiß et al. 2005b). However, it appears that the relative fractions of low- and high-excitation gas differ between individual systems, perhaps due to different evolutionary stages.
4.2. Gas Masses and Surface Densities, Dynamical Masses, Gas Mass Fractions
Based on the observed CO(=10) line luminosities, we can derive the total masses of the gas reservoirs in our targets. For SMGs, a ULIRG-like conversion factor of =/=0.8 (K km s-1 pc2)-1 is commonly adopted (e.g., Downes & Solomon 1998; Tacconi et al. 2008). This suggests =2.0 and 4.71010 (/1.2)-1 for SMM J09431+4700 H6 and H7, and =18.71010 for SMM J13120+4242, respectively. However, a low, ULIRG-like conversion factor may not be appropriate for the low-excitation gas components suggested by our models. Assuming =3.5 (K km s-1 pc2)-1 for these components (as suggested for gas components with comparable excitation found in disk-like high- galaxies; e.g., Daddi et al. 2010), we find =4.3 and 12.71010 (/1.2)-1 for SMM J09431+4700 H6 and H7, and =69.41010 for SMM J13120+4242, respectively.
Assuming FWHM radii of 3 kpc for SMM J09431+4700 H6 and H7, the gas masses correspond to average gas surface densities of =700–1500 and 1600–4500 pc-2. The CO(=10) emission in SMM J13120+4242 is distributed over a projected area of 200 kpc2, corresponding to =960–3600 pc-2.
SMM J13120+4242 has a stellar mass of =10.2–13.51010 (Engel et al. 2010). This yields a baryonic gas mass fraction of =/(+)=0.58–0.87, where the spread of values represents the difference in conversion factors as outlined above.
Using the “isotropic virial estimator” (e.g., Tacconi et al. 2008; Engel et al. 2010), we can also estimate the dynamical masses of our targets. Assuming FWHM radii of 3 kpc for SMM J09431+4700 H6 and H7, we find =9.7 and 28.31010 , respectively. This corresponds to gas mass fractions =/=0.21–0.45 and 0.16–0.45 for H6 and H7, where the spread of values represents the use of different conversion factors as outlined above. This lies within the typical range of values estimated for SMGs (e.g., Tacconi et al. 2006, 2008). The CO(=10) emission in SMM J13120+4242 is spread over an area with a characteristic radius of 7.9 kpc. Assuming that the multiple peaks can be described by a single potential that is represented correctly by the FWHM on the Gaussian fit used above, we find =2901010 for SMM J13120+4242. This corresponds to =0.06–0.24. Under the assumption that the system is gravitationally bound, and that + corresponds to the bulk of baryonic matter in this system (the contributions of dust and black hole mass are expected to be minor), this would imply that this SMG is dominated by dark matter. However, given the complex velocity structure of this system, we consider it likely that is overestimated by a factor of 2–3 with this simplified approach. Thus, we consider the gas fraction for SMM J13120+4242 a lower limit.
4.3. Origin of the Molecular Line Emission
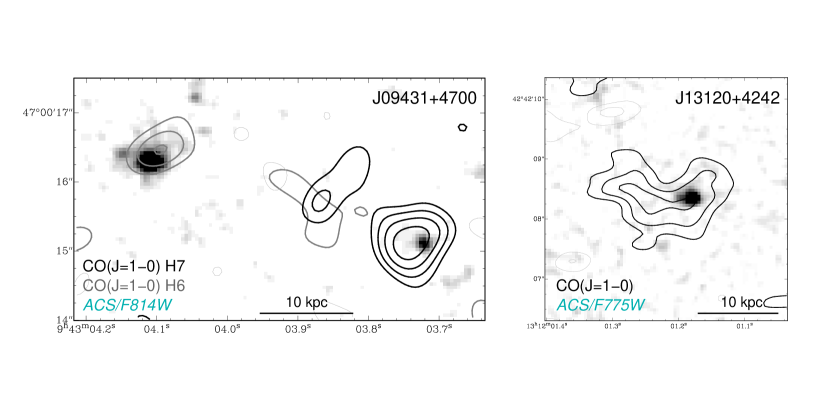
SMM J13120+4242 and both components of SMM J09431+4700 are associated with galaxies detected with the Hubble Space Telescope in rest-frame optical/ultraviolet light (Fig. 4). H7, the more CO-luminous component of SMM J13120+4242, is not significantly detected in -band images of this source (Tacconi et al. 2006), which may indicate that it is more obscured than H6. The CO emission centroids in H6 and H7 are offset by 1.5 kpc (0.2′′) from the centers of the optical emission, but are clearly associated with fainter, potentially more obscured regions in the galaxies. The optical emission in SMM J13120+4242 appears to be associated with one of the CO peaks in the central region, and thus, potentially with one component of a major merger (or a region of low dust obscuration).
5. Discussion
We have detected spatially resolved CO(=10) emission toward the 3.4 SMGs SMM J09431+4700 and SMM J13120+4242. We resolve the gas reservoirs down to 5 kpc scales (given the sizes of our synthesized beams). CO(=10) emission in SMM J09431+4700 is detected toward both radio/millimeter continuum sources H6 and H7, which have been detected in higher- CO lines in earlier work. There is marginal evidence for additional CO(=10) emission in between the two sources, which are separated by 30 kpc in projection. This, and their proximity in redshift (d0.01) is consistent with the picture that this SMG is undergoing an early stage massive, gas-rich merger (see also Engel et al. 2010). The CO(=10) line in H7, the more CO-luminous component, appears to show a 50% larger line width and size relative to what is measured in higher- CO lines, but the values are marginally consistent within the relative uncertainties.
The CO(=10) emission in SMM J13120+4242 shows a bright central peak that appears to be associated with the emission that dominates the flux in higher- CO lines. It also shows 2 broader emission (as also seen in single-dish observations at low spatial resolution; Hainline et al. 2006) distributed over several peaks that extends out to 15 kpc scales, but appears to be faint in higher- CO lines. Thus, the EVLA CO(=10) observations reveal a spatially resolved CO excitation gradient in this SMG. This may suggest that this SMG is in an advanced stage of a merger, where the warm and dense, highly excited gas component predominantly arises from a starburst in the “overlap” region of two gas-rich galaxies, and the broader, more extended, less highly excited gas is associated with tidal structure redistributed by the merger. More sensitive observations are required to study the dynamical structure of this complex system in more detail.
The CO(=10) properties of SMM J13120+4242 contrast those of high- quasars, which appear to be dominated by less extended (5 kpc), highly excited molecular gas reservoirs, with only little evidence for low-excitation gas (e.g., Riechers et al. 2006; 2009; 2011a; Weiß et al. 2007). They also contrast those of lensed 3 Lyman-break galaxies, which typically have an order of magnitude less massive, compact (1–2 kpc) CO(=10) reservoirs (Riechers et al. 2010b; see also higher- CO observations by Baker et al. 2004; Coppin et al. 2007). Massive, gas-rich star-forming galaxies can host gas reservoirs comparable in extent to those found in our target SMGs, but their spatial and velocity structure typically appears more symmetric and ordered (e.g., Daddi et al. 2010). Also, their overall CO excitation appears to be lower (Dannerbauer et al. 2009; Aravena et al. 2010). Low CO excitation was also found in the =1.44 SMG HR10, which was initially selected as an Extremely Red Object (ERO; Andreani et al. 2000; Papadopoulos & Ivison 2002; Greve et al. 2003).
The new CO(=10) observations of the 3.4 SMGs SMM J09431+4700 and SMM J13120+4242 provide supporting evidence that they represent early and advanced stage, gas-rich major mergers. Recent, lower resolution CO(=10) studies of the 20 kpc separation merger SMM J123707+6214 (=2.488; Ivison et al. 2011; Riechers et al. 2011b) may suggest an intermediate merger stage (with two separated components, but closer in projected distance and redshift than in SMM J09431+4700), in between those observed in these two targets. These EVLA observations thus may be a first step toward establishing a molecular gas-based “merger sequence” for gas-rich starburst galaxies at high redshift, which may crucially constrain formation models of SMGs (e.g., Davé et al. 2010; Hayward et al. 2011).
If the CO(=10) properties of the 3.4 systems studied here are representative of their parent population, SMGs in advanced merger stages exhibit substantially more extended, broader low- CO line emission than in earlier merger stages. Observations of high- CO line emission alone will underestimate the gas content and extent of the tidal structure in advanced-stage mergers, yielding an incomplete picture of the processes that drive the gas dynamics in such systems.
The observations presented here thus show the key importance of spatially and dynamically resolved CO(=10) observations of SMGs to understand the gas physics that drive star formation in these luminous, massive gas-rich high redshift galaxies. In combination with higher- CO line observations with shorter wavelength interferometers such as the upcoming Atacama Large (sub)Millimeter Array (ALMA), this makes the EVLA a uniquely powerful tool to distinguish different high- galaxy populations based on their molecular gas content.
References
- Andreani et al. (2000) Andreani, P., Cimatti, A., Loinard, L., & Röttgering, H. 2000, A&A, 354, L1
- Aravena et al. (2010) Aravena, M., et al. 2010, ApJ, 718, 177
- Baker et al. (2004) Baker, A. J., et al. 2004, ApJ, 604, 125
- Blain et al. (2002) Blain, A. W., et al. 2002, PhR, 369, 111
- Carilli et al. (2010) Carilli, C. L., Daddi, E., Riechers, D., et al. 2010, ApJ, 714, 1407
- Coppin et al. (2007) Coppin, K., et al. 2007, ApJ, 665, 936
- Cowie et al. (2002) Cowie, L. L., Barger, A. J., & Kneib, J.-P. 2002, AJ, 123, 2197
- Daddi et al. (2010) Daddi, E., et al. 2010, ApJ, 713, 686
- Dannerbauer et al. (2009) Dannerbauer, H., Daddi, E., Riechers, D., et al. 2009, ApJ, 698, L178
- Dave et al. (2010) Davé, R., Finlator, K, Oppenheimer, B., Fardal, M., Katz, N., Keres, D., & Weinberg, D. H. 2010, MNRAS, 404, 1355
- Downes & Solomon (1998) Downes, D., & Solomon, P. M. 1998, ApJ, 507, 615
- Engel et al. (2010) Engel, H., et al. 2010, ApJ, 724, 233
- Flower (2001) Flower, D. R. 2001, J. Phys. B: At. Mol. Opt. Phys., 34, 2731
- Greve et al. (2003) Greve, T. R., Ivison, R. J., & Papadopoulos, P. P. 2003, ApJ, 599, 839
- Greve et al. (2005) Greve, T. R., et al. 2005, MNRAS, 359, 1165
- Hainline et al. (2006) Hainline, L. J., Blain, A. W., Greve, T. R., Chapman, S. C., Smail, I., & Ivison, R. J. 2006, ApJ, 650, 614
- Harris et al. (2010) Harris, A. I., Baker, A. J., Zonak, S. G., Sharon, C. E., Genzel, R., Rauch, K., Watts, G., & Creager, R. 2010, ApJ, 723, 1139
- Hayward et al. (2011) Hayward, C. C., Keres, D., Jonsson, P., Narayanan, D., Cox, T. J., & Hernquist, L. 2011, ApJ, submitted (arXiv:1101.0002)
- Ivison et al. (2010) Ivison, R. J., et al. 2010, MNRAS, 404, 198
- Ivison et al. (2011) Ivison, R. J., Papadopoulos, P. P., Smail, I., Greve, T. R., Thomson, A. P., Xilouris, E. M., & Chapman, S. C. 2011, MNRAS, 412, 1913
- Kovács et al. (2006) Kovács, A., et al. 2006, ApJ, 650, 592
- McGrath et al. (2008) McGrath, E. J., Stockton, A., Canalizo, G., Iye, M., & Maihara, T. 2008, ApJ, 682, 303
- Papadopoulos & Ivison (2002) Papadopoulos, P. P., & Ivison, R. J. 2002, ApJ, 564, L9
- Perley et al. (2011) Perley, R. A., Chandler, C. J., Butler, B. J., & Wrobel, J. M. 2011 , ApJL, in press (this volume)
- Riechers et al. (2006) Riechers, D. A., et al. 2006, ApJ, 650, 604
- Riechers et al. (2009) Riechers, D. A., et al. 2009, ApJ, 703, 1338
- Riechers et al. (2010a) Riechers, D. A., et al. 2010a, ApJ, 720, L131
- Riechers et al. (2010b) Riechers, D. A., Carilli, C. L., Walter, F., & Momjian, E. 2010b, ApJ, 724, L153
- Riechers et al. (2011a) Riechers, D. A., et al. 2011a, ApJL, submitted (this volume)
- Riechers et al. (2011b) Riechers, D. A., Carilli, C. L., Walter, F., Weiß, A., Wagg, J., Bertoldi, F., Downes, D., Henkel, C., & Hodge, J. 2011b, ApJ, 733, L11
- Solomon & Vanden Bout (2005) Solomon, P. M., & Vanden Bout, P. A. 2005, ARA&A, 43, 677
- Spergel et al. (2003) Spergel, D. N., et al. 2003, ApJS, 148, 175
- Spergel et al. (2007) Spergel, D. N., et al. 2007, ApJS, 170, 377
- Tacconi et al. (2006) Tacconi, L. J., et al. 2006, ApJ, 640, 228
- Tacconi et al. (2008) Tacconi, L. J., et al. 2008, ApJ, 680, 246
- Weiß et al. (2005a) Weiß, A., Walter, F., & Scoville, N. Z. 2005a, A&A, 438, 533
- Weiß et al. (2005b) Weiß, A., et al. 2005b, A&A, 440, L45
- Weiß et al. (2007) Weiß, A., et al. 2007, A&A, 467, 955