Birth and growth of cavitation bubbles within
water under tension confined in a simple synthetic tree
Abstract
Water under tension, as can be found in several systems including tree vessels, is metastable. Cavitation can spontaneously occur, nucleating a bubble. We investigate the dynamics of spontaneous or triggered cavitation inside water filled microcavities of a hydrogel. Results show that a stable bubble is created in only a microsecond timescale, after transient oscillations. Then, a diffusion driven expansion leads to filling of the cavity. Analysis reveals that the nucleation of a bubble releases a tension of several tens of MPa, and a simple model captures the different time scales of the expansion process.
The dynamics of cavitation is a well studied process in free liquids (cavitation in the wake of propellers for instance), while cavitation in a microscopic confinement only recently received more attention. One important area of research is the transport of sap in trees and the potential blockage of this transport due to cavitation: these events can stop circulation of water in the vessels of real treesTyree2003 ; Cochard2006 , or in synthetic ones that are used for microfluidic flow transport driven by evaporation Wheeler2008 ; Noblin2008 ; Moreau2009 .
The stability of water at negative pressure, i.e. under tension (seeHerbert2006 for a review), can be tested with hydrogels where the tension is fixed through the relative humidity of the surrounding medium Wheeler2008 ; Wheeler2009 . However, such a method features only the final equilibrium state, and does not reveal about the cavitation process itself. The dynamics of cavitation involves fast time scales that are not known, apart from the fact that they are suspected to generate vibrations (noises in trees Tyree1983 ).
In this study we resolve the dynamics of cavitation of water inside hydrogel cavities. Cavitation can occur spontaneously or be triggered by a disturbance created by a laser pulse. The dynamics of the nucleated bubble and hydrogel cavity are recorded with a high-speed camera or a photodiode.
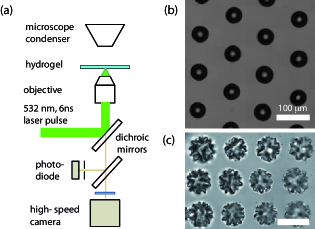
We use pHEMA hydrogels of the same chemical composition as inWheeler2008 ; Wheeler2009 , but with a periodic array of holes or cavities, created using the novel experimental setup shown in Fig. 1a. An Nd:YAG laser ( nm, ns) is coupled to an inverted microscope. The laser pulses are focused by a 40x water immersion microscope objective inside a thin layer of partially polymerized hydrogel that has been precured with UV light (dimensions 1.5 1.5 cm1 mm). The hydrogel sample is bounded by two microscope coverslides separated by PDMS spacers. A single cavity is created after a laser-induced optical breakdown inside the hydrogel sample. The system is coupled to an automated translation stage that allows the design of a regular array of holes. The shape of the cavities strongly depends on the degree of polymerisation of the hydrogel: while they are smooth and spherical for low pre-polymerisation, they tend to form "cauliflower" shapes when more cured (Fig. 1b,c), in a manner very similar to what is observed when forcing air in a polyacrylamide gelKundu2009 . Finally, the hydrogel is fully polymerized (Fig. 1b). To fill the the cavities with water, the hydrogel is boiled with water for a few days, and soaked in degazed DI water.
As the hydrogel samples are dried, water is set under tension because of evaporation. Cavitation spontaneously occurs when tension is strong enough, or can be directly triggered with laser pulses, focused in the hydrogel, in vicinity of water filled voids. The gel is sometimes slightly altered (apparition of grey spot, Fig. 2a). We speculate that a mild pressure wave is created, travels over the microcavity and thereby increases the liquid tension for a brief moment. This mechanical disturbance in the hydrogel is able to trigger cavitation in neighboring microcavities, if under tension. The dynamics of cavitation is recorded with a high-speed camera at frame rates of up to 432,000 frames per second, with an exposure time of 1 s. In addition, the central part of the image can be projected simultaneously onto a photodiode with a rise time of 0.03 s and bandwidth of 12 MHz, providing a measurement of the mean intensity in order to access faster dynamics.
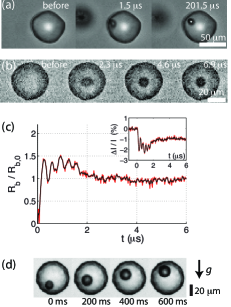
Fast time scales Our recordings reveal that a single bubble is nucleated, and that its volume quickly reaches a finite value, within 1 or 2 microseconds (Fig. 2a-c). We captured the first image of the nucleated bubble after a delay of 1 s after arrival of the laser pulse. If these images are motion blurred due to the exposure time of 1s, they show a transient non-spherical shape, see second image of Fig 2b. On the photo-diode signal we record transient high-frequency oscillations at typically several MHz, that we interpret as oscillations of the radius in Fig 2c, with an initial velocity as fast as 30 m/s. We assumed the variation in light intensity to be proportional to the apparent bubble area on images.
The following images of the high-speed recording show that the bubble after nucleation reaches a temporary equilibrium radius and then slowly grows. This is in contrast to cavitation nucleation in a free liquid, where the bubble expands to a maximum size and then rapidly collapses due to the pressure of the surrounding liquid. Experiments with an observation from the side also evidence that bubbles rise due to their buoyancy (Fig. 2d), meaning they are not attached by a contact line and are quickly spherical.
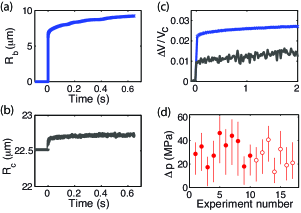
The instantaneous volume of the bubble () and of the cavity () are obtained by extracting an effective radius from image analysis (Fig. 3), consisting in tracing iso-values lines on grey levels bitmaps. Interestingly, the volume of liquid just after nucleation decreases. This is due to the compressibility of water, which has an adiabatic bulk modulus 111At C, The adiabatic and isothermal compressibilities of water are very close and differ less than 1 percent. Their variation with pressure is also small: about 2.5 percents each 10 MPa. GPa at C. Therefore, the variation of liquid volume gives information on the pressure change in the liquid:
| (1) |
We performed this analysis for a total of thirteen bubbles, see Fig. 3, showing that the released pressure amounts to values ranging within the tens of MPa range ( MPa MPa). Due to the measurement error in the image analysis, the estimated pressure presents a lot of uncertainty, but is comparable to that measured for cavitation in static hydrogels with the same composition (22 MPa) Wheeler2008 ; Wheeler2009 , and to other experimental methodsHerbert2006 . Note that the pressure released by triggered cavitation is of the same order than with spontaneous cavitation (Fig 3d). Indeed, the laser perturbation is not very large, and in order to trigger cavitation we had to wait for the pressure to be close to the spontaneous threshold, i.e. when cavitation occurs spontaneously on nearby cavities.
From this pressure, the stored elastic energy of water can be evaluated to be . If all this energy was released into kinetic energy, writing for a bubble in liquidLeighton1994 of density , we could expect bubble oscillations with maximum velocity 100 m/s, and a characteristic time of 0.1 s only (for a cavity such that =10 m, =40 m). This time is of the same order than the observed initial relaxation time of the light intensity signal (0.3 ). The system shows oscillations that are rapidly damped, probably because of dissipation in the gel surrounding the microcavities, besides viscous dissipation in water or acoustic emissions.
One may wonder about the content of the cavitation bubble. After cavitation, the bubble quickly fills with water vapor, which has a diffusion coefficient m2s-1. With the initial size of the bubble, the typical vapor filling time is s, thus longer than initial dynamics. Then it also probably fills with air, that was dissolved in water and in the hydrogel. These processes might slightly change the pressure inside the bubble, but cannot account for the continuous post-nucleation expansion of the cavitation bubble.
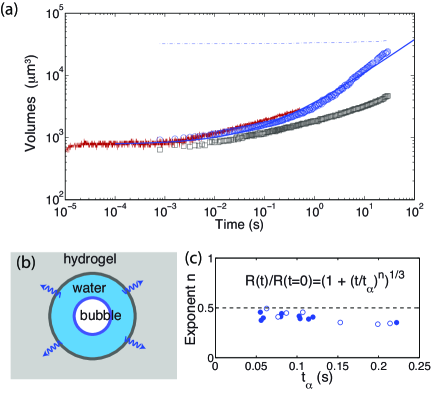
Long time scales. Indeed, after its fast expansion to the volume , the bubble is not static but slowly grows, until it completely fills the cavity, after a time of approximately 100 s. To quantify this growth, we analysed the evolution of the volumes of the cavity and of the bubble versus time (Fig. 4). The bubble expansion versus time follows a power law over more than 5 decades of time, with exponents in the range 0.35 to 0.45 (Fig. 4c).
Neglecting evaporation, there are only two ways to make the bubble grow: increase the volume of the cavity or transfer liquid from the cavity to the gel. The analysis of shows that the size of the cavity indeed increases with time (Fig. 3c). However, since the bubble eventually fills the whole cavity, an outwards flow of water must occur.
We developed a simple model to account for the power-law expansion of the cavitation bubble. In the following, we will only describe the growth of the bubble by flow in the gel and hypothesize a constant cavity volume.
When cavitation occurs, the pressure in the liquid suddenly relaxes from a homogeneous negative value , to a local value with the capillary pressure due to water surface tension, and the gas pressure inside the bubble. We then have . This locally changes the osmotic pressure in the gel near the surface of the cavity, where is the external isotropic stress (here being constant, equal to atmospheric pressure). Incidently, a gradient of osmotic pressure develops across the gel, entailing water fluxes which follow Darcy’s law with the permeability, the viscosity, the polymer volume fraction.
The conservation of mass implies222Conservation of mass for the polymer implies for an elementary hydrogel volume . Its variation is thus: while conservation of mass for the fluid implies: which gives the formula in the text. : A change in volume fraction results in a change in osmotic pressure, and the last equation can be rewritten as:
| (2) |
where is the swelling modulus of the gel, describing how the polymer network of the gel swells or shrinks in response to water pressure changes 333This swelling modulus under constant isotropic stress can also be expressed as , V being the total hydrogel volume. It is equivalent to a compression bulk modulus, but with opposite sign, as a polymer network inflates when increasing the solvent pressure.. Eq. 2 is similar to the one developed for the sedimentation of a colloidal solutionKim2007 . Assuming low variations of permeability, we have approximated the right hand side by . The water content and osmotic pressure therefore follow a diffusion equation, with a diffusion coefficient . The value 444This value is deduced from measurements of the relaxation time of a drying hydrogel. For our pHEMA hydrogel, we estimate MPa from Flory’s theory Flory1955 , so the estimated hydrogel permeability is very low: . For comparison, with Polyacrilamide hydrogel: Tanaka et al Tanaka1973 find m2s-1. This diffusion coefficient is similar to the present pHEMA hydrogel, but originates from very different values of elasticity and permeability, since they have , but a much softer gel. of this coefficient is around m2s-1.
The diffusion of pressure entail fluxes that follow , over the cavity surface . The transferred volume is therefore , so that under the hypothesis of a constant cavity volume , the bubble volume departs at long times scales from the initial volume (given by Eq. 1) along:
| (3) |
with , and which represents the time for which the bubble volume has doubled.
Fitting experimental curves of bubble growth of Fig. 4a (for times t<1s), provides and exponent values displayed on Fig. 4c. The value of is close to the predicted value 1/2, except for the largest characteristic time . The observed range of is also in excellent agreement with the expected value, predicted using the negative pressure measured in the first section: with MPa, MPa, m2s-1 and values extracted from one experiment of m and m, one finds s. The final filling of the bubble, when can be deduced from Eq. 3, and occurs at a time:
| (4) |
where we have neglected in front of . Using the same numerical values as above, one finds s, in very good agreement with the experimental observations. Note that the cavity volume is not constant in the experiment, so that the diffusion model should describe primarily the transferred liquid volume. Preliminary analysis of this volume provides larger growth exponents: this phenomenon is still under investigation. Also another challenge is to understand why, surprisingly, the curves of Fig. 4a, show that there is no detectable transfer of fluid to the gel during the first 10 ms after cavitation, since and initially differ by a constant offset. Then, an outward flow proceeds, which results in gas filling of the cavity.
In conclusion, we report in this Letter the first direct observations of spontaneous and triggered cavitation of water under static tension in confined geometries. The nucleated bubble initially expands at a sub-microsecond timescale, driven by a tension of tens of MPa. These extreme tensions result in visible water volume changes. These extereme tensions lead to uncommon facts in microfluidics: very fast velocities (30 m/s) and visible liquid volume changes associated with inertia, as can be seen on the initial damped oscillations of the bubble. Work is under way to fully characterize these oscillations. Also, the cavitation events studied here show a milder dynamic as compared to a free liquid with successive collapses. Thus, cavitation in water under tension leads to nucleation of bubbles but not to the destructive effects observed during cavitation bubble collapse. The presence of hydrogel in trees has been demonstrated recently Zwieniecki2001 and could thus have a role in the prevention of damage by cavitation events.
We also investigated the following slow growth of the bubble, which is limited by liquid flow in the surrounding gel, rehydrating it. Besides being useful for the design of hydrogel-made microfluidic devices, this fact leads to two remarks.
First, diffusion in a hydrogel is a complex process: the coefficient arises from a subtle balance between the elasticity and the permeability of the gel (Eq. 2), which change when it dries or hydrates. Since the hydrogel becomes softer as it rewets, this might slow the diffusion process as the cavitation bubble expands, explaining the fact that the growth exponents seen on Fig. 4 are always lower than expected from normal diffusion. Another challenge is to explain the origin of the latency time of about 10 ms after cavitation when no flow towards the gel occurs.
Second, the release of tension propagates in the gel when is rewetted by water, and this effect should be felt in closeby cavities. Indeed, when focusing the laser in the middle of three cavities at the same distance from each one, we noticed that the last triggered cavitation required much more laser energy than the first one. This interaction might stabilize neighboring cavities, but only for limited times, since diffusion eventually smoothes out the temporary pressure peak. Such a phenomenon suggest that cavitation propagation can be hindered by negative correlations. Applied to the context of sap transport, we hypothesize that this phenomenon may play a role in trees to regulate tension in the xylem.
The authors thank Dr. Roberto Gonzalez and Dr. Keita Ando for discussions and help with the experiments and the French-Singapore Merlion grant 2.08.09 for financial support.
References
- (1) M. T. Tyree, ”Plant hydraulics: The ascent of water”, Nature 423, 923 (2003).
- (2) H. Cochard, ”Cavitation in trees”, Comptes Rendus Physique 7, 1018 (2006).
- (3) T. D. Wheeler and A. D. Stroock, ”The transpiration of water at negative pressures in a synthetic tree”, Nature 455, 208 (2008).
- (4) X. Noblin, L. Mahadevan, I. A. Coomaraswamy, D. A. Weitz, N. M. Holbrook, and M. A. Zwieniecki, ”Optimal vein density in artificial and real leaves”, Proceedings of the National Academy of Sciences 105, 9140 (2008).
- (5) P. Moreau, J. Dehmoune, J.-B. Salmon, and J. Leng, ”Microevaporators with accumulators for the screening of phase diagrams of aqueous solutions”, Appl. Phys. Lett. 95, 033108 (2009).
- (6) E. Herbert, S. Balibar, and F. Caupin, ”Cavitation pressure in water”, Phys. Rev. E 74, 041603 (2006).
- (7) T. D. Wheeler and A. D. Stroock, ”Stability limit of liquid water in metastable equilibrium with subsaturated vapors”, Langmuir 25, 7609 (2009).
- (8) M. T. Tyree and M. A. Dixon, ”Cavitation events in thuja occidentalis l.? : Utrasonic acoustic emissions from the sapwood can be measured”, Plant Physiol. 72, 1094 (1983).
- (9) S. Kundu and A. J. Crosby, ”Cavitation and fracture behavior of polyacrylamide hydrogels”, Soft Matter 5, 3963 (2009).
- (10) T. G. Leighton, ”The acoustic bubble”, Academic Press, London, 1994.
- (11) C. Kim, Y. Liu, A. Kühnle, S. Hess, S. Viereck, T. Danner, L. Mahadevan, and D. A. Weitz, ”Gravitational stability of suspensions of attractive colloidal particles”, Phys. Rev. Lett. 99, 028303 (2007).
- (12) M. A. Zwieniecki, P. J. Melcher, and N. Michele Holbrook, ”Hydrogel control of xylem hydraulic resistance in plants”, Science 291, 1059 (2001).
- (13) P. J. Flory, ”Principles of polymer chemistry”, Cornell Universtiy Press, Ithaca, NY, 1955.
- (14) T. Tanaka, L. O. Hocker, and G. B. Benedek, ”Spectrum of light scattered from a viscoelastic gel”, J. Chem. Phys. 59, 5151 (1973).