The PEP survey: clustering of infrared-selected galaxies and structure formation at in the GOODS South††thanks: Herschel is an ESA space observatory with science instruments provided by European-led Principal Investigator consortia and with important participation from NASA.
Abstract
This paper presents the first direct estimate of the 3D clustering properties of far-infrared sources up to . This has been possible thanks to the Pacs Evolutionary Probe (PEP) survey of the GOODS South field performed with the PACS instrument onboard the Herschel Satellite. 550 and 502 sources were detected respectively in the 100m and in the 160m channels down to fluxes mJy and mJy, cuts which ensure 80% completeness of the two catalogues. More than 65% of these sources has an (either photometric or spectroscopic) redshift determination from the MUSIC catalogue, this percentage rising to % in the inner portion of GOODS South which is covered by data at other wavelengths. An analysis of the de-projected two-point correlation function over the whole redshift range spanned by the data reports for the (comoving) correlation length, Mpc and Mpc, respectively at 100m and 160m, corresponding to dark matter halo masses , in excellent agreement with previous estimates obtained for mid-IR selected sources in the same field. Objects at instead seem to be more strongly clustered, with Mpc and Mpc in the two considered PACS channels. This dramatic increase of the correlation length between and is connected with the presence, more visible at 100m than in the other band, of a wide (at least 4 Mpc across in projection), , filamentary structure which includes more than 50% of the sources detected at . An investigation of the properties of such sources indicates the possibility for boosted star-forming activity in those which reside within the overdense environment with respect of more isolated galaxies found in the same redshift range. If confirmed by larger datasets, this result can be explained as due to the combined effect of large reservoirs of gas available at high redshifts in deep potential wells such as those associated to large overdensities and the enhanced rate of encounters between sources favoured by their relative proximity. Lastly, we also present our results on the evolution of the relationship between luminous and dark matter in star-forming galaxies between and . We find that the increase of (average) stellar mass in galaxies between and is about a factor 10 lower than that of the dark matter haloes hosting such objects ( vs ). When compared with recent results taken from the literature, our findings agree with the evolutionary picture of downsizing wherby massive galaxies at were more actively forming stars than their counterparts, while at the same time contained a lower fraction of their mass in the form of luminous matter.
keywords:
galaxies: evolution - galaxies: statistics - infrared - cosmology: observations - cosmology: theory - large-scale structure of the Universe1 Introduction
Investigations of the Large Scale Structure (LSS) traced by selected classes of extra-galactic sources, read in connection with more and more refined models for its characterization, has enabled in the recent years to derive important information on some physical properties characterizing the objects producing the clustering signal. One of these key quantities is the halo mass and its evolution with look back time, which for instance allows to derive cosmological connections between different populations of extra-galactic sources observed in different wavelengths at different epochs.
The development of these theoretical models for the description of the LSS, together with the impressive achievements reached in the past fifteen years or so by science instrumentation have allowed the scientific community to greatly broaden their knowledge on the formation and evolution of the cosmic structures, pushing it up to the dawn of galaxy formation.
Within this framework, amongst the more interesting classes of sources are those which are undergoing some kind of active process such as AGN activity or star formation. Since the first high redshift observations of the two Hubble Deep Fields (Williams et al. 1996; Casertano et al. 2000), all clustering analyses performed on optical/near-IR surveys which were at the same time wide enough to ensure statistical significance and deep enough to probe high redshift regimes, have highlighted a strong evolution of these two classes of sources, whereby activity shifts to smaller and smaller haloes/galaxies as one moves forward in time. The critical redshift for this transition seems to be around for star-forming galaxies (e.g. Magliocchetti & Maddox 1999; Arnouts et al. 2002; Foucaud et al. 2010; Hartley et al. 2010) and for QSOs (e.g. Porciani, Magliocchetti & Norberg 2004; Shen et al. 2007; Ross et al. 2009). Perhaps not surprisingly, these two redshift values bracket the peak of cosmic activity both in terms of AGN and star formation (Madau et al. 1996).
Although clustering results in flux-limited surveys are somehow masked by the well known ’Malmquist bias’ issue (more distant and therefore more luminous sources are more strongly clustered), some steps forward have been taken in order to minimize its effect on high redshift studies (e.g. Magliocchetti et al. 2008; Foucaud et al. 2010). These works all converge at indicating that massive galaxies form at high redshifts and on short timescales, while the sites of activity shift to lower mass systems at later epochs. This pattern, referred to as ”downsizing” (Cowie et al. 1996; Heavens et al. 2004), is also observed in an increasing number of independent works (see e.g. Fontana et al. 2004; Treu et al. 2005; Cimatti, Daddi & Renzini 2006, Saracco et al. 2006; Bundy et al. 2006; McLure et al. 2006 just to mention a few), all adopting techniques which differ from clustering analyses.
The advent of the Spitzer telescope has marked another milestone for what concerns our knowledge of the population of dusty (and therefore optically dim) active galaxies. Even in this case, the downsizing effect was confirmed for all obscured active sources up to (e.g. Magliocchetti et al. 2008). In particular, for the first time Spitzer has detected a population of Ultra-Luminous Infrared Galaxies (ULIRGS, ) in the redshift range () with extremely high clustering lengths ( Mpc – Farrah et al. 2006b; Magliocchetti et al. 2007; 2008; Brodwin et al. 2008). Taken at face value, these correlation lengths correspond locally to those of groups-to-poor clusters of galaxies (see e.g. Guzzo et al. 2000; Estrada et al. 2009), and might be interpreted with a roughly one-to-one correspondence between the overwhelming majority of ULIRGS at and local clusters.
The recent advent of the Herschel telescope allows the scientific community to further extend its knowledge on the formation and evolution of dusty sources up to very high redshifts. In fact, thanks to the fantastic capabilities of the PACS instrument, the GOODS South region has been observed at 70m, 100m and 160m to unprecedented depths as a part of the PEP (PACS Evolutionary Probe, D. Lutz et al. submitted to A&A) survey. The majority of PEP sources in the GOODS-S is endowed with a redshift determination from the MUSIC catalogue (Santini et al. 2009) and this allowed us to estimate, for the first time in a self-consistent way, the 3D clustering properties of the population of far-infrared galaxies up to . Knowledge of the redshift distribution further allows to investigate the evolution of clustering with look-back time. In the light of what was discussed above, we have then also investigated the large-scale pattern traced by PEP galaxies at redshifts and will discuss our findings in terms of abundances of super-structures or proto-clusters made of obscured star forming galaxies right at the peak of cosmic star formation activity.
The work is organized as follows: §2 introduces the PEP catalogues and analyses some of the properties of the sources with the help of multiwavelength data coming from the MUSIC catalogue. §§3 and 4 present the results for the two-point angular correlation function of all PEP sources spanning the whole redshift range. §5 concentrates on the large-scale properties of far-infrared sources residing in the epoch which corresponds to the peak of cosmic star formation activity. §6 provides a more detailed description of PEP sources, in particular focussing on the properties of an extended filamentary structure (or proto-cluster) made of 100m-selected galaxies at . §7 presents our results on the evolution of the relationship between luminous and dark matter in PEP-selected galaxies and compares them with recent works from the literature, while §8 summarizes our findings.
Throughout this paper we assume a CDM cosmology with , and .
2 The data
The GOODS South (GOODS-S) region has been observed by the PACS (Poglitsch et al. 2010) instrument onboard the Herschel Space Observatory (Pilbratt et al. 2010) as a part of the PACS Evolutionary Probe (PEP, D. Lutz et al. submitted to A&A) Survey, aimed at studying the properties and cosmological evolution of the infrared population up to redshifts . We refer to the Lutz et al. paper for further information on the survey and fields, including GOODS South, data reduction and catalogue creation.
The total number of sources detected in the blind (i.e. without the use of priors) catalogues at the confidence level is 375 at m, 717 at 100m and 867 at 160m. The corresponding flux limits in the three wave-bands are mJy, mJy and mJy. Given the relative paucity of sources in the blue/70m channel which does not allow sensible clustering estimates, this paper will only concentrate on the two higher wavelengths, i.e. the m and 160m bands.
GOODS-S is one of the best studied cosmological fields, having been observed in great depth at virtually all the available wavelengths. The GOODS-MUSIC catalogue (Santini et al. 2009) provides a compilation of high quality multi-wavelength (from 0.3m to 24m) data for sources detected in the GOODS-S area in the z-, Ks-, and 4.5 m-bands. The largest fraction of the sample is 90% complete at z26 or Ks23.8 or 4.5um23.5 (AB scale; Oke, 1970). The final catalogue comprises 15,208 sources, out of which nearly 3,000 are endowed with a spectroscopic redshift determination. Most of the remaining sources have assigned photometric redshifts, estimated by following the technique of Grazian et al. (2006).
The original PEP catalogues at the two relevant frequencies were then cross-correlated with the MUSIC catalogue through a three-band maximum likelihood procedure (Sutherland & Saunders, 1992; see Berta et al. 2010 for further details). This found
respectively 475 (out of 717) and 536 (out of 867) IR-selected galaxies with a counterpart in MUSIC. The overwhelming majority of these objects has an assigned (either photometric or spectroscopic) redshift. In a handful of cases this was not possible due to the lack of mainly JHK band data at the edges of the area covered by MUSIC. We have also checked
the accuracy of the photometric redshift estimates for our population of
star-forming galaxies. The mean spread is found to be
, only slightly
larger than the value found by Santini et al. (2009) for the whole
GOODS-MUSIC catalogue. By investigating this issue further, we found that such an
increased value is mainly due to a handful (about 6) of outliers with either
or beyond . Indeed, if one removes these few sources,
the mean spread in photometric accuracy is about 0.049, i.e. even smaller than that
reported by Santini et al. (2009).
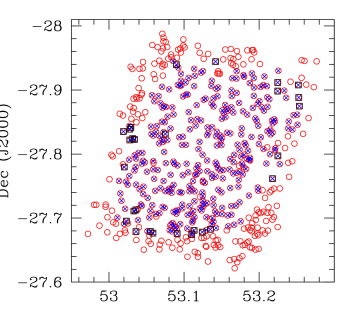
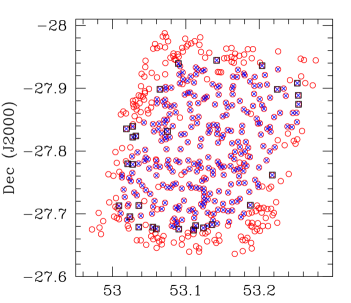
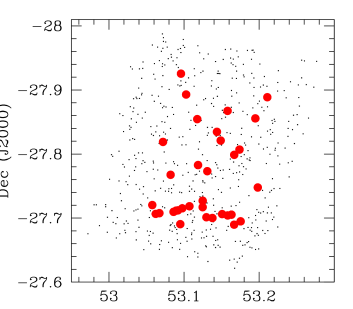
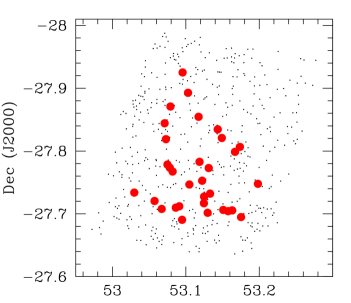
Clustering studies need high completeness levels. This is why in the following analysis we will only concentrate on those sources belonging to the blind PEP catalogues which have PACS fluxes above the 80% completeness levels. These limits, as estimated from simulations (cfr. Lutz et al. submitted to A&A) are 2 mJy at m and 5 mJy at 160m. Applying the above flux cuts, the number of sources respectively in the green and red bands of the blind catalogues are 550 and 502. These are the sources which will be used for the clustering studies. Their projected distribution onto the sky is shown in Figure 1 by the empty circles.
Of these sources, respectively 343 at 100m and 296 at 160m have a counterpart in the MUSIC catalogue, obtained as previously explained. Their distribution onto the sky is represented in Figure 1 by the crosses. From the two plots it is possible to appreciate that almost all PEP sources in the inner GOODS-S area have a counterpart in the MUSIC catalogue, the apparent discrepancy between the total number of PEP-detected objects and of those which also have a counterpart in other wavebands simply due to the fact that the PEP survey covers a slightly wider area than those at other frequencies.
The number of PEP-MUSIC sources above the 80% completeness level with an assigned redshift is 315 and 283, respectively at 100m and 160m. Those sources which do have a counterpart in MUSIC but for which it was not possible to assign a redshift estimate are indicated in Figure 1 by the empty squares.
As already discussed, they mostly lie at the edges of the area covered by MUSIC data which lack of JHK band data coverage.
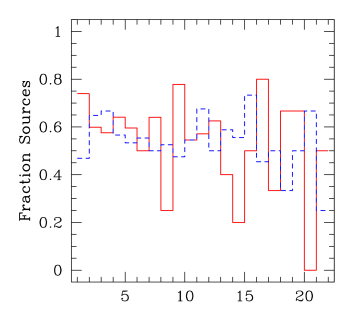
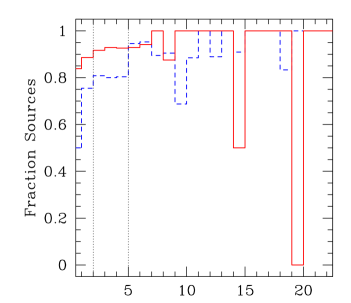
The ratio between the total number of PEP sources and of those with a redshift determination as a function of PACS fluxes is presented in Figure 2 by the histograms, solid line for the 100m case, dashed one at 160m. The left-hand panel refers to all the sources detected by the PEP survey, while the right-hand one only considers those PEP-selected objects which fall within the area covered by MUSIC data. As it is possible to notice, the success rate for redshift determination is roughly constant with far-IR flux, at least for fluxes above the 80% completeness level (represented in the right-hand panel by the dotted vertical lines). Furthermore, the right-hand panel also indicates that in the common region covered by both MUSIC and PEP observations, more than 90% of the PEP sources above the chosen flux limits are endowed with a redshift determination. We will discuss the implications of these results in §3.2 when dealing with conversions to spatial estimates of the angular correlation function.
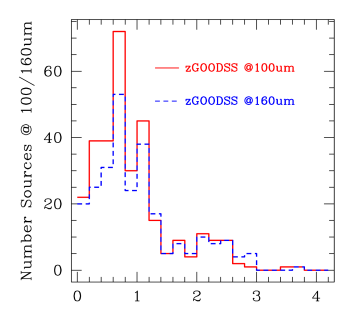
The redshift distribution for those PEP-selected sources with a counterpart in the MUSIC catalogue and with PACS fluxes above the % completeness level is presented in Figure 3. The distributions at the two frequencies are virtually identical, with a first peak around , a secondary peak at , then a rapid decrease before presenting a wider bump between redshifts 2 and 3. The two primary peaks correspond to the two well studied clusters at and (e.g. Gilli et al. 2003; Vanzella et al. 2005).
3 Clustering Analysis
3.1 The Angular Correlation Function
The angular two-point correlation function
gives the excess probability, with respect to a
random Poisson distribution, of finding two sources in the solid
angles separated by an angle
. In practice, is obtained by comparing the
observed source distribution with a catalogue of randomly
distributed objects subject to the same mask constraints as the
real data.
We chose to use the estimator (Hamilton 1993)
| (1) |
where , and are the number of data-data, random-random and data-random pairs separated by a distance .
Given the % completeness of both the 100m and 160m considered samples, in the specific case of PACS-selected sources we have simply generated random catalogues with twenty times as many objects as the real data sets, covering the whole surveyed GOODS South area minus the outermost regions which showed irregular data coverage. Within the same considered area, the number of mJy and mJy PEP-selected sources is respectively 519 and 470. in eq. (1) for the above objects was then estimated in the angular range degrees. The upper limit was determined by the geometry of the GOODS-S field, and corresponds to about half of the maximum scale probed by the survey.
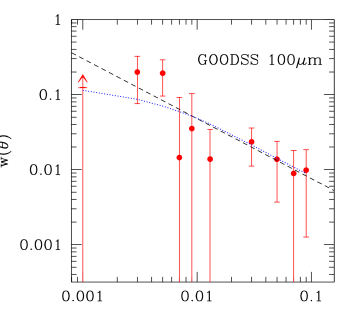
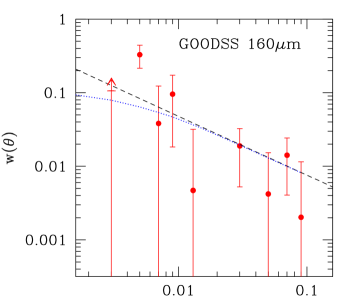
Figure 4 presents our results for the two 100m-selected (4a; left-hand panel) and 160m-selected (4b; right-hand panel) samples. The error bars show Poisson estimates for the points. Since the distribution is clustered, these estimates only provide a lower limit to the uncertainties. However, it can be shown that over the considered range of angular scales this estimate is close to those obtained from bootstrap resampling (e.g. Willumsen, Freudling & Da Costa, 1997). Due to the angular resolution of the Herschel mirror at the two considered wavelengths (respectively and at 100m and 160m) which would cause source blending on lower angular scales, the two results in the smallest bins of the angular correlation function merely represent lower limits and therefore have been indicated with upward arrows.
If we then assume the standard power-law form for ,
we can estimate the parameters and by using a least-squares
fit to the data. Given the large errors on ,
we chose to fix to the standard value .
Although somewhat arbitrary, this figure and its assumed lack of dependence
on redshift is justified by Large Scale Structure observations of large enough samples of
high redshift sources so to allow for a direct estimate of the slope of
at different look back times (e.g. Porciani, Magliocchetti & Norberg 2004;
Le Fevre et al. 2005).
The small area of the GOODS-S survey introduces a negative bias through
the integral constraint, . We allow for
this by fitting to , where .
The dashed lines in Figures 4a and 4b represent the best power-law fits
respectively to the 100m and 160m data-sets.
The associated best-fit values for the amplitude are
for the 100m-selected sample,
and for the
160m-selected one, i.e. the results at the different wavelengths are virtually identical.
As a further consistency check, we have released the constraint on and
let it vary between 1.0 and 2.5. Despite the expected degeneracy
between the best-fit values of and determined by this choice,
we find that in the case of the 100m-selected sample
slopes shallower than 1.3 are ruled out by our data at the % confidence level.
(and the corresponding value for quoted above) indeed provides the
best fit to the observed , even though any value in the range
can be accepted within 1 confidence level.
The corresponding ranges of variability
for the amplitude are .
The 160m-selected sample (for which, however, is less constrained due to a worse angular resolution of
the corresponding PACS channel) instead seems to prefer higher values of . This is
due to the observed at the smallest angular scales probed by our analysis
and possibly hints at
multiple occupancy for the dark matter haloes inhabited by such galaxies (cfr §4).
The best-fit value is found for (outside the chosen range of variability for ),
with a 1-acceptance that goes down to . The corresponding ranges of variability
for the amplitude are .
The estimated amplitudes for these samples (under the assumption of ) are in good agreement with the results obtained for Spitzer-selected sources. More specifically, they closely follow those obtained by Magliocchetti et al. (2007) for the whole population of mJy objects from the First Look Survey (), and also those obtained by Fang et al. (2004) for IRAC, 8m-selected galaxies in the same field. Lastly, we also note that the low clustering signal obtained by Maddox et al. (2010) for galaxies selected at 250m within the Herschel-ATLAS consortium is compatible with our PEP results.
3.2 Relation to spatial quantities
The standard way of relating the angular two-point correlation function to the spatial two-point correlation function is by means of the relativistic Limber equation (Peebles, 1980):
| (2) |
where is the comoving coordinate, gives the correction for curvature, and the selection function satisfies the relation
| (3) |
in which is the mean surface density on a surface of solid angle and is the number of objects in the given survey within the shell ().
If we adopt a spatial correlation function of the form , independent of redshift in the considered intervals, and we consider the redshift distributions presented in Figure 3, for the adopted cosmology we obtain via a -square fit to the data: Mpc and Mpc (where both quantities are comoving), respectively for the m and m samples.
It is worth noting that, while has been obtained over the whole area covered by PACS observations of the GOODS South, the adopted redshift distributions only refer to a sub-sample of 65% of the PEP sources which are located in the (smaller) region where PEP and MUSIC data co-exist (cfr. Figure 1). In principle, such a discrepancy could produce biases in the determination of . However, as seen in §2, the ratio between the number of PEP sources endowed with a redshift determination and that of the whole PEP sample shows a general independence of far-IR flux. Furthermore, this trend is the same both in the inner and outer regions of the PEP-GOODSS survey (cfr. Figure 2). These findings provide insurance on the reliability of the adopted and therefore on the goodness of the estimated .
As a further consistency check, we have also considered the MUSYC catalogue of photometric redshifts derived by Cardamone et al. (2010) over the whole Extended Chandra Deep Field-South region and assigned via a nearest neighbourhood procedure a photometric counterpart to our PEP sources detected in the blind catalogues. By then adopting the redshift distributions originating from this different approach, we find for the correlation lengths Mpc and Mpc, i.e. the results are virtually equivalent to those obtained by considering the redshift distributions derived from the MUSIC catalogue.
The above results indicate that the clustering properties of far-infrared galaxies closely follow those found for 24m-selected sources. Gilli et al. (2007), while analysing a sample of Jy in the same GOODS South field we are considering in this work, report a very similar clustering length ( Mpc) as ours for their sub-class of Luminous Infrared Galaxies (LIRG) with . Noticeably, also the number densities of their 24m-selected sources and of our far-infrared galaxies coincide, leading us to conclude that these two classes of objects refer to the same galaxy population. It is also worth noticing that Gilli et al. (2007) find a dip in the trend of the real-space correlation function on scales Mpc which, at the median redshift () of their survey, corresponds to those angular scales where our data also seem to indicate lower-than-expected values for . The above clustering properties for far-infrared bright galaxies locally mirror those of ’normal’ early-type galaxies (e.g. Madgwick et al. 2003; Zehavi et al. 2005) and it is therefore sensible to envisage an evolutionary connection between these populations whereby the bulk of far-IR selected sources at will eventually evolve in passive ellipticals in the nearby universe.
All the information on the adopted samples, correlation function results, number densities etc. can be found summarized in Table 1.
4 Connection with physical properties: the Halo Bias Approach
The easiest way to relate the clustering trend of a population of extra-galactic sources with their physical properties is by means of the Halo Bias approach (Mo & White 1996) which describes the observed clustering signal as the product between the two-point correlation function of the underlying dark matter distribution and the square of the so-called bias function , quantity which at a given redshift solely depends on the minimum mass of the haloes in which the detected astrophysical objects reside via the relation:
| (4) |
Starting from eq.(4), the theoretical angular two-point correlation function predicted by the halo bias model for PACS-selected galaxies at 100m and 160m has then been computed once again by following eq.(2) and the best values for at the two wavelengths have been found by a -fit to the observed clustering signal. This gives and , respectively for the 100m and 160m samples. The corresponding best-fit curves are shown in Figures 4a and 4b by the (blue) dotted lines.
More sophisticated models have been introduced in the recent years in order to provide a more realistic description of the observed clustering properties of extra-galactic sources. One of the most successful ones, the so-called Halo Occupation Model (HOM, e.g. Scoccimarro et al. 2001) relates the clustering properties of a chosen population of galaxies with the way such objects populate their dark matter haloes, i.e. relaxes the somehow unrealistic assumption, implicit in the halo bias model, of having a one-to-one correspondence between a galaxy and its dark matter halo. Indeed, from a quick glance at Figures 4a and 4b, it is possible to notice how the more simple halo bias model (4) cannot reproduce the observed rise in the angular correlation function on small angular scales ( deg), where the signal is dominated by pairs of galaxies residing within the same dark matter halo. However desirable, such an analysis is unfortunately not possible on our dataset due to relatively poor signal-to-noise ratio. In fact, the HOM is a three parameter model: together with the minimum mass of the dark matter halo it also depends on the the quantities and according to the expression
where is the number of galaxies within a halo of certain mass . And a three-parameter fit will only be possible when larger fields such as COSMOS and the Lockman Hole will be included in the analysis. For the time being, we notice that the quantities and are covariant, so that within the HOM framework, higher values for in general correspond to lower values for . This implies that in the presence of multiple halo occupancy, the values for found within the HOM scenario will be (slightly) lower than those obtained via the halo bias model adopted in this work.
Despite the above warnings and bearing in mind that so far all clustering results at the SPIRE wavelengths have only been derived by using theoretical redshift distributions, it is however interesting to note that the resulting values for are in good agreement with those found by Cooray et al. (2010) in their 250m-selected sample obtained by combining the Lockman-SWIRE and FLS fields, possibly confirming the fact that the imaged sources belong to the same underlying population of galaxies as ours. We also note that similar results have also been obtained by Magliocchetti et al. (2008) for galaxies with Jy taken from the UKIDSS survey, once again indicating that the bulk of sources producing the clustering signal at the PACS wavelengths coincides with Spitzer-selected galaxies.
5 Large-Scale Structure at
| Number sources | [Mpc] | Log [] | number density | ||
|---|---|---|---|---|---|
| 100m; all | 550 (519) | ||||
| 100m; | 33 (33) | ||||
| 160m; all | 502 (470) | ||||
| 160m; | 32 (32) |
Magliocchetti et al. (2007; 2008) found that Spitzer/24m-selected galaxies residing at redshifts exhibited an exceptionally strong clustering signal ( Mpc). Their results were also found to agree with the estimates of Farrah et al. (2006a; 2006b) for ultra-luminous infrared galaxies over the range. The above figure, obtained for galaxies undergoing an intense phase of dust-enshrouded star formation (in the redshift interval , the strong spectral PAH feature centred at 7.7m – indicative of a very intense star-forming activity – falls in the 24m band), was also in agreement with earlier results obtained for star-forming galaxies selected at in the (rest-frame) UV-band in both Hubble Deep Fields (Magliocchetti & Maddox 1999; Arnouts et al. 2002). Although with larger uncertainties, sub-millimeter-selected galaxies – mainly found in the considered redshift range – also seem to cluster with a similar strength (Weiss et al. 2009). More recently, Hartley et al. (2010) use the UKIDSS Ultra Deep survey to investigate the clustering properties of passive and star-forming galaxies and find that, while locally these two classes of objects exhibit quite a different behaviour, with the former one being about twice as more clustered than the second one, at redshifts star-forming and passively evolving galaxies have similar clustering strengths, with values for the correlation length in excellent agreement with those reported above ( Mpc). We note that at lower redshifts, such a strong clustering signal finds a counterpart only in the case of radio sources (see e.g. Magliocchetti et al. 2004) and early type, galaxies (see e.g. Norberg et al. 2002), and is only second to those of rich clusters of galaxies (e.g. Guzzo et al. 2000). It is therefore natural to envisage a connection between these latter objects and the high-z sources, whereby massive galaxies undergoing intense star-formation at redshifts end up as the very bright central galaxies (passive objects with a high probability for enhanced radio activity, see e.g. Best et al. 2007; Magliocchetti & Brüggen 2007) of local clusters.
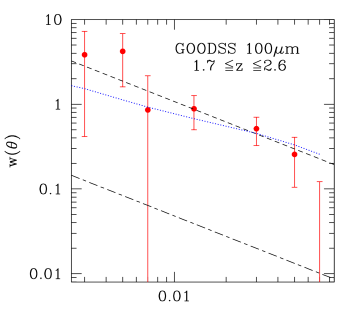
Redshifts around 2 therefore seem very interesting not only for what concerns the study of the assembling of the stellar content of galaxies (it is in fact at those redshifts that the cosmological star formation rate peaks – Madau et al. 1996, see also Gruppioni et al. 2010 for a more updated version of the Madau plot), but also with respect to the formation and evolution of extremely large structures such as groups and clusters of galaxies. It is for this reason that we have decided to isolate in the 100m and 160m PEP catalogues sources in the redshift range – so to mimic the 24m selection of galaxies with intense star forming activity and therefore strong PAH lines – and have then studied their Large-Scale properties. The number of sources in the PEP/GOODS South catalogues within the above redshift interval and with fluxes above the requested cuts which ensure % completeness is 33 in the 100m case and one less at 160m. The angular correlation function of these objects has then been calculated as in §3.1.
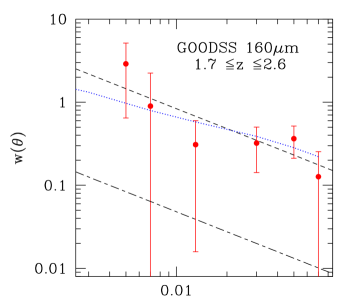
The corresponding results with associated (Poissonian) uncertainties are plotted in Figure 5, where once again those referring to the 100m band are found on the left-hand panel. The short-long dashed lines indicate the best-fit to the angular correlation functions obtained for the whole PEP samples, both at 100m and at 160m (Figure 4 and Table 1). Despite the large uncertainties, comparisons with these latter results clearly show that PEP galaxies are extremely strongly clustered, with an amplitude of about a factor 20 higher than what found for PEP sources at all redshifts. A more quantitative analysis performed by assuming a power-law form for , with (see §3), returns the values for the amplitude for the 100m-selected sample, and for the 160m-selected one. In terms of correlation lengths (cfr. eq. 2), this corresponds to Mpc and Mpc. These values (which we stress are obtained by adopting a top-hat distribution for which does not include the (small, cfr §2) errors associated to the photometric redshift estimates) are extremely high, possibly even higher than those obtained in the works summarized at the beginning of this section in the case of star-forming galaxies at redshifts . We also note that according to the halo bias approach (equation 4), such very high clustering strengths imply PEP sources to be hosted in dark matter haloes of masses respectively greater than and at 100m and 160m, i.e. these sources reside in super-massive/cluster-like structures which are already found in place at . It is also interesting to stress that the above values agree with the early estimates of Daddi et al. (2001), Mpc, obtained for a handful of spectroscopically determined GOODS-S galaxies.
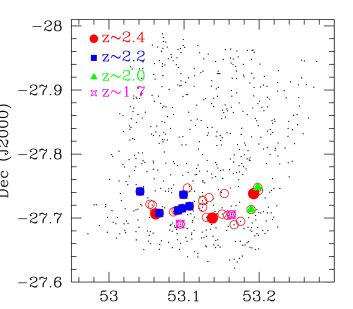
A visual investigation of the distribution of PEP-selected galaxies in the interval (cfr. Figure 6) shows that this is indeed the case. Out of 33 sources with mJy, 18 of them, corresponding to 55% of the total, reside in a huge, filamentary structure, about 4 Mpc across in projection, centred at . A similar behaviour, although less pronounced (which explains the slightly lower value obtained for the correlation length in this latter case) is also visible at 160m. We note that a forming, diffuse, super-structure at was already identified by Salimbeni et al. (2009), while studying the properties of overdensities in the GOODS South. It is however remarkable the way this overdensity shows up in such a clean way and with such a high significance in a numerically much smaller sample which is uniquely made of dusty star-forming galaxies.
We know however that the GOODS South seems to be a very peculiar field, already dominated by a couple of clusters around redshifts 0.7 and 1 (e.g. Gilli et al. 2003; Adami et al. 2005; Vanzella et al. 2005; D az-Sanchez et al. 2007). So, it is sensible to state the statistical significance of our findings. Straight integration of the Sheth & Tormen (1999) dark halo mass function in the considered redshift range indicates that the number of haloes with masses greater than , compatible with our findings, on an area like that subtended by the GOODS-South is about 14. This corresponds to the 15, 100m-selected, real ’field’ (i.e. not belonging to the filamentary super-structure) galaxies observed with Herschel-PACS with mJy. From the above figures we can then draw a first, interesting, conclusion: every dark matter halo which reaches the mass necessary to host a (dusty) star-forming galaxy at redshift will be inhabited by (at least) one of such objects. In other words, the above statement indicates that star-forming galaxies at redshifts around 2 are common events, their observed paucity (number densities of the order of a few Mpc, cfr. Table 1) simply due to the paucity of high mass dark matter haloes at the considered redshifts. In a similar fashion, we can also conclude that, for what concerns the spatial distribution of dust-obscured galaxies, GOODS South is not a particularly peculiar field as it comprises (within Poissonian uncertainties) a number of sources which is compatible with theoretical expectations.
Similar back-of-the-envelope calculations further show that the number density associated to the projected distribution of mJy proto-cluster sources is about Mpc, with a , i.e. as already expected, the overdensity at , is not yet virialized ( for a CDM universe; Peebles 1980) but will likely evolve in a bound structure.
6 The overdensity
The filamentary structure singled out in the high redshift clustering analyses has an undoubtable relevance per se as it provides one of the first clear examples of formation of super-structures made of star-forming galaxies right at the peak of cosmic star-forming activity (for a further example cfr. Andreani, Magliocchetti & de Zotti 2010). It is therefore worth concentrating some more on this structure by analyzing its members and their properties as compared to those of similar galaxies residing in less dense environments.
In order to do that, we have released the request for 80% completeness and considered all PEP/100m-selected sources within the redshift interval which in projection appear to belong to this diffuse overdensity. The number of objects fulfilling the above requirements is 28 and they are indicated in Figure 7 with (red) empty circles. Thirteen of these galaxies have a spectroscopic redshift determination from the literature and are highlighted in Figure 7 with different symbols. More in detail, three of them, distributed along the whole length of the filamentary structure, have (filled red dots), six of them have and are all clustered in the left-hand part of the structure (filled blue squares), while respectively two+two sources have redshifts around 2.0 and 1.7, the former pair residing in the outermost right-hand part of the overdensity (green triangles), while the other, probably not really belonging to the diffuse super-structure, is spread along the proto-cluster (magenta stars). It therefore seems that we are in the presence of a very diffused/possibly forming super-structure at ’bracketed’ at the two ends of its length by two more concentrated clumps set at a median redshift (with a scatter ).
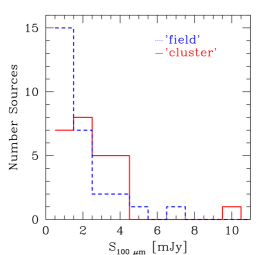
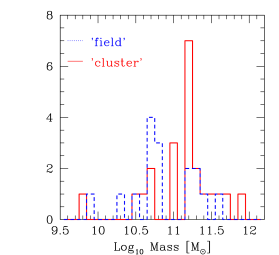
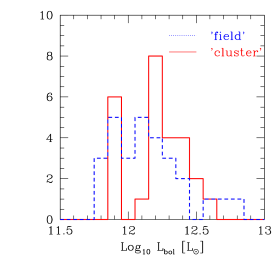
In order to investigate the influence of environment on star-forming activity at redshifts , we have then estimated masses and bolometric luminosities for the 25 sources residing within the area identified by the super-structure and then compared these latter quantities with those obtained for more isolated or ’field’ galaxies (28 objects), otherwise selected from the 100m-PEP sample with the same criteria as the sources belonging to the overdensity.
Stellar masses have been derived according to the method described in Rodighiero et al. (2007; 2010) which fits the UV-to-5.8m broad band photometric data with the Bruzual & Charlot (2003) stellar population synthesis models, assuming a Salpeter (Salpeter 1955) Initial Mass Function (IMF) and a Calzetti extinction law (Calzetti et al. 1994), once the redshift of each source is fixed to its spectroscopic or, whenever unavailable, photometric value. For GOODS-S the stellar masses are also available from Santini et al. (2009) and are calculated with the same synthesis models and very similar recipes as in Rodighiero et al. (2007; 2010).
Bolometric luminosities have instead been computed by using two different methods. The first one, presented in Rodighiero et al. (2010), fits the optical-to-FIR SEDs with a library of local templates, including those of Polletta et al. (2007), and a few additional modified templates with colder FIR emission (see Gruppioni et al. 2010 for further details) at a given redshift. was then obtained by integrating the best-fit SEDs over the whole m rest-frame range. The second method instead follows that presented in Santini et al. (2009). Luminosities in this case have been derived by fitting the 100m observations to the Dale & Helou (2002) synthetic templates. First, a total infrared luminosity in the m range was assigned to each template by using the empirical relation of Marcillac et al. (2006) between and the predicted ratio between fluxes at 60m and 100m. Once the k-correction was applied, we then selected the model which best reproduces the observed 100m luminosity and normalized it by using the flux difference between the model and the observed galaxy. These two methods produce virtually identical results, so in the following we only present the outcomes of the Santini et al. (2009) method.
Figure 8 presents the distribution of 100m fluxes (left-hand panel), masses (middle panel) and luminosities (right-hand panel) for the galaxies belonging to the filamentary overdensity (solid line) as compared to those of more isolated galaxies residing within the same redshift range (dotted line). As it is possible to appreciate, while the distribution of masses in the two cases follows a similar trend, ’field’ galaxies seem to be on average fainter than sources belonging to the overdensity, both in terms of 100m flux and bolometric luminosity. If we then convert bolometric luminosities into estimates for the star formation rate (SFR) via the relation (Kennicutt et al. 1998), it follows that Figure 8 also provides a snapshot for the star formation activity within and outside the enhanced-density area. By doing this, and despite the relative small statistics, we find that the sources within the filamentary structure have an enhanced star formation activity (peak at ) with respect to more isolated galaxies, which exhibit a peak in their SFR at about 180. We are therefore in the presence of boosted star-formation activity in the over-dense region, probably due to the joint effect of large reservoirs of gas available at high redshifts in deep potential wells such as those associated to large overdensities and the enhanced rate of encounters between sources favoured by their proximity. Larger datasets are obviously needed to provide the ultimate answer on this issue. This result is in agreement with the findings of Popesso et al. (2010) who observe an inversion of the relationship between environmental density and star formation rate at around redshift 1 with respect to the local results, where SFR is depressed in overdense regions.
7 On the redshift evolution of the link between luminous and dark matter
Since GOODS-South has been observed at a great wealth of frequencies, important information such as mass in stars, bolometric luminosity and star formation rate for the sources which populate the area can be obtained. A combination of these properties with the results inferred from the clustering analysis on the mass of their dark matter haloes can then provide interesting constraints on the relation between – say – luminous and dark matter in star forming galaxies and its eventual dependence on look-back time. Given the extreme similarity in the clustering results obtained in this work between the 100m and 160m channels (cfr. Table 1), and the better determination of the relevant parameters derived in the former case due to its higher angular resolution, in the following we will only concentrate on galaxies selected at 100m.
Stellar masses and star formation rates were then derived for all sources detected by PEP at 100m in the GOODS-South field endowed with a reliable (either photometric or spectroscopic) redshift determination. This was done as described in §6. Furthermore, in order to ensure both completeness of the sample and consistency with the clustering results, we have restricted our analysis to galaxies with 100m fluxes brighter than 2 mJy. Finally, in order to investigate possible redshift dependencies of the considered quantities, we have considered two different samples: a first one which comprises galaxies in the range ( with both stellar mass and luminosity estimates), and a second one which focuses on sources at higher, , redshift ( with both stellar mass and luminosity estimates).
Future works will address in more detail the properties
of the sources detected by the PEP survey in GOODS-S. We here discuss average stellar
masses and star formation rates of these two samples in conjunction with the minimum dark
matter halo mass as determined from clustering results.
The mean redshifts of the two considered samples are and .
Average stellar masses, bolometric luminosities and star formation rates are found to be ,
and for the intermediate-redshift sample and
, and for the high-z one.
Despite the uncertainties due to the relatively small number of sources considered in the analysis, the above figures suggest that by moving towards
the present universe not only
– as expected for a flux-limited survey –
we are selecting less luminous and actively star-forming galaxies, but also that
on average such galaxies have smaller stellar masses than their high-redshift counterparts.
As we saw in §§4 and 5, this is also true when we consider the masses of the dark matter halos which host such objects. However, the increase
of mass with redshift in this latter case seems to be more
pronounced. Indeed, while for stellar masses we find a ratio , for the minimum mass of dark matter haloes
we obtain (cfr. Table 1), i.e. a value which is about ten times smaller.
We note that, although for the calculation of we have technically used the whole sample of 100m-selected galaxies brighter
than 2 mJy, the presence of the two very marked peaks in their redshift distribution at and (cfr. Figure 3) effectively
ensures that the observed clustering signal is dominated by sources which reside at redshifts which are close to those of the two peaks and therefore
that the measured values for closely resemble those that would be obtained for a redshift-limited, , sample such
as that considered in this section.
A number of recent works have focussed on both theoretical (e.g. Moster et al. 2010) and observational (e.g. Foucaud et al. 2010; Leauthaud et al. 2011; Wake et al. 2011) aspects of the relationship between stellar and total mass in galaxies as a function of both redshift and galaxy masses. The observational works deal with clustering analyses and their results can therefore be compared with what we obtain in the present paper. In more detail, both Foucaud et al. (2010) and Wake et al. (2011), despite the different selection criteria (galaxies selected in the near-IR rather than in the far-IR regime as it is our case), span a redshift and a stellar mass range which roughly overlap with ours. Foucaud et al. (2010) find for galaxies with stellar masses respectively within the values and at and values for the number density and clustering length , Mpc-3, Mpc and Mpc-3, Mpc, in very good agreement with our findings. The same can be said of the Wake et al. (2011) results who find in their and redshift bins respectively Mpc-3, Mpc and Mpc-3, Mpc for stellar masses and .
The concordance between the above results and ours also implies that our findings on the relationship between luminous and dark matter, i.e. the ratio at redshifts and agree with what reported by both Foucaud et al. (2010) and Wake et al. (2011). We also note that, even though direct comparisons are more difficult given the way data are presented, at our findings are also in agreement with the results from Leauthaud et al. (2011) who add galaxy lensing to their analysis, and with those of Meneux et al. (2008).
Although the intrinsic limitations of dealing with a flux-limited catalogue mask possible strong conclusions that can be drawn on the evolution of the luminous-to-dark matter ratio in galaxies with redshift/galaxy mass, however the pieces of information that we have gathered in this section, when combined with the above results taken from the literature, suggest that at higher redshifts PEP-selected galaxies were more actively forming stars than their lower-z counterparts. At the same time, they also contained a lower fraction of their mass in (evolved) stars. These findings then converge at indicating an evolutionary picture whereby the bulk of stellar formation within massive galaxies took place at (in excellent agreement with the results on the cosmic evolution of the star formation rate – e.g. Madau et al. 1996). The intensity of this dramatic process then decreases as we approach the local universe, and already by star formation activity within massive galaxies is largely reduced as most of the stars within such galaxies have already been formed.
8 conclusions
We have presented the first direct estimates of the 3D correlation properties of far-infrared-selected sources up to redshifts . This has been possible thanks to the Pacs Evolutionary Probe (PEP) survey of the GOODS South field performed with the PACS instrument onboard the Herschel Satellite. 550 and 502 sources were detected respectively in the 100m and in the 160m channels down to fluxes mJy and mJy, cuts which ensure 80% completeness of the two catalogues.
These two samples have then been cross-correlated with the MUSIC (Santini et al. 2009) catalogue in order to provide counterparts at other wavelenghts to the PEP sources and, where possible, to also assign them a (either photometric or where available spectroscopic) redshift. This was possible in more than 65% of the cases, independent of infrared flux. This apparent incompleteness in the success rate for redshift determination is merely due to the fact that the PEP survey covers an area which is larger than those probed by surveys at smaller (mostly optical and near-IR) surveys. In fact, the above percentage rises to % in the inner portion of the GOODS-S, i.e. virtually all PEP sources are endowed with a redshift estimate.
Sources blindly detected at 100m and 160m above the 80% completeness limit have then been used to calculate the angular two-point correlation function of far-infrared galaxies over the whole redshift range spanned by the data. Under the assumption of a power-law behaviour , for a fixed value of , we find an amplitude , identical within the uncertainties at both frequencies. By using the redshift distributions derived from the MUSIC catalogue, we then obtain values for the comoving correlation length Mpc and Mpc, respectively at 100m and 160m. Within the halo bias approach (Mo & White 1996), such a clustering strength corresponds to dark matter haloes of masses .
These values are in excellent agreement with those of Gilli et al. (2007), obtained for a sample of
Luminous Infrared Galaxies selected at 24m in the same GOODS South field.
Also, the number densities of their sources and of our far-infrared galaxies coincide, indicating that these two classes of objects refer to the same galaxy
population.
It is also worth noticing that our results are compatible with those derived at 250m by Maddox et al. (2010) and Cooray et al. (2010) in the case of SPIRE-selected sources. In particular, Cooray et al. (2010) find values for the dark halo masses which are in excellent agreement with our estimates.
With the aim of studying in greater detail the large-scale structure traced by actively star-forming galaxies in the redshift range where most of the cosmic star-formation activity is confined, we have then selected sources from the 100m and 160m catalogues in the interval. An analysis of the de-projected two-point correlation function in this case gives
Mpc and Mpc at the two frequencies of interest. By using once again the halo bias model, the above values correspond to halo masses .
These are extremely high values and well match those found for similarly star-forming galaxies selected at other wavelenghts in the same redshift range (e.g. Magliocchetti et al. 1999; Arnouts et al. 2002; Farrah et al. 2006b; Magliocchetti et al. 2007; 2008; Brodwin et al. 2008; Weiss et al. 2009; Foucaud et al. 2010; Hartley et al. 2010; Wake et al. 2011) and for quasars at earlier epochs (Shen et al. 2007).
Furthermore, by combining our clustering results with the information on stellar masses for galaxies in the GOODS-S, we find that the ratio
between average values of the stellar mass at different epochs increases when going from to by about a factor 10 less
than what happens in the case of the
dark matter haloes hosting such galaxies ( vs. ).
When compared with recent results taken from the literature (e.g. Foucaud et al. 2010; Wake et al 2011; Moster et al. 2010 to mention a few),
our findings converge at confirming the evolutionary picture of downsizing wherby massive galaxies at were more actively forming stars than
their counterparts and at the same time also contained a lower fraction of their mass in (evolved) stars.
This is also in agreement with the most recent results on the evolution of the cosmic star formation rate (cfr. e.g. Gruppioni et al. 2010) and
indicates that the bulk of stellar formation within massive galaxies took place at .
The intensity of this dramatic process then decreases as we approach the local universe, and already by star forming activity
is largely reduced as most of the stars within such galaxies have already been formed.
A deeper investigation of the PEP maps indicate that the strong clustering signal detected for PEP galaxies is due to the presence, more visible at 100m than in the other band, of a wide (at least 4 Mpc across in projection), , filamentary structure which includes more than 50% of the sources detected above the % completeness level at .
Such an overdensity, already detected in Salimbeni et al. (2009) but with a lower statistical significance, extends all along the GOODS-S and seems to be made of a more diffuse structure at , ’bracketed’ at the two ends of its length by two more concentrated clumps set at redshifts and . The total number of 100m-selected galaxies down to the PEP,
mJy flux limit and residing in the overdensity is 28.
We stress that this sample is not expected to be complete, both for geometrical reasons (filament possibly extending beyond the edges of the surveyed area) and in terms of flux limits (completeness of the 100m band just 10% at 1 mJy).
It is nevertheless interesting to compare some of the properties of the galaxies which reside within the overdensity with those of more isolated or ’field’ sources, otherwise selected with the same criteria. For instance, a comparison between the distribution of bolometric luminosities for these two classes of objects shows a trend for galaxies belonging to the filamentary super-structure to be more luminous than field sources. If confirmed by analyses performed on larger datasets, this result also implies a higher star formation rate in proto-cluster objects as compared with isolated galaxies, finding which is likely due to the joint effect of large reservoirs of gas available at high redshifts in deep potential wells such as those associated to large overdensities and the enhanced rate of encounters between sources favoured by their proximity.
As a last consideration, we note that extended proto-clusters of star-forming galaxies at seem to be relatively common events, especially when found in association with radio sources (see e.g. Pentericci et al. 2000; Steidel et al. 2005; Andreani, Magliocchetti & de Zotti, 2009; Hatch et al. 2010 and references therein).
However, a systematic study of these objects is currently limited by the capabilities of the state-of-the-art instruments which either sample wide but shallow fields or concentrate on deeper/pencil-beam-like surveys.
Deeper/wider area surveys in the far-IR regime such as those planned for the SPICA mission (SPICA Study Team Collaboration, 2010) will be able to provide a
more statistically significant census of these highly dense regions so to characterize the interplay between formation and evolution of the large-scale structure and of the galaxies that trace it right at the epoch when most of the cosmic action takes place.
Acknowledgements
We thank the referee for his/her constructive suggestions which helped shaping and improving the paper.
PACS has been developed by a consortium of institutes led by MPE
(Germany) and including UVIE
(Austria); KU Leuven, CSL, IMEC (Belgium); CEA, LAM (France); MPIA
(Germany); INAF-
IFSI/OAA/OAP/OAT, LENS, SISSA (Italy); IAC (Spain). This development
has been supported by the
funding agencies BMVIT (Austria), ESA-PRODEX (Belgium), CEA/CNES
(France), DLR (Germany),
ASI/INAF (Italy), and CICYT/MCYT (Spain).
References
- [Ad2005] Adami C. et al., 2005, A&A, 443, 805
- [And2010] Andreani P., Magliocchetti M., de Zotti G., 2010, MNRAS, 401, 15
- [Ar2002] Arnouts S. et al., 2002, MNRAS, 329, 355
- [Berta2010] Berta S. et al., 2010, A&A, 518, L30
- [Best2007] Best P.N., von der Linden A., Kauffmann G., Heckman T. M., Kaiser C. R., 2007, MNRAS, 379, 894
- [\citeauthoryearBrod2008] Brodwin M. et al., 2008, ApJ, 687, 65
- [\citeauthoryearBruz2003] Bruzual G., Charlot S., 2003, MNRAS, 344, 1000
- [Bundi2005] Bundy K. et al., 2006, ApJ, 651, 120
- [cal2010] Calzetti D., Kinney A., Storchi-Bergmann T., 1994, ApJ, 429, 582
- [car2010] Cardamone C.N. et al., 2010, ApJS, 721, 38
- [cas2000] Casertano S. et al. 2000, AJ, 120, 2747
- [cimatti2004] Cimatti A., Daddi E., Renzini A., 2006, A&A, 453, L29
- [cor2010] Cooray A. et al., 2010, A&A, 518, L22
- [cowie1996] Cowie L.L., Songaila A., Hu E., Cohen J.G., 1996, AJ, 112, 839
- [Daddi2001] Daddi E. et al. 2001, ApJ, 600, L127
- [dale2002] Dale D.A., Helou G., 2002, ApJ, 576, 159
- [diaz2007] D az-Sanchez A., Villo-P rez I., P rez-Garrido A., Rebolo R. 2007, MNRAS, 377, 516
- [es2009] Estrada J. et al., 2009, ApJ, 692, 265
- [fang2004] Fang F. et al., 2004, ApJS, 154, 35
- [far12006] Farrah D. et al., 2006a, ApJ, 641, L17
- [far22006] Farrah D. et al., 2006b, ApJ,643, L139
- [\citeauthoryearFontana et al.2004] Fontana A. et al., 2004, A&A, 424, 23
- [fou2010] Foucaud A., Conselice C.J., Hartley W.G., Lane K.P., Bamford S.P., Almaini O., Bundy K., 2010, MNRAS, 406, 147
- [\citeauthoryearGilli et al.2007] Gilli R. et al. 2007, A&A, 475, 83
- [gra2004] Granato G.L., De Zotti G., Silva L., Bressan A., Danese L., 2004, ApJ, 600, 580
- [\citeauthoryearGraz et al.2006] Grazian A. et al. 2006, A&A, 449, 951
- [\citeauthoryearGrup et al.2019] Gruppioni C. et al., 2010, A&A, 518, L27
- [guzzo2000] Guzzo L. et al., 2000, ASPC, 200, 349
- [hatch 2010] Hatch N. et al., 2010, arXiv:1008.4588
- [\citeauthoryearLe Fevre2007] Le Fevre O. et al., 2005, A&A, 439, 877
- [Hamilton1993] Hamilton A.J.S., 1993, ApJ, 417, 19
- [Hart2010] Hartley W.G. et al., 2010, MNRAS, 407, 1212
- [Heavens2004] Heavens A., Panter B., Jimenez R., Dunlop J., 2004, Nature, 428, 625
- [Kennicutt1998] Kennicutt R.C.Jr. et al., 1998, ApJ, 498, 181
- [le2011] Leauthaud A. et al., 2011, ApJ, submitted, arXiv:11040928
- [Marcillac2006] Marcillac D., Elbaz D., Charlot S., Liang Y.C:, Hammer F., Flores H., Cesarsky C., Pasquali A., 2006, A&A, 458, 369
- [Mc2006] McLure R.J. et al., 2006, MNRAS, 372, 357
- [Madau1996] Madau P., Ferguson H.C:, Dickinson M.E., Giavalisco M., Steidel C.C., Fruchter A., 1996, MNRAS, 283, 1388
- [Maddox2010] Maddox S.J. et al., 2010, A&A, 518, L11.
- [Mad2003] Madgwick D. et al., 2003, MNRAS, 344, 847.
- [Maglio21999] Magliocchetti M., Maddox S.J., 1999, MNRAS, 306, 988
- [Maglio32004] Magliocchetti M. et al. (2dFGRS Team), 2004, MNRAS, 350, 1485
- [Maglio12007] Magliocchetti M., Silva L., Lapi A., De Zotti G., Granato G.L., Fadda D., Danese L., 2007, MNRAS, 375, 1121
- [Maglio42007] Magliocchetti M., Brüggen M., 2007, MNRAS, 379, 260
- [Maglio22008] Magliocchetti M. et al., 2008, MNRAS, 383, 1131
- [Me2008] Meneux B. et al., 2008, A&A, 478, 299
- [Mos2010] Moster B.P., Somerville R.S., Maulbetsch C., Van Den Bosch F.C., Maccio’ A.V., Naab T., Oser L., 2010, ApJ, 710, 903
- [Mo1996] Mo H.J., White S.D.M., 1996, MNRAS, 282, 347
- [Norberg2002] Norberg P. et al., 2002, MNRAS, 332, 827
- [oke 1970] Oke J.B., 1970, ApJS, 27, 21
- [Peebles1980] Peebles P.J.E., 1980, The Large-Scale Structure of the Universe, Princeton University Press
- [Pen 2003] Pentericci L. et al., 2000, A&A, 361, L25
- [Pil 2010] Pilbratt G. et al., 2010, A&A, 518, L1
- [Pog 2010] Poglitsch A. et al., 2010, A&A, 518, L2
- [Poll 2007] Polletta M. et al., 2007, ApJ, 663, 81
- [Pop 2010] Popesso P. et al., 2010, A& A, submitted
- [Porci1 2004] Porciani C., Magliocchetti M., Norberg P., 2004, MNRAS, 355, 1010
- [Rodi 2007] Rodighiero G., Cimatti A., Franceschini a., Brusa M., Fritz J., Bolzonella M., 2007, A&A, 470, 21
- [Rodi 2010] Rodighiero G. et al., 2010, A&A, 518, L25
- [Ross 2009] Ross N.P. et al. 2009, ApJ, 697, 1634
- [Sal2009] Salimbeni S. et al., 2009, A&A, 501, 865
- [Salp1955] Salpeter E., 1955, ApJ, 121, 161
- [\citeauthoryearsant et al.2009] Santini P. et al. 2009, A&A, 504, 751
- [\citeauthoryearSaracco et al.2006] Saracco P. et al., 2006, MNRAS, 367, 349
- [Scocci2001] Scoccimarro R., Sheth R.K., Hui L.,Jain B., 2001, ApJ, 546, 20
- [sheth 1999] Sheth R.K., Tormen G., 1999, MNRAS, 308, 119
- [shen 2007] Shen Y. et al., 2007, AJ, 133, 2222
- [spica 2010] SPICA Study Team Collaboration, 2010, arXiv:1001.0709
- [ste2005] Steidel C.C., Adelberger K.L., Shapley A.E., Erb D.K., Reddy N.A., Pettini M., 2005, ApJ, 626, 44
- [su1992] Sutherland W., Saunders W., 1992, MNRAS, 259, 413
- [treu2005] Treu T., Ellis R.S., Liao T.X., van Dokkum P.G., 2005, ApJ, 622, L5
- [Van2005] Vanzella E. et al. 2005, A&A, 434, 53
- [Wa2011] Wake D.A. et al., 2011, 728, 46
- [We2009] Weiss A. et al., 2009, ApJ, 707, 1201
- [Willia1996] Williams R.E. et al., 1996, AJ, 306, 1335
- [Willum1997] Willumsen J.V., Freudling W, Da Costa L.N., 1997, ApJ, 481, 571
- [Zehavi2005] Zehavi I. et al., 2005, ApJ, 630, 1