Temperature dependence of low-energy phonons in magnetic non-superconducting TbNi2B2C
Abstract
We report temperature dependence of low-energy phonons in magnetic nonsuperconducting TbNi2B2C single crystals measured by inelastic neutron scattering. We observed low-temperature softening and broadening of two phonon branches, qualitatively similar to that previously reported for superconducting RNi2B2C (R = rare earth, Y) compounds. This result suggests that superconductivity in TbNi2B2C compounds is absent not because of weak electron-phonon coupling but as a result of pair breaking due to magnetism.
pacs:
74.70.Dd,74.25.Kc,78.70.Nx, 63.20.kdKey words: Borocarbides, Phonons, Neutron inelastic scattering, Electron-phonon interaction
I INTRODUCTION
In some rare-earth nickel borocarbides RNi2B2C, superconductivity coexists with magnetic order Eisaki et al. (1994); Lai et al. (1995). Extensive neutron and x-ray scattering experiments revealed an incommensurate magnetic structure below approximately 15 K in both superconducting Er, Ho Zarestky et al. (1995); Sinha et al. (1995); Goldman et al. (1994); Vogt et al. (1995) and nonsuperconducting Tb, Gd Dervenagas et al. (1996); Detlefs et al. (1996) compounds. This observation was interpreted in terms of common Fermi-surface nesting features along , which cause magnetic ordering of the rare-earth moments via the Ruderman-Kittel-Kasuya-Yosida (RKKY) mechanism Dervenagas et al. (1996). Mssbauer spectroscopy and muon- spin relaxation (SR) studies of polycrystalline TbNi2B2C Sánchez et al. (1998) confirmed the presence of a small ferromagnetic component below about 8 K previously observed via neutron diffraction Dervenagas et al. (1996) and magnetization measurements Tomy et al. (1996); Cho et al. (1996).
In addition to magnetic effects, strong phonon softening has been observed in superconducting RNi2B2C single crystals with Lu, Y, Er, and Ho Dervenagas et al. (1995); Stassis et al. (1997); Kawano et al. (1996); Kawano-Furukawa et al. (2002), while no significant temperature dependence of the phonon spectra was detected for the nonsuperconducting TbNi2B2C Kreyssig et al. (2004a). The superconducting transition temperature systematically decreases for RNi2B2C (=Lu, Y, Tm, Er, and Ho) upon going from Lu ( 16.6 K) to Ho ( 7.5 K). This observation was interpreted by H. Eisaki et al. in terms of increasing coupling between the rare-earth magnetic moments and the conduction electrons Eisaki et al. (1994), which suppressed superconductivity. For TbNi2B2C, this pair breaking could be strong enough to completely destroy superconductivity. An alternative possibility for the absence of superconductivity in this system is that electron-phonon coupling is weaker than in the superconducting compounds Kreyssig et al. (2004a).
We investigated the strength of electron-phonon coupling in TbNi2B2C by detailed measurements of the temperature dependence of low-energy phonons in the magnetic nonsuperconducting TbNi2B2C by inelastic neutron scattering. The observed softening of these phonon branches in this compound upon cooling from 300 to 30 K indicates that electron-phonon interactions in magnetic nonsuperconducting TbNi2B2C are strong and, although weaker, are of the same order of magnitude as those in superconducting RNi2B2C compounds.
II EXPERIMENTAL DETAILS
Intermetallic RNi2B2C borocarbides crystallize in the body-centered tetragonal LuNi2B2C structure with the space group , which consists of C layers separated by Ni2B2 sheets Siegrist et al. (1994). All crystallographic parameters, i.e., the lattice contants a and c as well as the z position of boron, scale roughly with the ionic radius of the rare earth. TbNi2B2C compounds exhibit antiferromagnetic ordering at low temperatures below 15 K with the magnetic Tb3+ moments aligned along the a axis and modulated with the propagation vector Dervenagas et al. (1996); Lynn et al. (1997). No superconductivity has been detected in this compound down to 7 mK Bitterlich et al. (1998).
Rodlike TbNi2B2C single crystals were grown by the floating zone method using 11B isotope to avoid strong neutron absorption Souptel et al. (2005). Specimens with a length of 6 mm were cut from the rods with 6 mm diameter. For the inelastic neutron-scattering experiments the samples were oriented in the scattering plane. The measurements were performed on the triple-axis spectrometer 1T1 at the Laboratoire Lon Brillouin, Saclay. Phonons propagating in [ 0 0] direction, where is a reduced wave vector, were recorded in the Brillouin zone centered at (0 0 8) by energy scans using a fixed final energy meV at temperatures between 2 and 300 K.
III EXPERIMENTAL RESULTS
When phonons weakly couple to the conduction electrons their energies and lifetimes slightly harden and narrow upon cooling due to decreased anharmonicity. However, when phonons strongly couple to conduction electrons in the nearly nested regions of the Fermi surface, they soften and broaden upon cooling as the Fermi surface sharpens. Inelastic neutron- or x-ray-scattering measurements of phonons are the most direct way to identify the phonon modes strongly coupled to electrons. Due to the relatively large size of the available single crystal, we carried out our investigation using inelastic neutron scattering
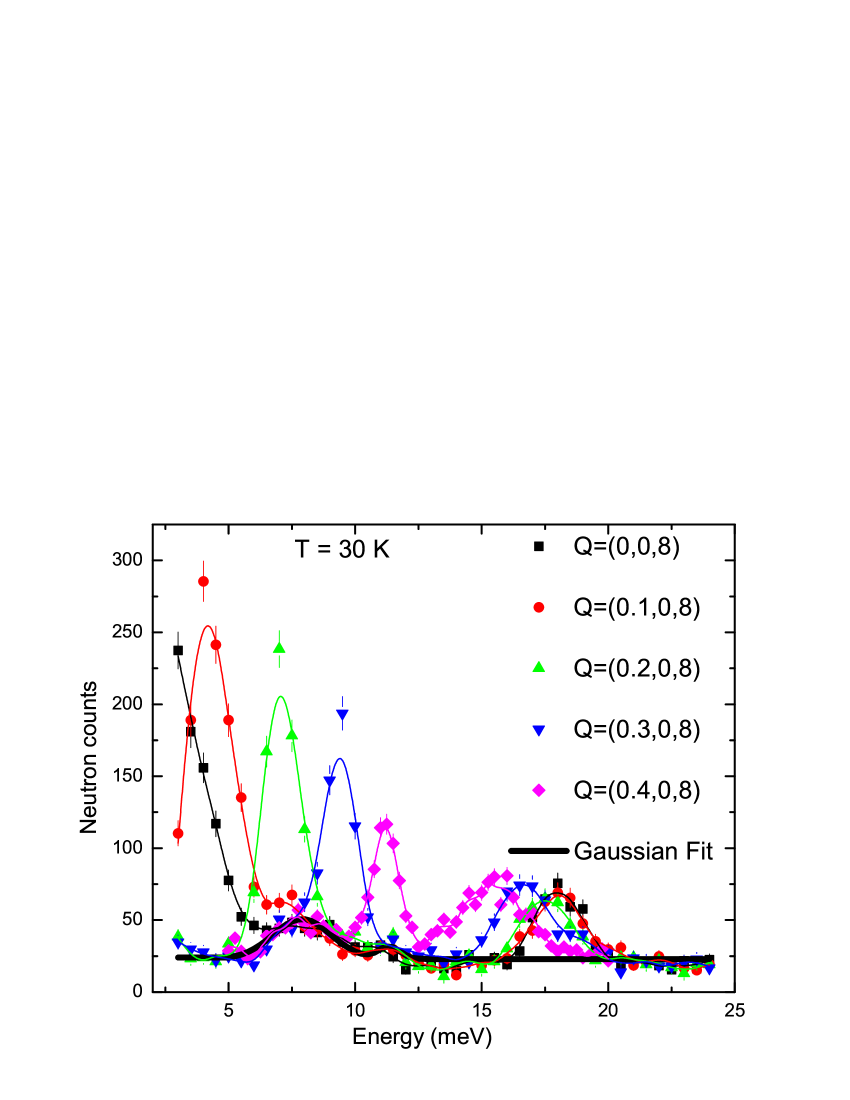
Figure 1 illustrates how we determined the background that was subtracted from the raw data to obtain the phonon spectra. It shows energy scans near the zone center at 30 K. The strongest peaks result from upward-dispersing acoustic phonons. The inelastic peaks between 15 and 18 meV originate from downward-dispersing optical phonons. In addition to phonons, crystal-electric-field (CEF) transitions are present between 5 and 13 meV Kreyssig et al. (2004b). For the purpose of studying the phonons, the CEF excitations contribute to the background. CEF excitations are dispersionless, and their form factor is nearly Q-independent in the narrow Q-range of interest. We determined them from the spectra where they do not overlap with phonons. The bold solid line in Fig. 1 represents the background, which includes Gaussian peaks due to CEF excitations and a straight line due to other energy-independent sources of background. It was subtracted from the data to isolate the one-phonon scattering shown in subsequent figures.
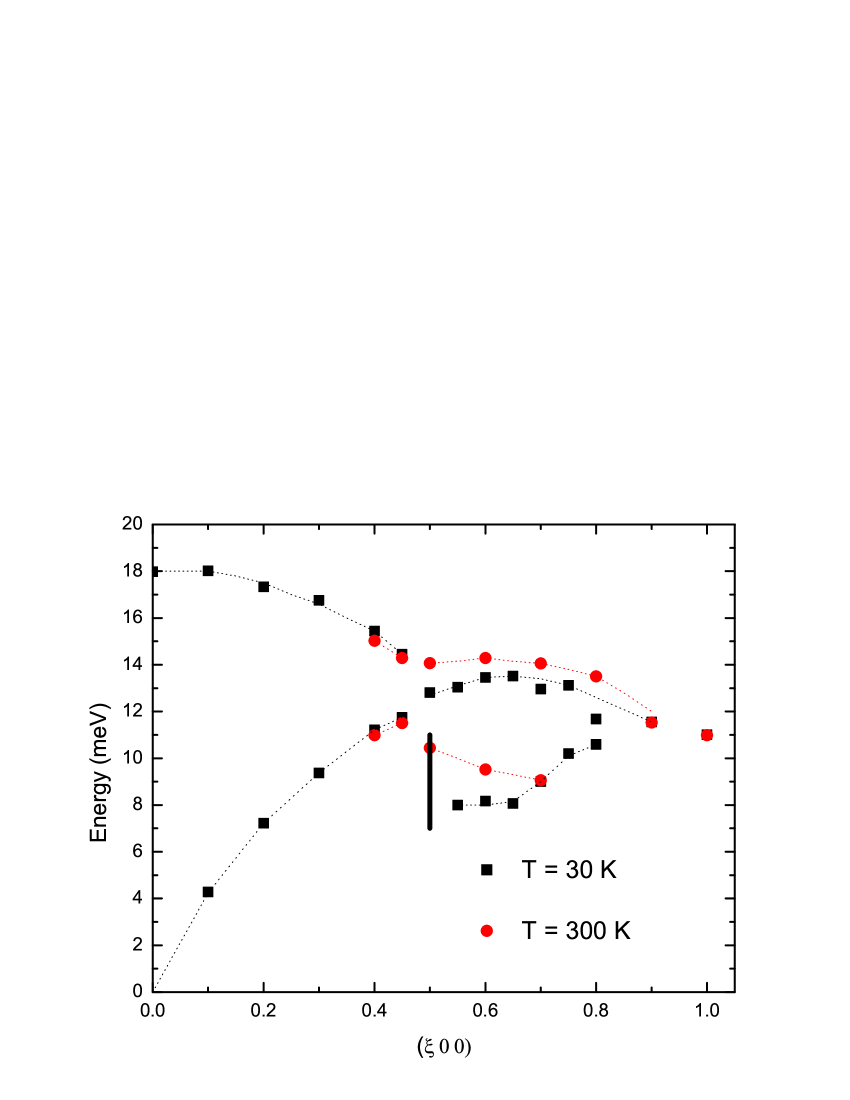
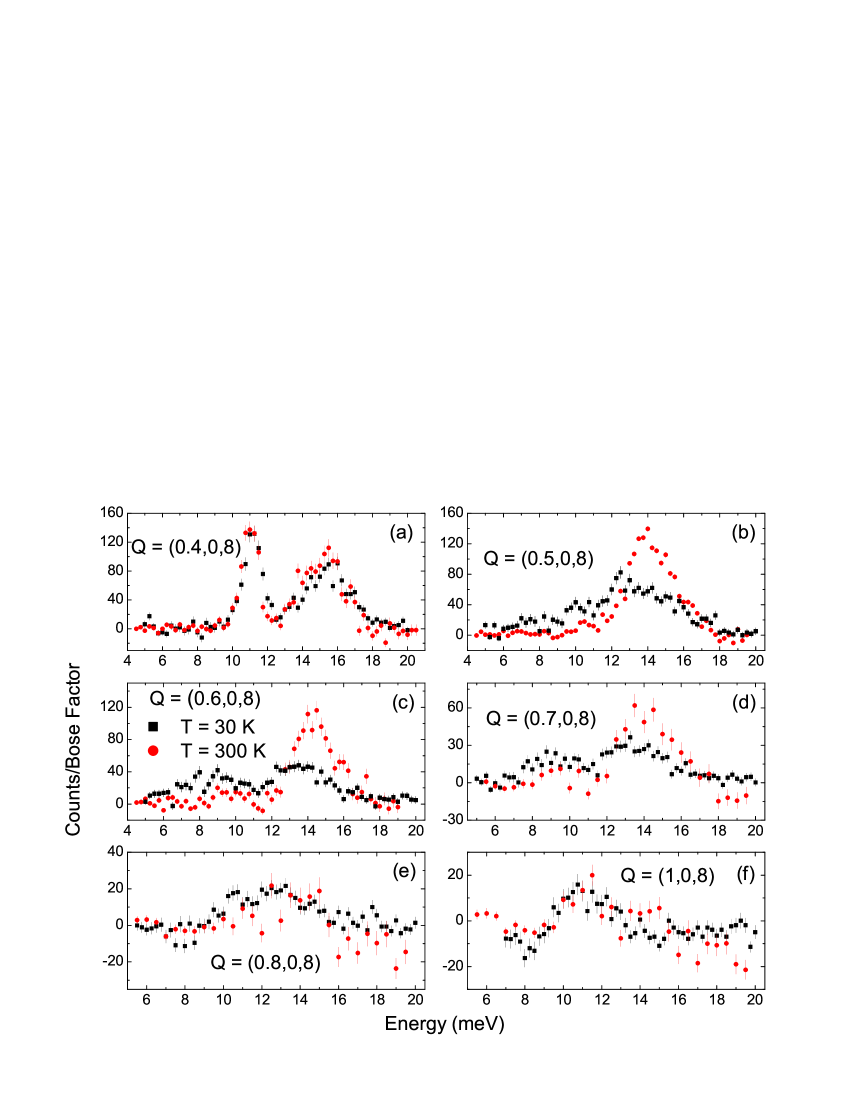
Figure 2 shows the temperature dependencies of phonon spectra at different wave-vector transfers () to the neutron at 30 and 300 K. The CEF contribution was subtracted from all low-temperature spectra as described above. We did not attempt to identify the contribution of the CEF excitations at 300 K, because they become weaker at high , whereas phonons become stronger due to the Bose factor, . Thus their contribution to the scattering intensity becomes negligible. The data were divided by the Bose factor to correct for the temperature dependence of the one-phonon scattering, which also removed most temperature dependence from the background. High-temperature curves were scaled with the low-temperature ones by subtracting a constant, which is reasonable, because the background increases with . Phonon spectra of the optical mode between 10 and 15 meV soften and broaden from 300 to 30 K at , , , and , whereas the spectra at , (not shown), and are nearly temperature independent.
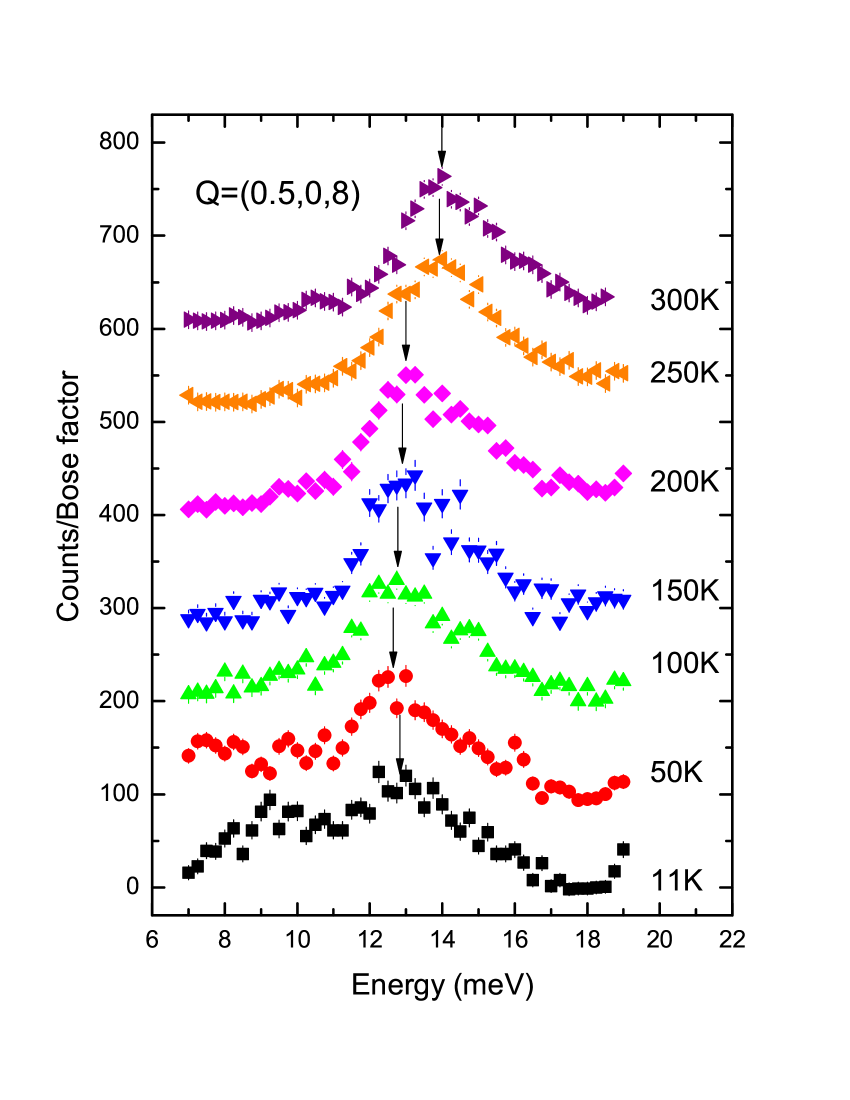
Figure 3 shows the dispersion of the two low-energy acoustic and optical phonon branches propagating along the direction at 30 and 300 K. The energy scans were fitted by Gaussian peaks. The dispersion of the two interesting phonon branches at 2 K is similar to the dispersion measured in the temperature range 11 — 100 K and there is no softening below 100 K Kreyssig et al. (2004a). However, strong softening of both branches appears between 100 and 300 K between (0.5,0,8) and (0.8,0,8). Our low-temperature data reveal a discrepancy in the energy range meV as compared to Ref. Kreyssig et al. (2004a) which can be attributed to a different interpretation of CEF contribution. Unlike Ref. Kreyssig et al. (2004a), we observe a strong dip of the low-energy phonon branch for wave vectors between (0.5,0,8) and (0.75,0,8) at low temperatures, which is weaker but of the same order of magnitude as the one found in superconducting HoNi2B2C. This result indicates that electron-phonon coupling in TbNi2B2C is strong enough to mediate superconductivity (perhaps with a lower ) in the absence of a pair-breaking mechanism.
Figure 4 illustrates the temperature dependence of the optic phonon at Q=(0.5,0,8). Here we show the raw data divided by the Bose factor without subtracting the background. The curves are vertically shifted with the arrows indicating the phonon peak position. The lowest temperature scan contains an additional feature at 9 meV to which both the acoustic phonon and the CEF excitation contribute. We have not measured the temperature dependence of the CEF excitation, so it is not possible to determine the temperature dependence of the acoustic phonon based on the available data. However, the optic phonon does not overlap with the CEF excitation and the data on its T dependence are unambiguous. We observe a softening from room temperature to 100 K of 1 meV. Below 100 K, it shows no peak position shift.
IV DISCUSSION AND CONCLUSIONS
Strong softening of two low-energy phonon branches was observed by neutron scattering in superconducting RNi2B2C single crystals with Lu, Y, and Er Dervenagas et al. (1995); Stassis et al. (1997); Kawano et al. (1996); Kawano-Furukawa et al. (2002). Point-contact spectroscopy revealed strong electron-phonon interaction in the superconducting RNi2B2C compounds with Y and Ho, in contrast to the nonsuperconducting LaNi2B2C Yanson et al. (1997), which suggests that the presence of superconductivity is controlled by the strength of electron-phonon coupling as opposed to magnetic pair breaking. However, our inelastic neutron scattering experiments on nonsuperconducting TbNi2B2C clearly demonstrate strong electron-phonon coupling in this compound. Thus we conclude that superconductivity in TbNi2B2C is absent due to magnetic pair breaking.
Previous studies of the competition between magnetism and superconductivity in RNi2B2C superconductors with the magnetic rare-earth elements Lu, Tm, and Er revealed a very weak coupling between the rare-earth magnetic moments and the conduction electrons due to a small conduction-electron density at the rare-earth site Eisaki et al. (1994). In contrast, a strong magnetic pair-breaking effect has been observed in Dy and Tb samples Eisaki et al. (1994) which gives additional evidence that superconductivity in magnetic TbNi2B2C is indeed destroyed by the substantially strong interaction between the local magnetic moments and the conduction electrons. In summary, electron-phonon coupling in magnetic nonsuperconducting TbNi2B2C is strong enough to mediate superconductivity. This implies that its absence can only result from magnetic pair breaking.
V ACKNOWLEDGMENTS
The work by AK at the Ames Laboratory was supported by the U.S. Department of Energy, Office of Basic Energy Science, Division of Materials Sciences and Engineering, through Contract No. DE-AC02-07CH11358.
References
- Eisaki et al. (1994) H. Eisaki, H. Takagi, R. J. Cava, B. Batlogg, J. J. Krajewski, W. F. Peck, K. Mizuhashi, J. O. Lee, and S. Uchida, Phys. Rev. B 50, 647 (1994).
- Lai et al. (1995) C. C. Lai, M. S. Lin, Y. B. You, and H. C. Ku, Phys. Rev. B 51, 420 (1995).
- Zarestky et al. (1995) J. Zarestky, C. Stassis, A. I. Goldman, P. C. Canfield, P. Dervenagas, B. K. Cho, and D. C. Johnston, Phys. Rev. B 51, 678 (1995).
- Sinha et al. (1995) S. K. Sinha, J. W. Lynn, T. E. Grigereit, Z. Hossain, L. C. Gupta, R. Nagarajan, and C. Godart, Phys. Rev. B 51, 681 (1995).
- Goldman et al. (1994) A. I. Goldman, C. Stassis, P. C. Canfield, J. Zarestky, P. Dervenagas, B. K. Cho, D. C. Johnston, and B. Sternlieb, Phys. Rev. B 50, 9668 (1994).
- Vogt et al. (1995) T. Vogt, A. Goldman, B. Sternlieb, and C. Stassis, Phys. Rev. Lett. 75, 2628 (1995).
- Dervenagas et al. (1996) P. Dervenagas, J. Zarestky, C. Stassis, A. I. Goldman, P. C. Canfield, and B. K. Cho, Phys. Rev. B 53, 8506 (1996).
- Detlefs et al. (1996) C. Detlefs, A. I. Goldman, C. Stassis, P. C. Canfield, B. K. Cho, J. P. Hill, and D. Gibbs, Phys. Rev. B 53, 6355 (1996).
- Sánchez et al. (1998) D. R. Sánchez, M. A. C. de Melo, M. B. Fontes, S. L. Bud’ko, E. Baggio-Saitovitch, M. Hillberg, W. Wagener, H.-H. Klauß, G. H. Walf, and F. J. Litterst, Phys. Rev. B 57, 10268 (1998).
- Tomy et al. (1996) C. V. Tomy, L. A. Afalfiz, M. R. Lees, J. M. Martin, D. M. Paul, and D. T. Adroja, Phys. Rev. B 53, 307 (1996).
- Cho et al. (1996) B. K. Cho, P. C. Canfield, and D. C. Johnston, Phys. Rev. B 53, 8499 (1996).
- Dervenagas et al. (1995) P. Dervenagas, M. Bullock, J. Zarestky, P. Canfield, B. K. Cho, B. Harmon, A. I. Goldman, and C. Stassis, Phys. Rev. B 52, R9839 (1995).
- Stassis et al. (1997) C. Stassis, M. Bullock, J. Zarestky, P. Canfield, A. I. Goldman, G. Shirane, and S. M. Shapiro, Phys. Rev. B 55, R8678 (1997).
- Kawano et al. (1996) H. Kawano, H. Yoshizawa, H. Takeya, and K. Kadowaki, Phys. Rev. Lett. 77, 4628 (1996).
- Kawano-Furukawa et al. (2002) H. Kawano-Furukawa, H. Yoshizawa, H. Takeya, and K. Kadowaki, Phys. Rev. B 66, 212503 (2002).
- Kreyssig et al. (2004a) A. Kreyssig, O. Stockert, D. Reznik, F. M. Woodward, J. W. Lynn, W. Reichardt, D. Souptel, G. Behr, and M. Loewenhaupt, Physica B 350, 69 (2004a).
- Siegrist et al. (1994) T. Siegrist, H. W. Zandbergen, R. J. Cava, J. J. Krajewski, and W. F. Peck, Nature 367, 254 (1994).
- Lynn et al. (1997) J. W. Lynn, S. Skanthakumar, Q. Huang, S. K. Sinha, Z. Hossain, L. C. Gupta, R. Nagarajan, and C. Godart, Phys. Rev. B 55, 6584 (1997).
- Bitterlich et al. (1998) H. Bitterlich, W. Loser, G. Behr, K. Nenkov, G. Fuchs, A. Belger, and L. Schultz, Physica C 308, 243 (1998).
- Souptel et al. (2005) D. Souptel, G. Behr, W. Loser, K. Nenkov, and G. Fuchs, Jour. of Crystal Growth 275, e91 (2005).
- Kreyssig et al. (2004b) A. Kreyssig, O. Stockert, D. Reznik, F. M. Woodward, J. W. Lynn, H. Bitterlich, D. Souptel, G. Behr, and M. Loewenhaupt, Physica C 408-410, 100 (2004b).
- Yanson et al. (1997) I. K. Yanson, V. V. Fisun, A. G. M. Jansen, P. Wyder, P. C. Canfield, B. K. Cho, C. V. Tomy, and D. M. Paul, Phys. Rev. Lett. 78, 935 (1997).