The nature and descendants of Lyman-break galaxies in the CDM cosmology.
Abstract
We predict the formation histories, properties and descendants of Lyman-break galaxies (LBGs) in the CDM cosmology. In our model, which incorporates a top-heavy IMF in starbursts, we find that most LBGs are starbursts triggered by minor mergers of galaxies. The duration of the LBG phase is predicted to be quite short, Myr. We investigate the distributions of stellar and halo masses and morphologies for bright () and faint () LBGs at , and (where we classify LBGs according to their rest-frame UV luminosities relative the observed characteristic luminosity at ). Bright LBGs at are predicted to have median stellar masses and host halo masses , and to be typically mildly disk-dominated in stellar mass. On the other hand, faint LBGs at are predicted to have median stellar masses of only and host halo masses , and to be generally bulge-dominated. Bright LBGs at evolve to present-day galaxies with median stellar mass (comparable to the Milky Way), consisting of roughly equal numbers of disk- and bulge-dominated systems, and hosted by halos with median mass (corresponding to medium-size galaxy groups). The model predicts that 40% of Milky Way mass galaxies at the present-day have a bright LBG progenitor in the redshift range , while 95% have a faint LBG progenitor in the same redshift range, and 7% have a faint LBG progenitor at . With our multiwavelength model, we also investigate the overlap between the LBG population and that of submillimetre selected galaxies (SMGs); at , only of bright LBGs are also predicted to also be bright SMGs (with an m flux in excess of 5 mJy).
keywords:
galaxies: evolution — galaxies: formation — galaxies: high-redshift — galaxies: starburst – cosmology: theory1 Introduction
High redshift galaxy populations identified using the Lyman-break drop-out technique have played a pivotal role in the development of our understanding of the global star formation history of the Universe (Madau et al., 1996; Steidel et al., 1999). The star formation rate density inferred from measurements of the galaxy luminosity function in the rest frame ultraviolet (UV) displays a broad peak around redshift , prior to a steep decline towards the present day (Lilly et al., 1996). This type of behaviour, which corresponds to a gradual build up of the global stellar mass in galaxies, arises naturally in hierarchical structure formation models, as shown by Cole et al. (1994) and confirmed in a range of calculations with varying galaxy formation physics (e.g. Baugh et al., 1998; Somerville et al., 2001; Springel & Hernquist, 2003). In general terms, the star formation rate density is set by the abundance of haloes as a function of mass which are in place at a given epoch, the ability of gas to cool within these haloes and the effectiveness of supernovae at reheating gas which has cooled. The star formation density peaks around because gas can cool efficiently at high densities and stays in the cold phase because there is, for the first time, a large population of haloes in which supernova heating is ineffective. In this paper we investigate the properties of Lyman-break galaxies (hereafter LBGs) in a hierarchical galaxy formation model and show how they are related to galaxies in the present day Universe.
The Lyman break technique is based on observing a break bluewards of the Lyman limit at 912Å in the rest-frame spectral energy distribution of a galaxy. The flux at these wavelengths is expected to be small for a number of reasons; i) few photons can be produced by stars at these short wavelengths, ii) such energetic photons can be absorbed by the atomic hydrogen in the interstellar medium within the galaxy, and iii) the photons can also be absorbed by intergalactic neutral hydrogen along the line of sight from the galaxy to the Earth. Galaxies identified with this technique are known as Lyman-break galaxies (hereafter LBGs,Steidel & Hamilton 1992; Steidel et al. 1996). The Lyman-break technique uses multi-band photometry. By using a suitable set of filters, galaxies in a particular range of redshifts can be isolated. Ground-based observations are restricted to applying the Lyman-break technique for galaxies at . For this redshift range, the absorption edge, which occurs in the far-UV, is shifted to wavelengths that are not blocked by the Earth’s atmosphere. The multi-band photometry is also used to make additional colour selections to minimize the contamination from foreground objects (both stars and lower redshift galaxies). LBGs are selected to be red in the shorter wavelength colour, due to the presence of the break, and blue in the longer wavelength colour, to show they are star-forming galaxies. Hot, high mass stars with short lifetimes tend to dominate the emission in the UV. Such stars spend a significant fraction of their lifetime within dense giant molecular clouds and their light is heavily extincted. Hence in order to infer a galaxy’s star formation rate from its UV luminosity requires an uncertain and quite often large correction for dust extinction. Furthermore, an assumption about the form of the initial mass function with which stars are produced is also required in order to infer the star formation rate.
In this paper we use a semi-analytical approach to model the galaxy formation process (see Baugh 2006 and Benson 2010 for reviews). This type of model can be used to make predictions for the properties of high redshift galaxies and can connect these objects to their present day descendants. This approach was first applied to the Lyman-break population by Baugh et al. (1998), who showed that the model of Cole et al. (1994) could reproduce the observed surface density of Lyman-break galaxies (e.g. Steidel et al., 1996). Somerville et al. (2001) applied similar techniques to argue that bursts triggered by minor and major galaxy mergers played a role in producing the LBG population. In this paper we use the version of the Durham GALFORM galaxy formation simulation code published by Baugh et al. (2005) to study LBGs and their descendants. This model invokes a different form for the stellar initial mass function in merger-driven starbursts, in order to reproduce the observed counts and redshift distribution of galaxies measured at sub-millimetre wavelengths. Baugh et al. (2005) showed that this model also matches the observed LBG luminosity function at , as well as giving a reasonable match to the present day galaxy population. González et al. (2009) extended the local tests of this model to include the size-luminosity relation for disk-dominated galaxies. The semi-analytical model naturally relates galaxies at high redshift to their local counterparts. In González et al. (2011) we followed the evolution of submillimetre galaxies (SMGs) and their descendants. In this paper, we carry out a similar analysis in the UV by studying the evolution and descendants of Lyman-break galaxies. In a companion paper to this one, Lacey et al. (2011) present model predictions for the evolution of the far-UV luminosity functions over the redshift range , and make a detailed comparison of these with current observational data. They also make predictions for the amount of dust extinction, and for the evolution of a wide variety of other properties of LBGs over a range of redshifts. The present paper instead looks in more detail at the formation histories and lifetimes of LBGs and the distributions of stellar and halo masses and morphologies for LBGs at selected redshifts and luminosities, and investigates the corresponding properties for their present-day descendants.
This paper is laid out as follows. In Section 2, we outline the GALFORM galaxy formation model. In Section 3, we review the model predictions for the luminosity function of LBGs, show examples of galaxy merger histories which include LBGs, and investigate the triggering and duration of the LBG phase. We also present the probability that a present day galaxy or halo had an LBG progenitor. In Section 4, we study different properties of the LBGs, such as stellar and host halo masses, and morphologies at redshifts , and , and discuss the dominant mode of star formation behind the LBGs. In Section 5, we examine the overlap between the LBG and SMG populations. Finally, we present a summary in Section 6. We quote magnitudes on the AB system and define the Hubble parameter as km s-1 Mpc-1.
2 The galaxy formation model
We first give a brief overview of the Durham semi-analytical galaxy formation code, GALFORM, before discussing two aspects which are of particular relevance for this paper, galaxy mergers and the form of the IMF adopted in different modes of star formation. Full details of GALFORM can be found in Cole et al. (2000) and Benson et al. (2003). The model used here is described in full in Baugh et al. (2005) and Lacey et al. (2008).
2.1 Basic Components
Galaxies are assumed to form inside dark matter haloes, with their subsequent evolution being controlled by the merger and accretion history of the halo (White & Rees, 1978). The physical processes modelled in GALFORM include: i) the hierarchical assembly of dark matter haloes; ii) the shock heating and virialization of gas inside the gravitational potential wells of dark matter haloes; iii) the radiative cooling of the gas to form a galactic disk; iv) star formation in the cool gas; v) the heating and expulsion of cold gas through feedback processes such as stellar winds and supernovae; vi) chemical evolution of gas and stars; vii) galaxy mergers within a common dark halo as the result of the decay of a galaxy’s orbit due to dynamical friction; viii) the evolution of the stellar populations using population synthesis models; ix) the extinction and reprocessing of starlight by dust.
We use the same galaxy formation parameters adopted by Baugh et al. (2005) and Lacey et al. (2008). The model is set in a cold dark matter plus cosmological constant cosmology, with present-day matter density parameter , a cosmological constant , a baryon density and a power spectrum normalization given by .
In this paper one of our primary goals is to connect high redshift galaxies with their present-day descendants. This requires a prescription for building halo merger histories which is accurate over a long interval in time. To achieve this we use the Monte-Carlo algorithm of Parkinson et al. (2008), which is a modified version of that proposed by Cole et al. (2000) and used in Baugh et al. (2005). The Parkinson et al. recipe has been tuned to match the merger histories extracted from the Millennium Simulation (Springel et al. 2005; see Harker et al. 2006 for a description of the construction of merger trees from the simulation). We note that Baugh et al. did not make any predictions which depended on the accuracy of the trees over long time intervals. Rather, they laid down grids of halos at a range of redshifts to compute the luminosity function of SMGs and other galaxies at these redshifts, and then, by integration, the number counts of SMGs and the cosmic star formation history. We have checked that using the Parkinson et al. tree algorithm does not alter the predictions presented in Baugh et al.
Dust extinction is expected to have a large effect on the far-UV luminosities of LBGs. We calculate dust extinction in the model using the approach described in Lacey et al. (2011), and we refer the reader to that paper for a discussion of the effects of dust extinction on LBGs. In summary, the dust extinction is calculated using a two-component dust model, with molecular clouds within which stars form embedded in a diffuse dust medium mixed with the stars and distributed in an exponential disk. All of the predictions which we show in this paper include the effects of dust extinction.
2.2 Galaxy mergers and merger-driven starbursts
When dark matter haloes merge, the galaxy in the most massive halo is assumed to become the central galaxy in the new halo while the other galaxies present become its satellites. In the standard form of GALFORM, we assume that central and satellite galaxies can form stars from their cold gas reservoirs, but that only central galaxies can continue to accrete cold gas. (Font et al. 2008 explore a variant of this model in which satellites are allowed to retain some fraction of their hot halo, depending on their orbit within the main halo, with gas allowed to cool onto the satellite disks.)
In the standard version of the model, mergers are assumed to happen only between satellites and central galaxies within the same halo (although Kim et al. 2009 considered a variant of this). Bursts of star formation are assumed to be triggered by galaxy mergers. Two types of mergers are defined, major mergers and minor mergers, according to whether the ratio of mass of the smaller to the larger galaxy exceeds the value of the parameter , i.e. . Bursts are assumed to be triggered in all major mergers, and also in minor mergers which satisfy and where the ratio of cold gas mass to stellar plus cold gas mass in the larger galaxy exceeds . The parameter values adopted in the Baugh et. al model are , =0.05 and . In a major merger, the stellar disks of the merging galaxies are assumed to be transformed into a new stellar spheroid (resulting in a pure bulge galaxy) and any gas present in the disks is converted into spheroid stars in a burst. In minor mergers, the stellar disk of the larger galaxy is preserved and the stars of the smaller, accreted galaxy are added to its bulge (resulting in a disk plus bulge galaxy). If the condition for a burst in a minor merger is satisfied, then the gas of the smaller galaxy is converted into stars. If the condition is not satisfied, any accreted gas is added to the gas disk of the central galaxy. From this description of the possible scenarios following a galaxy merger, it is readily apparent that mergers change the morphology of galaxies in the model, driving the morphology towards early types (bulge dominated), with the cooling of gas moving the galaxy towards late types (disk dominated).
2.3 The stellar IMF in quiescent and burst modes of star formation
An important feature of the Baugh et al. model is that stars are assumed to form with different stellar initial mass functions (IMFs) in different modes of star formation. Stars either form quiescently in galactic disks or in bursts triggered by some galaxy mergers, as explained in the subsection above. In the case of quiescent star formation, a standard solar neighbourhood IMF is adopted, following the form proposed by Kennicutt (1983), where the number of stars produced depends on mass as , with for and for . In the case of merger-driven starbursts, a top-heavy IMF is assumed where . The use of a top-heavy rather than solar neighbourhood IMF has three consequences; i) it increases the amount of radiation emitted in the UV, as a larger proportion of massive stars is produced, ii) there is higher yield of metals ( compared with for the Kennicutt IMF), leading to more dust and iii) the fraction of mass turned into stars which is recycled to the interstellar medium is larger ( compared with for the Kennicutt IMF). For a discussion of observational support for a top-heavy IMF see Lacey et al. (2008, 2010).
Finally, in closing this section we remind the reader that an alternative galaxy formation scenario was presented by Bower et al. (2006), who invoke a different mechanism to suppress the formation of galaxies in massive haloes than that used by Baugh et al. Bower et al. also invoke a standard IMF in both modes of star formation. Whilst this model gives a good match to the observed evolution of the K-band luminosity function and the inferred stellar mass function, it greatly underpredicts the number of submillimetre galaxies and gives a poorer match to the LBG luminosity function than the Baugh et al. model (see Lacey et al., 2011). For further discussion of the differences between these two models, see Almeida et al. (2007), Gonzalez-Perez et al. (2009) and González et al. (2009).
3 LBG formation histories and the probability of having a LBG progenitor

In this section we present some basic predictions for LBGs in the Baugh et al. model. We first compare the model predictions for the luminosity function in the UV at , and with observations, and use this to set up definitions of bright and faint LBGs. (For a more detailed comparison with observed LBG luminosity functions see Lacey et al. 2011.) We then present some illustrative galaxy formation histories for present day galaxies which had LBG progenitors. Finally we show the probability that a present-day galaxy had an LBG progenitor and that a present-day halo hosted an LBG.
3.1 The UV luminosity function: defining bright and faint Lyman-break galaxy samples.
As outlined in the Introduction, the Lyman-break technique relies on colour-colour selection to identify galaxies within a particular redshift range, which is set by the redshifted Lyman-break spectral feature falling between two of the filters used to image the galaxies. In the model we can make predictions for the galaxy population at any desired redshift by construction and so there is no need to apply any colour selection. Hence, we will use the far UV (1500Å) luminosity as our criterion to identify samples of Lyman-break galaxies. We focus our attention on three redshifts, , and , which are representative of the range covered by current LBG studies (Steidel et al., 2003; Bouwens et al., 2007, 2011).
Baugh et al. (2005) presented predictions for the rest-frame UV luminosity function at . Here we revisit this comparison, adding new observational data at and going to (see also Lacey et al. 2011). In Fig. 1 we show the predicted rest-frame Å luminosity function at , and , including the effects of dust extinction, calculated in a self-consistent way using the predicted scale lengths of the disk and bulge components and the metallicity of the cold gas. The model matches the observational data at , to within the scatter between datasets, is in good agreement with the measurement by Bouwens et al. (2007) at , and is consistent with the tentative measurement and upper limits estimated by Bouwens et al. (2011) at . Following the common practice in observational studies, we define a characteristic luminosity using the observed position of the break in the UV luminosity function at . We define a galaxy as a bright LBG if its UV luminosity is brighter than and as a faint LBG if its UV luminosity exceeds (a sample which includes the bright LBG sample, but which is dominated in number by galaxies close to the luminosity cut). We apply this definition at all redshifts. Note that is taken to be the characteristic luminosity at found by Steidel et al. (1999) (corresponding to in our cosmology). In Fig. 1 we show where the and limits lie using vertical lines.
We note in passing that there is substantial evolution in both the observed and predicted UV luminosity functions between and . The observed characteristic luminosity at ( in our cosmology, Bouwens et al. 2007) is nearly a magnitude fainter than the value of . The number density of galaxies seen at the value of drops by around a factor of between and . At , the abundance of galaxies with this luminosity is predicted to be several hundred times lower than at . A comprehensive study of the evolution of the LBG luminosity function, including a more detailed comparison with observational data, is presented in Lacey et al. (2011).
3.2 Example formation histories of model galaxies with Lyman-break progenitors
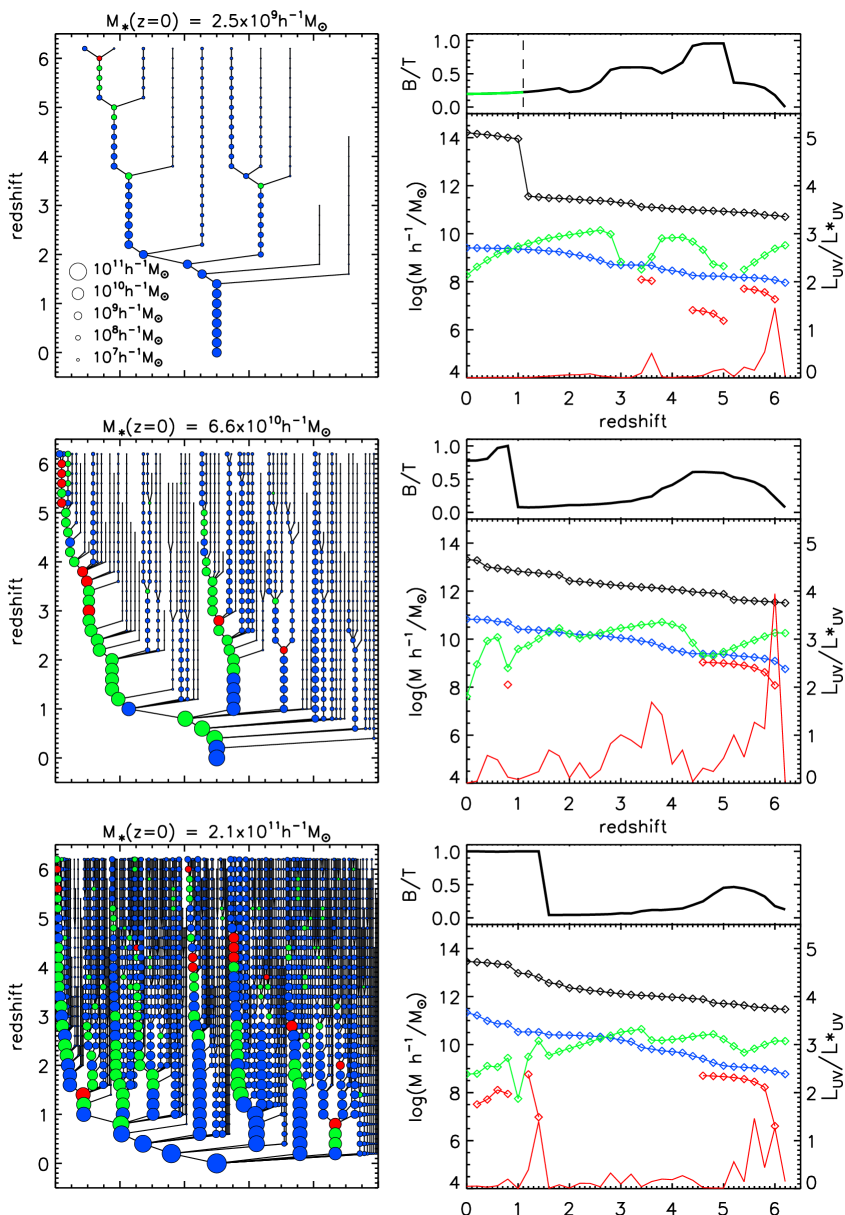
As examples of the different galaxy formation and merger histories which can produce bright LBGs, we plot in the left panels of Fig. 2 galaxy merger trees for three present-day galaxies. The mass of the galaxies increases down the page. The trees are constructed by running GALFORM with many output redshifts. We stop plotting the trees at or when a branch falls below a minimum galaxy mass (in stars and cold gas) of . A branch or trunk of the tree is plotted at each output redshift using a circle. The size of the circle is proportional to the stellar mass of the galaxy and the colour reflects the type of galaxy: green for a faint LBG, red for a bright LBG and blue otherwise.
The galaxy trees are plotted in the following way. Stepping back in time from , at each merger we plot the most massive branch on the left and the other branches to the right of this. The main progenitor branch is hence the leftmost plotted branch traced back from in this way. Note that at , the main progenitor branch does not necessarily represent the most massive progenitor across the whole tree at a given epoch. The largest progenitor at any time could jump from one branch of the galaxy tree to another, so its selection would not necessarily define a smooth path back in redshift. We have chosen to plot examples which have at least one LBG in the most massive (leftmost) progenitor branch.
In the first example (Fig. 2 top left), we show the galaxy merger tree for a galaxy which at has a stellar mass of and has a bright LBG progenitor at . In the second example (Fig. 2 middle left), we show a galaxy with at with a bright LBG progenitor at both and . In the third example (Fig. 2 bottom left), we show the galaxy merger tree for a galaxy with at with a bright LBG progenitor at . Note that these trees are purely illustrative examples, chosen to show the range of complexity of the trees, and are not intended to be a statistically representative sample.
The right-hand panels of Fig. 2 show the evolution of various properties of the galaxy in the most massive progenitor branch. The upper inset or subpanel in each case shows the bulge-to-total stellar mass ratio. If present, a vertical line in this panel marks the epoch when the most massive progenitor ceased to be a central galaxy and became a satellite. In the examples plotted here, this only happens in the case of the least massive galaxy tree shown (upper right Fig. 2), at . The main right-hand panel shows the UV luminosity of the most massive progenitor, in units of (red line; see right axis for units) and its stellar mass (blue symbols), cold gas mass (green symbols), stellar mass formed in bursts (red symbols) and host dark halo mass (black symbols; see left axis for units). In the case of the least massive galaxy (Fig. 2 top right), the most massive progenitor experiences a burst at which makes it a bright LBG. The stellar mass added to the bulge during the burst increases the bulge to total stellar mass ratio, and the cold gas supply is depleted. Around there is a another burst of star formation, triggered by a major merger, which leads to a large increase in the bulge-to-total ratio of the galaxy from 0.3 to 0.9. However, there is less star formation associated with this burst, due to the depletion of the gas reservoir prior to the burst, and the most massive progenitor is only a faint LBG. Another burst happens at , which makes the most massive progenitor galaxy a faint LBG but with relatively little change in the ratio. The ratio gradually declines as quiescent star formation adds mass to the disk. Finally, after a steady increase in mass, the host halo is accreted by a much more massive halo at , when the most massive progenitor becomes a satellite galaxy. The present-day galaxy is a satellite in a halo of mass . The next most massive galaxy (middle panels Fig. 2) displays two epochs at which the most massive progenitor is a bright LBG ( and ). The most massive progenitor branch in the most massive galaxy (bottom panels of Fig. 2) again shows several instances when the progenitor is a bright LBG. It undergoes a major merger at which increases the stellar mass by 30% (barely visible in the figure), triggers a bright LBG phase, and changes the morphology from to .
It is interesting to note that in all cases shown, the stellar mass of the most massive progenitor branch (shown by the blue points in the right-hand panels) increases steadily with redshift, without displaying any sudden large jumps. This implies that the bursts of star formation in these examples are not responsible for large changes in the stellar mass of the galaxy. This is a result in part of the large recycled fraction () for stars forming with the top-heavy IMF, together with the strong feedback from supernova explosions.
3.3 The triggering and duration of the Lyman-break phase
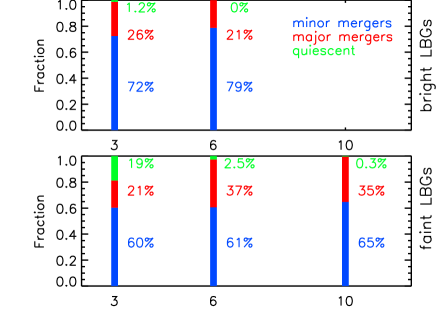


We can use the formation histories of model LBGs to answer some important questions. The first of these is: what is the mechanism of the star formation reponsible for the galaxy being seen as an LBG at a particular redshift? In the present model, the possibilities are: a starburst triggered by a minor galaxy merger; a starburst triggered by a major galaxy merger; and quiescent star formation in a galaxy disk. To determine which of these dominates in a particular case, we move back in time through the galaxy formation history, starting at the redshift at which a galaxy is identified as an LBG. If at any time during the current LBG phase the burst and quiescent SFRs satisfy the condition then we classify the LBG phase as being produced by quiescent star formation, otherwise we find the first galaxy merger (going back in time) and identify whether it is a minor or major merger. We include the factor 4 in the condition on the SFRs because stars forming with the top-heavy burst IMF produce roughly 4 times higher UV luminosities than the same mass of stars formed with the quiescent IMF. The results of this classification exercise are shown in Fig. 3, for bright LBGs () identified at and (top panel), and for faint LBGs () identified at , and (bottom panel). The fractions shown there are calculated for a volume-limited sample of LBGs at the identification redshift. We see from the figure that LBGs are predicted to be dominated by starbursts triggered by minor galaxy mergers (around 60-80% of cases) in all of the cases examined here. Minor mergers dominate over major mergers by a factor 2–4. Quiescent star formation is predicted to account for at most a few percent of LBGs, with the exception of faint LBGs at , where this fraction increases to around 20%. We also see that the quiescent fraction decreases with increasing redshift for both bright and faint LBGs, and is much smaller for bright LBGs than for faint LBGs at the same redshift. These results about the dominance of bursts over quiescent star formation in LBGs are in agreement with the analysis by Lacey et al. (2011).
A second question we can answer is: what is the time duration of the LBG phase? For bright LBGs, we define this as the time during which in the current LBG phase, while for faint LBGs we define the duration as the time during which . We show the distribution of LBG durations for volume-limited LBG samples in Fig. 4, where the top panel shows results for bright LBGs identified at and , and the lower panel faint LBGs identified at , and . For bright LBGs, the median duration is around 20 Myr at both and . For faint LBGs, the durations are generally larger, as expected, decreasing from around 60 Myr at to 30 Myr at and 20 Myr at . The short durations for bright LBGs reflect the relatively short timescales of the bursts responsible for most of them.
3.4 The fraction of present-day galaxies and halos with an LBG progenitor

Having shown some illustrative examples of galaxy merger trees with LBG progenitors in the previous subsection, we now perform a statistical study and compute the probability that a present-day galaxy had a progenitor that was an LBG or that a present-day halo had a progenitor halo which hosted an LBG.
The predictions for the fraction of present-day galaxies that are descendants of LBGs are presented in Fig. 5, with the top panels showing results for descendants of bright LBGs at and , and the lower panels results for descendants of faint LBGs at , and . (The model does not predict a significant number bright LBGs at .) In the left-hand panels we plot the fraction of present-day galaxies, as a function of their stellar mass, which are predicted to have at least one bright LBG progenitor in the specified redshift range. In the right-hand panels we show the fraction of present-day halos having progenitor halos which hosted an LBG in the specified redshift range. We see that the probability to have an LBG progenitor increases with increasing present-day mass (both stellar and halo), but decreases with increasing LBG redshift
Considering first the bright LBGs, we find that galaxies with stellar masses of , and are predicted to respectively have 10%, 50% and 90% probabilities of having at least one bright LBG progenitor in the range . The corresponding stellar masses for bright LBGs at are 4-15 times larger, being , and respectively. A Milky Way mass galaxy (, Binney & Tremaine 2008) is predicted to have a 40% or 3% probability of having a bright LBG progenitor at or , respectively. The right hand panels of Fig. 5 show that 50% of present-day haloes with a mass greater than are predicted to have halo progenitors that hosted bright LBGs at . The corresponding mass for bright LBGs at is an order of magnitude larger, .
Considering now the faint LBGs, we find that 10%, 50% and 90% of galaxies with present-day stellar masses of , and are predicted to have had faint LBG progenitors at . These masses increase steeply to , and for faint LBGs at , and steeply again to , and at . A Milky Way mass galaxy is predicted to have a 95% or 70% probability of having a faint LBG progenitor at or respectively. This probability drops to 7% for a faint LBG progenitor. Expressed in terms of halo masses (right-hand panels of Fig. 5), we find that 50% of halos today with masses larger than are predicted to have halo progenitors that hosted faint LBGs at , while for this increases to . Only for masses greater than are 50% of haloes predicted to have had at least one faint LBG progenitor at .
4 The properties of LBGs and their descendants
Having defined samples of bright and faint LBGs, we now compare the model predictions for their stellar mass, host halo mass and morphologies at redshifts , and . The semi-analytical model allows us to follow the subsequent evolution of the LBGs, so we also present the predictions for the analogous properties of the descendants of the LBGs. We also consider what is the dominant mode of star formation - burst or quiescent - in LBGs. Note that at , the model does not predict a significant population of bright LBGs (see Fig. 1). When we construct the distribution of properties of the descendants of LBGs, each descendant galaxy is counted once (with a weight depending on its abundance), regardless of the number of LBG progenitors it possesses.
4.1 Stellar masses
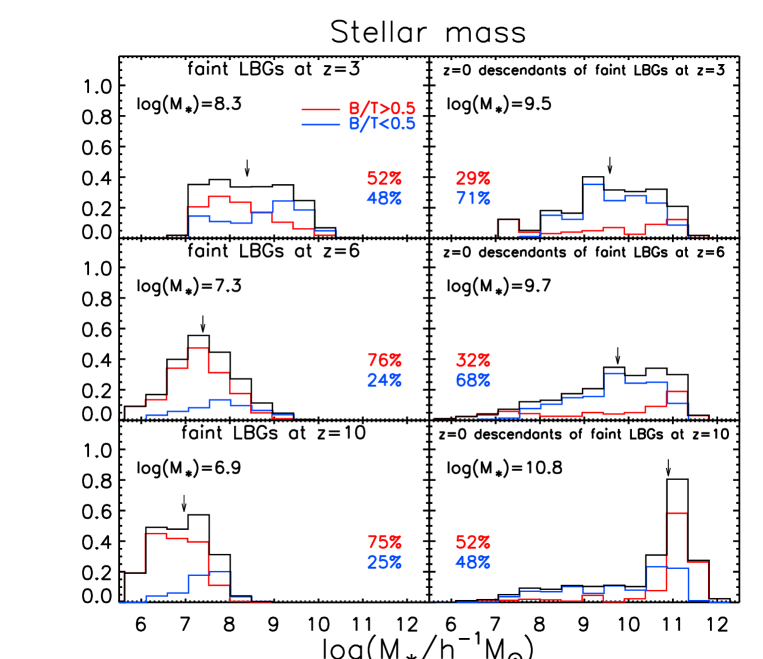
The model predicts that the stellar masses of LBGs identified at a given UV luminosity decrease with increasing redshift. On the other hand, the stellar masses of their present-day descendants show the opposite trend, increasing with increasing redshift. This behaviour is seen for both bright and faint LBGs, as we now discuss in detail.
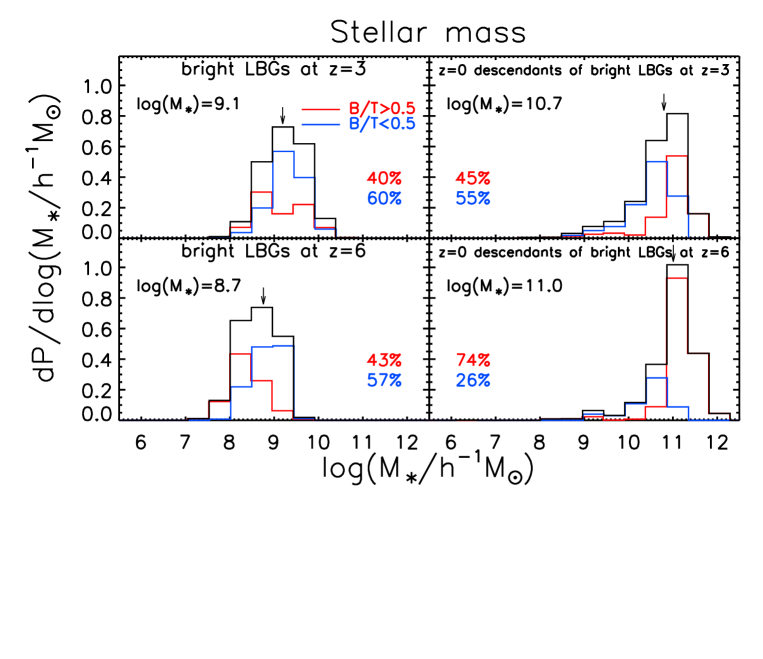
We plot the stellar mass distributions of LBGs and of their present-day descendants in the left and right panels of Fig. 6. The top panels show results for bright LBGs () at and , while the lower panels show results for faint LBGs () at , and .
We see that the median stellar mass of bright LBGs at is , which is 6 times larger than that of their faint counterparts at this redshift, and times larger than the median mass of bright LBGs at . The median stellar mass of the descendants (right panels) of these two LBG populations ( and ) are predicted to be for the bright LBGs at and for the bright LBGs at . We separate the galaxies into bulge-dominated (if the bulge to total stellar mass ratio ) and disk-dominated galaxies (i.e. ). Bright LBGs at and are predicted to be typically (60%) disk-dominated. However, while the descendants of bright LBGs at are also mainly disk-dominated, descendants of bright LBGs at are mainly bulge-dominated.
The median stellar mass of faint LBGs at is , which is an order of magnitude larger than the median mass of faint LBGs at . Faint LBGs at are 25 times less massive than faint LBGs at . The median stellar masses of the descendants of the and populations are predicted to be similar (). The median descendant mass of a faint LBG is an order of magnitude larger than for faint LBGs identified at or . The descendants of LBGs show a broader distribution of stellar mass compared with the LBGs themselves. We also find that faint LBGs at and are predominantly bulge-dominated systems (75% are predicted to have ). At there is a more balanced population, with almost half of the faint LBGs predicted to be disk-dominated systems. The descendants of faint LBGs identified at and have similar morphological mixes. They are predicted to be mainly disk-dominated systems (with 70% having ). The descandants of faint LBGs are equally likely to be disk or bulge dominated. Among the descendants, those of lower mass () are typically predicted to be disk-dominated systems, whereas higher mass LBG descendants () are mostly bulge-dominated systems in the model.
Stellar masses of LBGs have been estimated photometrically in a number of observational studies (e.g Papovich et al., 2001; Shapley et al., 2001; Verma et al., 2007; Stark et al., 2009). These are all based on fitting model SEDs to multicolour photometry. As discussed in Lacey et al. (2011), these photometric mass estimates are fraught with difficulty, since they depend sensitively on the assumed IMF, and also on assumptions about dust extinction, star formation history and metallicity. Since our model galaxies contain a mixture of stars formed with quiescent and burst IMFs, while the observational estimates all assume a solar neighbourhood (typically Salpeter) IMF, a direct comparison between stellar masses predicted by the model and values estimated observationally from photometric data from is not meaningful. Instead, Lacey et al. made a direct photometric comparison between the models and observations. They plot the observer-frame flux at against rest-frame far-UV flux, and find, using the same model as we do here, that the predictions come to within a factor of 3 of matching the observed relation found by Stark et al. (2009) for LBGs at . At the redshifts of the LBG samples, the flux probes the optical rest-frame, which is determined by the recent star formation history of a galaxy as well as its stellar mass. We will investigate this issue in more detail in a future paper.
4.2 Host halo masses
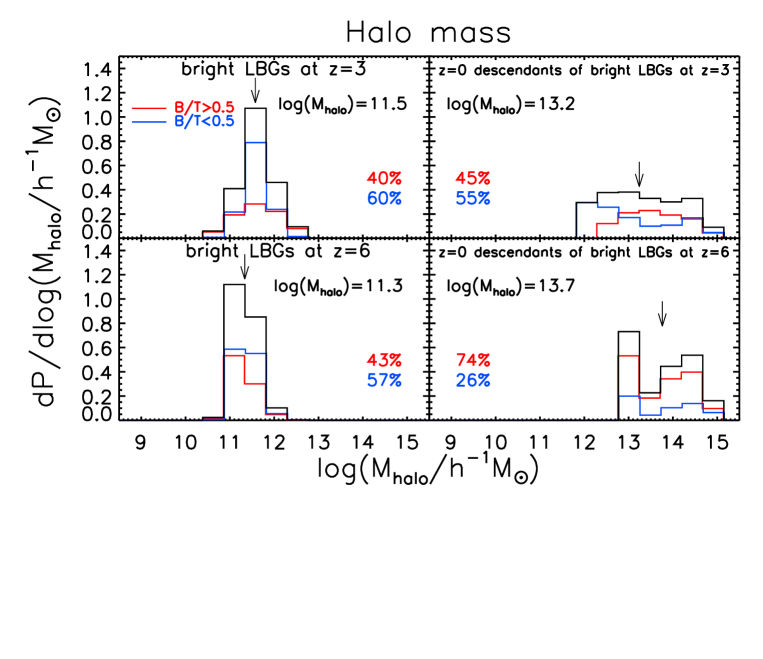
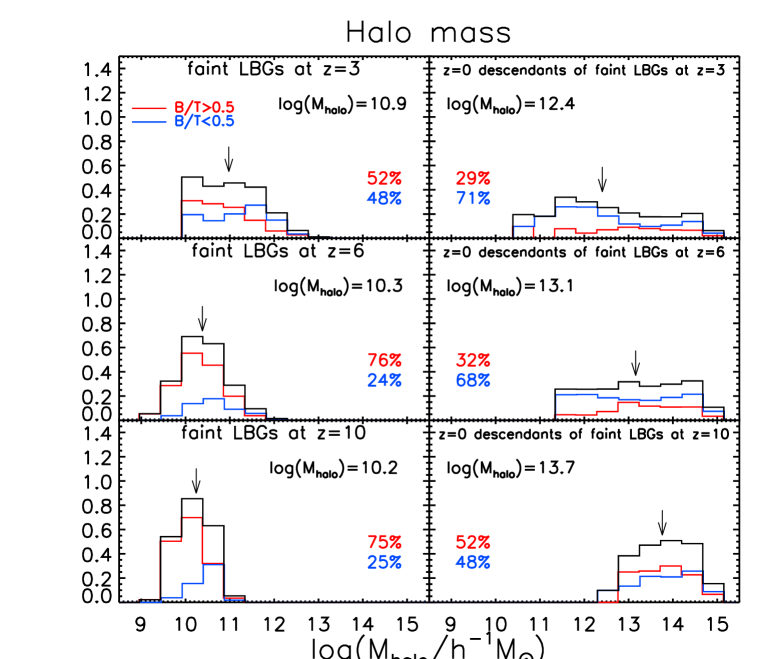
The model predicts that the host halo masses of LBGs and of their present-day descendants show trends with LBG redshift in the same sense as for the stellar masses, i.e. host halo masses for LBGs of a given UV luminosity decrease with increasing redshift, while the host halo masses of their descendants present-day increase. We now discuss this in detail for bright and faint LBGs.
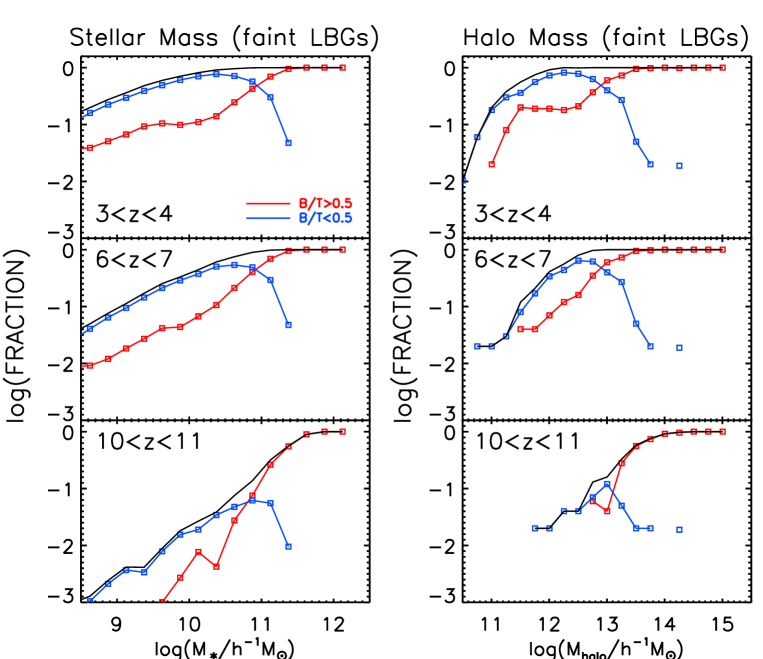
We plot the predicted distributions of host halos masses of LBGs and of their present-day descendants in the left and right panels of Fig. 7. The upper panels show results for bright LBGs at and , while the lower panels show results for faint LBGs at , and .
We see that bright LBGs at live in halos with a median mass of , while bright LBGs at reside in halos with a median mass of . The descendants of bright LBGs identified at are hosted by halos with a median mass of , and the descendants of bright LBGs are hosted by halos with a median mass of .
Faint LBGs at live in halos with a median mass of , which is 4 times larger than the halos which host faint LBGs at . The distribution of host halo mass for faint LBGs at is similar to that at . The descendants of faint LBGs are hosted by halos with a median mass of , and the descendants of faint LBGs are hosted by halos with a median mass of . Halos which host the descendants of faint LBGs have a broader distribution in mass than halos which host the progenitors of bright LBGs.
The host halo masses of LBGs can be observationally constrained through measurements of their clustering. Lacey et al. (2011) show predictions for the linear clustering bias of LBGs as a function of luminosity and redshift for the same model as used here. For bright LBGs, they find at , increasing to at . As they discuss, these predictions seem broadly consistent with observational estimates of the clustering bias by Adelberger et al. (1998) and Ouchi et al. (2004).
Earlier calculations with a different semi-analytical model suggested that LBGs reside in more massive haloes () at (Baugh et al., 1998; Governato et al., 1998). However, this earlier model had several important differences from the Baugh et al. (2005) model used in the present paper. It did not include the effect of dust extinction on the UV luminosity of the model galaxies, it invoked a much stronger supernova feedback in low circular velocity haloes, it had much less star formation in merger-driven starbursts at high redshift, and it did not assume a top-heavy IMF in bursts. The last three of these differences mean that in the Baugh et al. (2005) model, objects can be bright in the UV (and thus be classified as LBGs) while having lower masses than in the Baugh et al. (1998) model.
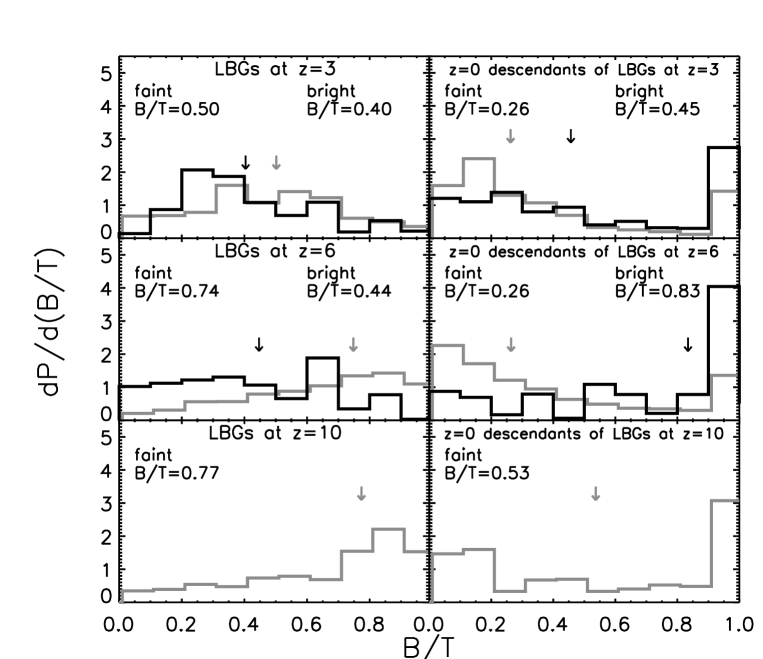
4.3 Morphology
In §4.1 we showed that the model predicts a mixture of morphological types (as defined using the bulge to total stellar mass ratio, ) for LBGs and their descendants. Fig. 8 shows the distribution of bulge-to-total stellar mass ratio () for bright and faint LBGs at , and , and for their present-day descendants. We see that faint LBGs are typically more bulge-dominated in stellar mass than bright LBGs at the same redshift. However, for their descendants, this trend is reversed, with the descendants of bright LBGs being more bulge-dominated. There is also a tendency for LBGs at a given luminosity (whether bright or faint) to become more bulge-dominated with increasing redshift, and the same trend is also seen for their present-day descendants.
The observed morphologies of LBGs have mostly been studied by imaging in their rest-frame UV light. Lacey et al. (2011) present predictions for the ratios of LBGs as seen in rest-frame UV luminosity for the same model as used here, and compare with the observational studies by Ravindranath et al. (2006) and Lotz et al. (2006). These studies find that for bright LBGs at , are bulge-like, are major mergers, and are disk-like or minor mergers. Lacey et al. conclude that the model predictions are qualitatively consistent with these observational results.
4.4 Mode of star formation in LBGs


As discussed in Section 2, the model assumes two modes of star formation, quiescent star formation in disks and star formation in bursts triggered by galaxy mergers. Quiescent star formation produces stars with a standard solar neighbourhood IMF, whereas in burst star formation, a top heavy IMF is adopted. This difference in the choice of IMF between the two modes of star formation has an impact on the abundance and properties of LBGs. In this section we study correlations between the star formation rate, stellar mass, halo mass and UV luminosity of galaxies at , and . Our goal is to understand the role of the different star formation channels in the production of LBGs and in determining their nature.
In Fig. 9, we plot all galaxies with stellar masses at and , showing the relations between stellar mass (plotted on the -axis) and various properties on the -axis: host halo mass (left panel), star formation rate (middle panel) and far-UV (1500Å) luminosity in units of (right panel). (We choose a lower mass limit of because the masses of faint LBGs at extend down to roughly this mass.) The shading in Fig. 9 reflects the square root of the space density of galaxies, becoming darker where more galaxies are found. We gain further insight by dividing the galaxies according to which mechanism of star formation is dominant (but without the factor 4 used earlier in §3.3) and whether the galaxies are central or satellites in their host dark halo. Contours of a given colour enclose 95% of the galaxies passing one of these selection criteria. The red contours delimit the region occupied by 95% of the galaxies in which starbursts are the dominant mode of star formation and blue contours enclose the quiescent population. Similarly, orange contours show where the majority of central galaxies lie and green contours show where the satellite galaxies fall.
Fig. 9 shows that there is a correlation between galaxy stellar mass and host halo mass which is driven by central galaxies. Satellite galaxies in the model, which are mostly quiescent, are responsible for the large scatter in this relation (as suggested by the green contour). There is also a correlation between stellar mass and star formation rate. In this case the correlation is largely due to galaxies where quiescent star formation dominates (as suggested by the blue contours), with the scatter produced mainly by galaxies which are undergoing bursts of star formation (see also Lagos et al. 2010).
In Fig. 10 we plot similar correlations, but in this case for faint LBGs () only. Again, we differentiate between galaxies according to the dominant mode of star formation, and make this distinction for the faint and bright LBG samples. Fig. 10 shows that most LBGs are produced by bursts of star formation, as discussed earlier in §3.3, and also by Lacey et al. (2011). We again see that the fraction of LBGs dominated by burst star formation increases with redshift. The correlations of halo mass and SFR with stellar mass are seen to be better defined, with less scatter, for LBGs than for samples containing all galaxies. However, the correlation of SFR with stellar mass is also seen to be different (shifted to higher SFRs) for LBGs from that for all galaxies. This is because the LBG samples are dominated by bursts, which have larger SFRs than quiescent galaxies of the same stellar mass.
We have also investigated what fraction of the stellar mass of model LBGs has formed quiescently or in bursts (allowing for the recycling of mass from dying stars). We find that LBGs at typically formed most of their stellar mass by quiescent star formation, with 57% of faint LBGs and 73% of bright LBGs having formed more than half of their stellar mass quiescently. However, at higher redshifts, the reverse is true: at , 93% of faint LBGs and 89% of bright LBGs have built at least half their stellar mass through bursts of star formation after merging with other galaxies, while at , 99% of faint LBGs have built at least half their stellar mass through bursts. (See also the discussion in Lacey et al. 2011.)
5 What is the connection between LBGs and SMGs?


Samples of galaxies at high redshift have been assembled using the Lyman-break technique and through their emission at sub-millimetre wavelengths. LBGs are selected on the basis of their emission in the rest-frame far-UV. SMGs are detected through their rest-frame far-IR/sub-mm emission, which is produced by the reradiation by dust of light absorbed predominantly in the UV. It is natural to ask what is the overlap, if any, between these two populations at high redshift. A first indication of the answer is suggested by the different redshift ranges of the populations. LBGs selected using ground-based surveys are restricted to have . Bright SMGs (with m flux ), on the other hand, have a median redshift of in flux-limited samples. Hence, to study the overlap between the two samples we will be looking at the UV luminosities of galaxies in the high redshift tail of the SMG redshift distribution. Almeida et al. (2010) performed a similar comparison at , and found that of galaxies bright in the UV were predicted to also be bright SMGs.
The multiwavelength nature of our semi-analytical model and its self-consistent treatment of dust make it ideally placed to address the overlap between the SMG and LBG populations. Here we examine the predicted relation between flux and UV luminosity at and . Following the companion to this paper (González et al., 2011), in which we study the evolution of SMGs in the model, we define a galaxy as a bright SMG when its m flux exceeds 5 mJy and as a faint SMG when its m flux exceeds 1 mJy.
The top panels of Fig. 11 show the relation between the flux and the UV luminosity for galaxies at and , respectively. There is scatter in this relation, particularly at fainter magnitudes. Nevertheless an increase in the UV luminosity typically corresponds to an increase in the submillimetre flux.
The middle panels of Fig. 11 show the number density of galaxies as a function of their flux, with separate curves for faint and bright LBGs at and , respectively. At both redshifts, the median fluxes at m are predicted to be mJy for bright LBGs, equal to the faint SMG flux limit adopted here, but well below it (mJy) for faint LBGs. We find that only 1.4% of the bright LBGs () at are also bright SMGs (). This figure decreases to 0.1% for .
In the bottom panels of Fig. 11, we show the predicted number density of galaxies as a function of UV absolute magnitude at and respectively, distinguishing between faint and bright SMGs. At , the median UV magnitude is quite similar for faint and bright SMGs (). At the median UV absolute magnitude for the faint SMGs is predicted to be very similar to its value at . Our model predicts too few bright SMGs at for us to reliably calculate the median UV absolute magnitude (as suggested by the redshift distributions plotted in Baugh et al. 2005). At , nearly half (42%) of the bright SMGs are predicted to also be bright LBGs.
The model predicts that LBGs at should be extremely faint at , with faint LBGs having median fluxes of only 0.03 mJy. We predict a negligible number of bright or faint SMGs at .
6 Summary
We have investigated the nature, formation histories and present-day descendants of Lyman-break galaxies (LBGs) in the CDM cosmology that are predicted by the Baugh et al. (2005) version of the GALFORM semi-analytical galaxy formation model. The Baugh et al. model incorporates a top-heavy IMF in starbursts triggered by galaxy mergers, which was found to be necessary to explain the number counts and redshift distribution of sub-mm galaxies. This model has previously been shown to match the observed far-UV luminosity function of LBGs over the whole range (Lacey et al., 2011). In this paper we investigate a range of other predictions for Lyman-break galaxies from the same galaxy formation model.
We began by investigating the formation histories of LBGs. We found that the majority of LBGs are predicted to be starbursts triggered by minor mergers of galaxies. Using the observed characteristic far-UV luminosity at , , to define samples of model galaxies as bright () or faint () LBGs, we found that of bright LBGs at are predicted to be starbursts triggered by minor or major mergers, while this fraction is somewhat lower for faint LBGs (but still for ). The importance of starbursts in producing galaxies visible as LBGs is because the far-UV light is dominated by young stars, and in starbursts the star formation rate is increased over the quiescent value. However, in our model there is also second important effect, that the top-heavy IMF in bursts (as against a solar neighbourhood IMF assumed for quiescent star formation) further enhances their far-UV luminosities over quiescent galaxies. We then examined the duration of the LBG phase in model galaxies, and found that this is quite short, around 20 Myr for bright LBGs, and somewhat longer, around Myr, for faint LBGs. The short timescales are a result of the LBGs mainly being starbursts.
We then computed the fraction of present-day galaxies that are predicted to have LBG progenitors. We find that 95% of Milky Way mass galaxies had at least one faint LBG progenitor in the redshift range , and 70% at , but this falls to 7% for . For bright LBG progenitors these fractions drop to 40% for LBGs at and only 3% at . Performing a similar analysis for dark matter halos, we find that 50% of present-day halos with masses exceeding or had progenitor halos hosting bright LBGs at or respectively.
We next examined the stellar and halo masses of LBGs, together with their morphologies. The model predicts that bright LBGs at have median stellar mass , falling to at , and are typically disk-dominated in stellar mass, consistent with their origin in starbursts triggered by minor galaxy mergers. As already noted by Lacey et al. (2011), these stellar masses are lower than the values typically inferred from observational data by fitting stellar population models to broad-band photometry, but the observational estimates rely on assuming a solar neighbourhood IMF, while in our model the light from LBGs is dominated by stars formed with a top-heavy IMF during a starburst. The faint LBGs are predicted to have stellar masses roughly an order of magnitude lower than bright LBGs at the same redshift, falling to only at , and to be more bulge-dominated than the bright LBGs, especially at the higher redshifts. The halos hosting bright LBGs at and are predicted to have median masses , with roughly 10 times lower masses for faint LBGs at the same redshifts.
Following on from this, we then investigated the stellar and halo masses and morphologies of the present-day descendants of LBGs. The ability to relate different types of high-redshift galaxies to their descendants is one of the unique capabilities of theoretical models of galaxy formation such as ours. We find that the descendants of bright LBGs at have median stellar masses (i.e. comparable to the Milky Way), and consist of roughly equal numbers of disk- and bulge-dominated systems. They typically inhabit galaxy groups, with halo masses . Bright LBGs at have descendants which are somewhat more massive () and inhabit somewhat more massive halos, but are significantly more bulge-dominated () on average. Faint LBGs are predicted to have present-day descendants which are an order of magnitude lower in stellar and halo mass than the bright LBGs at the same redshift, and contain a larger proportion of disk-dominated systems.
We next looked at the relationship between halo mass, stellar mass, star formation rate (SFR) and far-UV luminosity in the model, for all galaxies and for LBGs. We find that LBGs have a tighter relationship between halo mass and stellar mass than galaxies as a whole, due to them them being mainly central galaxies. We also find a correlation between SFR and stellar mass that is shifted to higher SFRs compared to that for all galaxies. This results from LBGs being mainly starbursts, which have higher SFRs than quiescent galaxies with the same stellar mass. We also find that although most LBGs in the model are starbursts, their stellar masses are not necessarily dominated by stars formed in bursts. This results in part from the large recycled fraction for stars forming with the top-heavy burst IMF. LBGs at (both faint and bright) are predicted to have formed most of their stellar mass quiescently before the current burst. However, this changes with redshift, so that LBGs at have typically formed most of their stellar mass in bursts (although not necessarily the current burst).
Finally we used the multi-wavelength capabilities of our model to examine the overlap between LBGs and sub-mm galaxies (SMGs) detected at m, extending to , 6 and 10 the comparison previously carried out by Almeida et al. (2010) at . Analogously to the LBGs, we define bright and faint SMGs as having m fluxes exceeding 5 mJy and 1 mJy respectively. At we are only probing the tail of the redshift distribution of bright SMGs, which peaks at . We find that only about 1% of bright LBGs at are predicted to be also bright SMGs, and this fraction falls to only 0.1% for bright LBGs at , with the median m flux being about 1 mJy for both redshifts. This explains the difficulty in observationally detecting the sub-mm emission from LBGs (Chapman et al., 2000).
Acknowledgements
JEG acknowledges receipt of a fellowship funded by the European Commission’s Framework Programme 6, through the Marie Curie Early Stage Training project MEST-CT-2005-021074. This work was supported in part by the Science and Technology Facilities Council rolling grant to the ICC, and by the Austrian Science Foundation FWF under grant I164. CSF acknowledges a Royal Society Wolfson Research Grant Award. AJB acknowledges the support of the Gordon and Betty Moore Foundation.
References
- Adelberger et al. (1998) Adelberger K. L., Steidel C. C., Giavalisco M., Dickinson M., Pettini M., Kellogg M., 1998, ApJ, 505, 18
- Almeida et al. (2007) Almeida C., Baugh C. M., Lacey C. G., 2007, MNRAS, 376, 1711
- Almeida et al. (2010) Almeida C., Baugh C. M., Lacey C. G., Frenk C. S., Granato G. L., Silva L., Bressan A., 2010, MNRAS, 402, 544
- Arnouts et al. (2005) Arnouts S., Schiminovich D., Ilbert O., Tresse L., Milliard B., Treyer M., Bardelli S., Budavari et al., 2005, ApJ, 619, L43
- Baugh (2006) Baugh C. M., 2006, Reports on Progress in Physics, 69, 3101
- Baugh et al. (1998) Baugh C. M., Cole S., Frenk C. S., Lacey C. G., 1998, ApJ, 498, 504
- Baugh et al. (2005) Baugh C. M., Lacey C. G., Frenk C. S., Granato G. L., Silva L., Bressan A., Benson A. J., Cole S., 2005, MNRAS, 356, 1191
- Benson (2010) Benson A. J., 2010, Phys. Rep., 495, 33
- Benson et al. (2003) Benson A. J., Bower R. G., Frenk C. S., Lacey C. G., Baugh C. M., Cole S., 2003, ApJ, 599, 38
- Binney & Tremaine (2008) Binney J., Tremaine S., 2008, Galactic Dynamics: Second Edition. Princeton University Press
- Bouwens et al. (2007) Bouwens R. J., Illingworth G. D., Franx M., Ford H., 2007, ApJ, 670, 928
- Bouwens et al. (2011) Bouwens R. J., Illingworth G. D., Labbe I., Oesch P. A., Trenti M., Carollo C. M., van Dokkum P. G., Franx M. et al, 2011, Nature, 469, 504
- Bower et al. (2006) Bower R. G., Benson A. J., Malbon R., Helly J. C., Frenk C. S., Baugh C. M., Cole S., Lacey C. G., 2006, MNRAS, 370, 645
- Chapman et al. (2000) Chapman S. C., Scott D., Steidel C. C., Borys C., Halpern M., Morris S. L., Adelberger K. L., Dickinson M. et al, 2000, MNRAS, 319, 318
- Cole et al. (1994) Cole S., Aragon-Salamanca A., Frenk C. S., Navarro J. F., Zepf S. E., 1994, MNRAS, 271, 781
- Cole et al. (2000) Cole S., Lacey C. G., Baugh C. M., Frenk C. S., 2000, MNRAS, 319, 168
- Font et al. (2008) Font A. S., Bower R. G., McCarthy I. G., Benson A. J., Frenk C. S., Helly J. C., Lacey C. G., Baugh C. M. et al, 2008, MNRAS, 389, 1619
- González et al. (2011) González J. E., Lacey C. G., Baugh C. M., Frenk C. S., 2011, MNRAS, 413, 749
- González et al. (2009) González J. E., Lacey C. G., Baugh C. M., Frenk C. S., Benson A. J., 2009, MNRAS, 397, 1254
- Gonzalez-Perez et al. (2009) Gonzalez-Perez V., Baugh C. M., Lacey C. G., Almeida C., 2009, MNRAS, 398, 497
- Governato et al. (1998) Governato F., Baugh C. M., Frenk C. S., Cole S., Lacey C. G., Quinn T., Stadel J., 1998, Nature, 392, 359
- Harker et al. (2006) Harker G., Cole S., Helly J., Frenk C., Jenkins A., 2006, MNRAS, 367, 1039
- Kennicutt (1983) Kennicutt Jr. R. C., 1983, ApJ, 272, 54
- Kim et al. (2009) Kim H., Baugh C. M., Cole S., Frenk C. S., Benson A. J., 2009, MNRAS, 400, 1527
- Lacey et al. (2011) Lacey C. G., Baugh C. M., Frenk C. S., Benson A. J., 2011, MNRAS, 412, 1828
- Lacey et al. (2010) Lacey C. G., Baugh C. M., Frenk C. S., Benson A. J., Orsi A., Silva L., Granato G. L., Bressan A., 2010, MNRAS, 443
- Lacey et al. (2008) Lacey C. G., Baugh C. M., Frenk C. S., Silva L., Granato G. L., Bressan A., 2008, MNRAS, 385, 1155
- Lagos et al. (2010) Lagos C. d. P., Lacey C. G., Baugh C. M., Bower R. G., Benson A. J., 2010, ArXiv e-prints
- Lilly et al. (1996) Lilly S. J., Le Fevre O., Hammer F., Crampton D., 1996, ApJ, 460, L1
- Lotz et al. (2006) Lotz J. M., Madau P., Giavalisco M., Primack J., Ferguson H. C., 2006, ApJ, 636, 592
- Madau et al. (1996) Madau P., Ferguson H. C., Dickinson M. E., Giavalisco M., Steidel C. C., Fruchter A., 1996, MNRAS, 283, 1388
- Ouchi et al. (2004) Ouchi M., Shimasaku K., Okamura S., Furusawa H., Kashikawa N., Ota K., Doi M., Hamabe et al., 2004, ApJ, 611, 685
- Papovich et al. (2001) Papovich C., Dickinson M., Ferguson H. C., 2001, ApJ, 559, 620
- Parkinson et al. (2008) Parkinson H., Cole S., Helly J., 2008, MNRAS, 383, 557
- Ravindranath et al. (2006) Ravindranath S., Giavalisco M., Ferguson H. C., Conselice C., Katz N., Weinberg M., Lotz J., Dickinson et al., 2006, ApJ, 652, 963
- Reddy & Steidel (2009) Reddy N. A., Steidel C. C., 2009, ApJ, 692, 778
- Shapley et al. (2001) Shapley A. E., Steidel C. C., Adelberger K. L., Dickinson M., Giavalisco M., Pettini M., 2001, ApJ, 562, 95
- Somerville et al. (2001) Somerville R. S., Primack J. R., Faber S. M., 2001, MNRAS, 320, 504
- Springel & Hernquist (2003) Springel V., Hernquist L., 2003, MNRAS, 339, 312
- Springel et al. (2005) Springel V., White S. D. M., Jenkins A., Frenk C. S., Yoshida N., Gao L., Navarro J., Thacker R. et al, 2005, Nature, 435, 629
- Stark et al. (2009) Stark D. P., Ellis R. S., Bunker A., Bundy K., Targett T., Benson A., Lacy M., 2009, ApJ, 697, 1493
- Steidel et al. (1999) Steidel C. C., Adelberger K. L., Giavalisco M., Dickinson M., Pettini M., 1999, ApJ, 519, 1
- Steidel et al. (2003) Steidel C. C., Adelberger K. L., Shapley A. E., Pettini M., Dickinson M., Giavalisco M., 2003, ApJ, 592, 728
- Steidel et al. (1996) Steidel C. C., Giavalisco M., Pettini M., Dickinson M., Adelberger K. L., 1996, ApJ, 462, L17
- Steidel & Hamilton (1992) Steidel C. C., Hamilton D., 1992, AJ, 104, 941
- Verma et al. (2007) Verma A., Lehnert M. D., Förster Schreiber N. M., Bremer M. N., Douglas L., 2007, MNRAS, 377, 1024
- White & Rees (1978) White S. D. M., Rees M. J., 1978, MNRAS, 183, 341