Control of ferroelectric polarization via uniaxial pressure
in the spin-lattice-coupled multiferroic CuFe1-xGaxO2
Abstract
We have demonstrated that ferroelectric polarization in a spin-driven multiferroic CuFe1-xGaxO2 with can be controlled by the application of uniaxial pressure. Our neutron diffraction and in-situ ferroelectric polarization measurements have revealed that the pressure dependence of the ferroelectric polarization is explained by repopulation of three types of magnetic domains originating from the trigonal symmetry of the crystal. We conclude that the spin-driven anisotropic lattice distortion and the fixed relationship between the directions of the magnetic modulation wave vector and the ferroelectric polarization are the keys to this spin-mediated piezoelectric effect.
pacs:
75.85.+t, 75.25.-jMagnetic frustration induces a variety of cross-correlated phenomena in condensed matter. For example, frustrated magnets often exhibit anisotropic lattice distortion associated with magnetic order, in order to lift the degeneracy due to competing magnetic interactionsYamashita and Ueda (2000); Penc et al. (2004). In other words, spin and lattice degrees of freedom are tightly coupled with each other in frustrated magnets. Another example is spin-driven ferroelectricity. Frustrated magnets often display complex noncollinear magnetic orderings, some of which break the inversion symmetry of a system. Recent studies on magneto-electric (ME) multiferroics have revealed that magnetic inversion symmetry breaking accounts for the ferroelectricityKimura et al. (2003); Katsura et al. (2005); Kenzelmann et al. (2005). Based on the relationships among the spin, lattice and dielectric degrees of freedom in frustrated magnets, we have demonstrated that spin-driven ferroelectric polarization is controlled by pressure, which directly affects the lattice degree of freedom, in the spin-lattice-coupled ME multiferroic CuFe1-xGaxO2 (CFGO) with .
The delafossite compound CuFeO2 (CFO) is a triangular lattice antiferromaget, which is a typical example of frustrated spin system. Because of antiferromagnetic interactions between the magnetic Fe3+ ions forming the triangular lattice, this system has strong magnetic frustration and it therefore exhibits a variety of unconventional magnetic phase transitionsMitsuda et al. (1991, 2000). Despite the Heisenberg spin character expected from the electronic state of the magnetic Fe3+ ions (), CFO exhibits an Ising-like collinear four-sublattice (4SL) magnetic ground state. A small amount of nonmagnetic substitution or the application of a magnetic field turns the 4SL phase to a noncollinear incommensurate magnetic phase, in which spin-driven ferroelectricity has been discoveredKimura et al. (2006); Seki et al. (2007); Terada et al. (2008). Hereafter, we refer to this ferroelectric phase as the ‘ferroelectric incommensurate magnetic (FE-ICM) phase’. The magnetic structure of the FE-ICM phase has been determined to be an elliptic screw-type magnetic structure, whose magnetic modulation wave vector is with Nakajima et al. (2007, 2009). Spin-driven ferroelectric polarization emerges along the screw axis, which is parallel to the [110] direction of the crystal. The polarity of the ferroelectric polarization is coupled with the chirality of the magnetic structure, i.e., the left-handed (LH) and right-handed (RH) helical arrangements of the spinsNakajima et al. (2008a); Nakajima et al. (2009).
CFO also exhibits spin-driven crystal structural transitions. Recent synchrotron radiation x-ray diffraction studies have revealed that CFO exhibits monoclinic lattice distortions in several magnetically ordered phases including the FE-ICM phaseTerada et al. (2006a); Ye et al. (2006); Terada et al. (2006b); Nakajima et al. (2008b), while CFO has a trigonal crystal structure in the paramagnetic (PM) phase. This spin-driven structural transition produces three types of monoclinic crystal domains because the original trigonal crystal structure has a threefold rotational symmetry about the axis. The relationships between the hexagonal and the monoclinic bases in each domain are shown in Figs. 1(a)-1(c). Note that in this letter, we have mainly employed the hexagonal basis to describe the three types of domains. We have added subscripts “m” when referring to the monoclinic bases. In each monoclinic domain, the axis elongates and, in contrast, the axis contracts, compared to those in the PM phase. In addition, the -plane-projection of the magnetic modulation wave vector, which is parallel to the screw axis in the FE-ICM phase, is fixed to be parallel to the axis. Hereafter, we refer to the three types of coupled magnetic and crystal domains as -, - and -domains, as shown in Figs. 1(a)-1(c). Taking account of the strong spin-lattice coupling in this system, we have recently demonstrated that in CFO, the volume fractions of the three magnetic domains can be controlled by uniaxial pressure applied perpendicular to the axisNakajima et al. (2011). We thus expect that in the FE-ICM phase, application of uniaxial pressure results in distinct changes in the ferroelectric polarization reflecting the changes in the volume fractions of the three magnetic domains. In the present study, we have performed neutron diffraction and in-situ ferroelectric polarization measurements under applied uniaxial pressure, using a CFGO () sample, which exhibits the FE-ICM phase below 8 K in zero magnetic field.
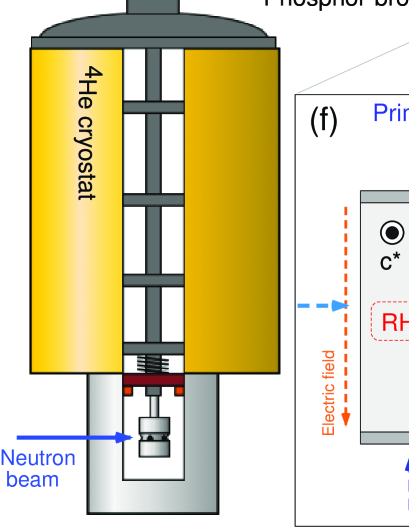
A single crystal of CFGO() of nominal composition was prepared by the floating zone methodZhao et al. (1996) and was cut to dimensions of mm3 with the direction parallel to the shortest dimension. We have developed a uniaxial pressure cell loaded into a pumped 4He cryostat, as illustrated in Fig. 1(d). The uniaxial pressure along the vertical direction is controlled by a SiCr coil spring and a micrometer attached on top of the cryostat and is monitored by a load meter. The sample was mounted in the pressure cell with the scattering plane orientated so that the vertical uniaxial pressure was applied to the surfaces of the sample. Uniaxial pressure was also applied to the [110] surfaces by a small phosphor-bronze clip. Hereafter, we refer to the vertical pressure applied by the spring and the horizontal pressure applied by the clip as ‘primary pressure’ () and ‘secondary pressure’ (), respectively. In this experimental setup, we can control the magnitude of even at low temperatures. On the other hand, we cannot control , which was kept applied throughout the present experiment. The magnitude of is assumed to be relatively small. Silver paste electrodes were applied to the surfaces of the sample. The ferroelectric polarization along the direction () was deduced by integrating the pyroelectric or piezoelectric current measured by an electrometer. Neutron diffraction measurements under an applied uniaxial pressure were carried out with a triple axis spectrometer HQR installed in JRR-3 of the Japan Atomic Energy Agency in Tokai, Japan. The wavelength of the incident neutron beam was 2.44 Å, and the collimation was open-40’-40’-40’.
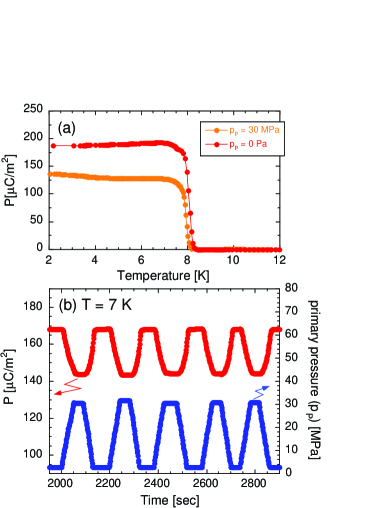
Figure 2(a) shows the temperature variations of measured on heating at 0 and 30 MPa. We have found that the application of only 30 MPa of significantly reduces the value of . At 7 K, just below the ferroelectric transition temperature, we have measured the -dependence of in zero electric fieldcom (a). Before this measurement, the sample was cooled with an applied electric field of 116 kV/m from 10 K to 2 K, and then was heated to 7 K in zero electric field. In Fig. 2(b), we show the values of and as functions of timecom (b), revealing that the time dependence of is synchronized with that of : gradually decreases and increases with increasing and decreasing , respectively.
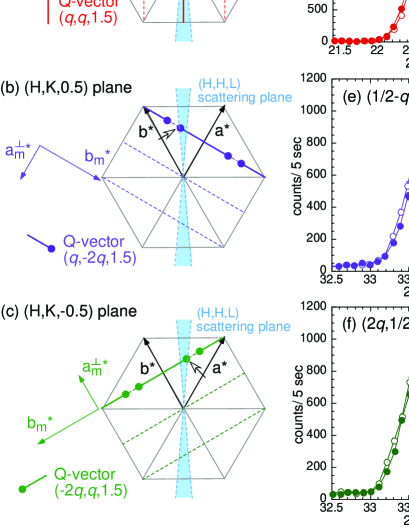
Subsequent to the ferroelectric polarization measurement, we have performed neutron diffraction measurements. We have measured three magnetic Bragg reflections at (), and , which belong to the (110)-, - and -domains, respectively. In Figs. 3(d)-3(f), we show the comparisons between the magnetic diffraction profiles measured at and MPa. We have found that the intensity of the () reflection is enhanced by the application of . In contrast, those of the and reflections are reduced. This suggests that the volume fraction of the (110)-domain increases and those of the - and -domains decrease with increasing . Since the ferroelectric polarization vector in the (110)-domain is parallel to the electrodes, the observed value of is proportional to the sum of the volume fractions of the - and -domains. Therefore, the dependences of the intensities of the magnetic Bragg reflections are consistent with the results of the ferroelectric polarization measurements.
Hereafter, we refer to the volume fractions of the (110)-, - and -domains as , and , respectively. The sum of the volume fractions relevant to is described by
| (1) |
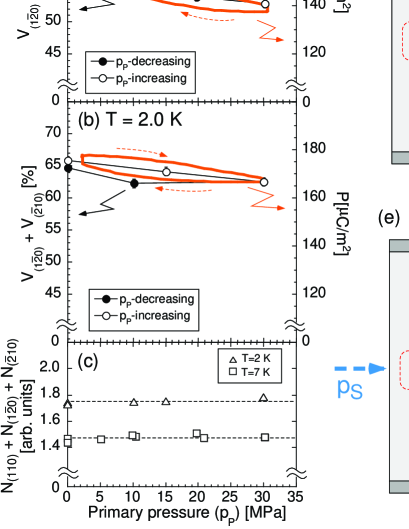
where [ or ] is the integrated intensity of the magnetic Bragg reflection belonging to the -domain divided by the Lorentz factor and the square of the calculated magnetic structure factor for the magnetic reflection. It should be noted that the sum of , and is independent of , as shown in Fig. 4(c). This suggests that the application of 30 MPa of does not affect the magnetic structure in the FE-ICM phase, and therefore the changes in the intensities of the magnetic Bragg reflections can be ascribed only to the changes in the volume fractions of the three domains. Figures 4(a) and 4(b) show the values of and at 7 K and 2 K as functions of .com (c) We have found that the -variations of agree with those of at both temperatures. This indicates that the changes in are explained by the pressure-induced repopulation of the three magnetic domains. Specifically, the uniaxial pressure along the direction favors the domains whose axis lies along the direction of the pressure, and suppresses the other domains, because of the anisotropic lattice distortion in each domain. Hence, and decrease with increasing , as illustrated in Fig. 4(d). When is removed and the effect of is dominant, suppresses the magnetic domains whose axis are parallel to and enhances the other domains, and therefore and increase with decreasing , as illustrated in Fig. 4(e). It should be noted that and might not be retrieved without the application of .
We now discuss the microscopic picture of the domain structures in this system. The fact that the -variations of are proportional to those of indicates that the asymmetry of the LH- and the RH-helical magnetic orderings in each of the or -domains remain unchanged even after the volume fractions of the three domains change. This implies that the domain walls separating the three types of crystal domains gradually move with increasing or decreasing pressure, keeping the asymmetry of the LH- and the RH-helical magnetic orderings in each of the domains. In other words, sudden flops or reconstruction of the crystal domains, in which the magnetic chirality might be no longer conserved, hardly occur in the present experiments. The present results also suggest that mobility of the domain walls are reduced at low temperatures.
In conclusion, we have demonstrated uniaxial pressure control of ferroelectric polarization in a frustrated magnet CuFe1-xGaxO2 with , in which the spin, lattice and dielectric degrees of freedom are tightly coupled with each other. The present neutron diffraction and in-situ ferroelectric polarization measurements have revealed that the application of uniaxial pressure along the direction results in repopulation of the three types of coupled crystal and magnetic domains owing to the spin-driven anisotropic lattice distortions in each domain. Consequently, the ferroelectric polarization along the direction changes with the applied pressure, reflecting the domain structure in the sample. Although the present work has focused only on the pressure dependence of the domain structure, we expect that spin-frustrated magnets have the potential to show a variety of pressure-induced cross correlated phenomena including this kind of spin-mediated piezoelectric effect.
ACKNOWLEDGMENTS
The neutron diffraction measurements at JRR-3 were carried out as part of proposal 10695B and were partly supported by ISSP of the University of Tokyo.
References
- Yamashita and Ueda (2000) Y. Yamashita and K. Ueda, Phys. Rev. Lett. 85, 4960 (2000).
- Penc et al. (2004) K. Penc, N. Shannon, and H. Shiba, Phys. Rev. Lett. 93, 197203 (2004).
- Kimura et al. (2003) T. Kimura, T. Goto, H. Shintani, K. Ishizaka, T. Arima, and Y. Tokura, Nature (London) 426, 55 (2003).
- Katsura et al. (2005) H. Katsura, N. Nagaosa, and A. V. Balatsky, Phys. Rev. Lett. 95, 057205 (2005).
- Kenzelmann et al. (2005) M. Kenzelmann, A. B. Harris, S. Jonas, C. Broholm, J. Schefer, S. B. Kim, C. L. Zhang, S.-W. Cheong, O. P. Vajk, and J. W. Lynn, Phys. Rev. Lett. 95, 087206 (2005).
- Mitsuda et al. (1991) S. Mitsuda, H. Yoshizawa, N. Yaguchi, and M. Mekata, J. Phys. Soc. Jpn. 60, 1885 (1991).
- Mitsuda et al. (2000) S. Mitsuda, M. Mase, K. Prokes, H. Kitazawa, and H. A. Katori, J. Phys. Soc. Jpn. 69, 3513 (2000).
- Kimura et al. (2006) T. Kimura, J. C. Lashley, and A. P. Ramirez, Phys. Rev. B 73, 220401(R) (2006).
- Seki et al. (2007) S. Seki, Y. Yamasaki, Y. Shiomi, S. Iguchi, Y. Onose, and Y. Tokura, Phys. Rev. B 75, 100403(R) (2007).
- Terada et al. (2008) N. Terada, T. Nakajima, S. Mitsuda, H. Kitazawa, K. Kaneko, and N. Metoki, Phys. Rev. B 78, 014101 (2008).
- Nakajima et al. (2007) T. Nakajima, S. Mitsuda, S. Kanetsuki, K. Prokes, A. Podlesnyak, H. Kimura, and Y. Noda, J. Phys. Soc. Jpn. 76, 043709 (2007).
- Nakajima et al. (2009) T. Nakajima, S. Mitsuda, K. Takahashi, M. Yamano, K. Masuda, H. Yamazaki, K. Prokes, K. Kiefer, S. Gerischer, N. Terada, et al., Phys. Rev. B 79, 214423 (2009).
- Nakajima et al. (2008a) T. Nakajima, S. Mitsuda, S. Kanetsuki, K. Tanaka, K. Fujii, N. Terada, M. Soda, M. Matsuura, and K. Hirota, Phys. Rev. B 77, 052401 (2008a).
- Terada et al. (2006a) N. Terada, S. Mitsuda, H. Ohsumi, and K. Tajima, J. Phys. Soc. Jpn. 75, 023602 (2006a).
- Ye et al. (2006) F. Ye, Y. Ren, Q. Huang, J. A. Fernandez-Baca, P. Dai, J. W. Lynn, and T. Kimura, Phs. Rev. B 73, 220404(R) (2006).
- Terada et al. (2006b) N. Terada, Y. Tanaka, Y. Tabata, K. Katsumata, A. Kikkawa, and S. Mitsuda, J. Phys. Soc. Jpn. 75, 113702 (2006b).
- Nakajima et al. (2008b) T. Nakajima, S. Mitsuda, T. Inami, N. Terada, H. Ohsumi, K. Prokes, and A. Podlesnyak, Phys. Rev. B 78, 024106 (2008b).
- Nakajima et al. (2011) T. Nakajima, S. Mitsuda, T. Haku, K. Shibata, K. Yoshitomi, Y. Noda, N. Aso, Y. Uwatoko, and N. Terada, J. Phys. Soc. Jpn. 80, 014714 (2011).
- Zhao et al. (1996) T. R. Zhao, M. Hasegawa, and H. Takei, J. Cryst. Growth 166, 408 (1996).
- com (a) After the piezoelectric and the neutron diffraction measurements shown in Figs. 2(b), 4(a) and 4(b), we have performed pyroelectric measurements with increasing temperature beyond to determine the absolute values of in Figs. 2(b), 4(a) and 4(b).
- com (b) The measurements of Figs. 2(b) and 3 were performed after several pressure cycles at 7 K. After the first pressure cycle, the maximum value of the ferroelectric polarization (at zero pressure) decreased from C/m2 to C/m2, but it didn’t change in the 2nd cycle and later.
- com (c) The -variations of the volume fractions shown in Figs. 4(a) and 4(b) are rather small as compared to those in the previous studyNakajima et al. (2011). This is because the effect of the secondary pressure (not applied in the previous work) conflicts with that of the primary pressure. As a result, the sensitivity to is reduced.