Polarization and photometric observations of the gamma-ray blazar PG 1553+113††thanks: Based on observations collected at the Centro Astronómico Hispano Alemán (CAHA) at Calar Alto, operated jointly by the Max-Planck Institut für Astronomie and the Instituto de Astrofísica de Andalucía (CSIC).
We present the results of an observational photo-polarimetry campaign of the blazar PG 1553+113 at optical wavelengths. The blazar was recently detected at very high energies ( GeV) by the H.E.S.S and MAGIC -ray Cherenkov telescopes.
Our high-temporal resolution data show significant variations in the linear polarization percentage and position angle at inter-night time-scales, while at shorter (intra-night) time-scales both parameters varied less significantly, if at all. Changes in the polarization angle seem to be common in -ray emitting blazars. Simultaneous differential photometry (through the and bands) shows no significant variability in the total optical flux. We provide and magnitudes, along with a finding chart, for a set of field stars suitable for differential photometry.
Key Words.:
BL Lacertae objects: individual: PG 1553+113 – Photometry – Polarization1 Introduction
The active galactic nucleus (AGN) PG 1553$+$113 was first detected in the Palomar-Green survey of UV bright objects (Green et al. 1986). It is classified as a BL Lac object based on its featureless spectrum (Miller & Green 1983) and significant optical variability (Miller et al. 1988). The object has been well studied from radio to VHE -ray ( 100 GeV), including several simultaneous multi-wavelength observation campaigns (see Osterman et al. 2006; Mankuzhiyil et al. 2009).
At radio frequencies between 4.8 GHz and 14.5 GHz, the source was found to be variable on timescales of months (Perlman et al. 2005; Osterman et al. 2006). VLBA observations have shown a jet extending at least 20 pc towards the northeast of the object (Rector et al. 2003).
In the X-ray band, PG 1553113 has been detected at different flux levels by Einstein, ROSAT, ASCA (Donato et al. 2001), BeppoSAX (Donato et al. 2005), RXTE (Osterman et al. 2006), XMM-Newton (Perlman et al. 2005), Swift (Tramacere et al. 2007), and Suzaku (Reimer et al. 2008) satellites. A list containing the flux and spectral parameters from all X-ray observations of the source can be found in Abdo et al. (2010b).
At very high energy (VHE) the object was first detected with the HESS stereoscopic array of imaging atmospheric-Cherenkov telescopes during 2005 (Aharonian et al. 2006). This detection was later confirmed through MAGIC observations in 2005 and 2006 (Albert et al. 2007). Both VHE spectra are unusually soft, although these results should be taken with caution because the errors are large. PG 1553113 was also detected at GeV -ray by the Fermi Gamma-ray Space Telescope (Abdo et al. 2010a).
In this frequency range the source presented one of the hardest spectra among the 106 AGNs listed in Abdo et al. (2009). Combining archival radio, optical, X-ray, and VHE -ray data, these authors modelled its spectral energy distribution and demonstrated that a simple, one-zone synchrotron self-Compton (SSC) model provides a reasonably good fit of the observational results. Unfortunately, the redshift of the source is still unknown. At present no emission or absorption lines have been measured despite several observational campaigns with optical instruments. However, an upper limit of was determined by Aharonian et al. (2006) from the photon spectrum obtained by HESS and later confirmed from MAGIC spectral measurements (Albert et al. 2007).
In this paper, we report optical polarimetric observations of the -ray blazar PG 1553113. Our high-temporal resolution data show significant variations in the position angle at intra-night as well as at inter-night time-scales. Simultaneous differential photometry (at the and bands) shows no significant variability in the total optical flux. We describe the observations and data analysis in Sect. 2. Then, we present the obtained results in Sect. 3, and we discuss the origin of the polarization angle variations and state our conclusions in Sect. 4.
2 Observations and data reduction
We observed PG 1553+113 during six nights in April 2009 with the Calar Alto Faint Object Spectrograph (CAFOS) in imaging polarimetry mode, at the CAHA 2.2 m. telescope, Calar Alto, Spain. The detector was a px blue sensitive SITe CCD, with 24 m pixels (the resulting scale is arcsec px-1). In this mode, CAFOS is equipped with a Wollaston prism plus a rotatable half-wave plate, which produce two orthogonally polarized images –i.e., corresponding to the ordinary (O) and the extraordinary (E) beams– on the focal plane, with an effective beam separation of arcsec. A mask with alternating blind and clear stripes is placed before the detector to avoid image overlapping. Four frames, each with a different position of the half-wave plate (, , , and deg) are needed to obtain the normalised Stokes parameters (, ) for linear polarization (for more details, see Cellone et al. 2007b, and references therein).
We observed through and Johnson-Cousins filters. The images range in exposure time from 150 to 240 s and from to s for the and filters, respectively. Photometric data are obtained by adding up the fluxes of the O and E images. In this way were able to follow simultaneously the polarimetric and the photometric behaviour of the source. Standard stars from Turnshek et al. (1990) were observed to determine the zero point for the polarization angle and the instrumental polarization. The absolute calibration of the photometry was performed by observing several standard stars from Landolt (1992) over a wide range of air masses during photometric nights. For the same purpose, several images of the PG 1553+113 field were taken without the polarizing unit and through the and filters. The images were debiased and flat-fielded in the standard way using the IRAF111IRAF is distributed by the National Optical Astronomy Observatories, which are operated by the Association of Universities for Research in Astronomy, Inc., under cooperative agreement with the National Science Foundation. reduction package. Regrettably, the whole first night and part of the last two nights were cloudy or with poor seeing conditions. We thus present results for the five clear/useful nights from April 21 to April 25, 2009.
Instrumental magnitudes corresponding to the O and E images were obtained by means of aperture photometry using the IRAF task apphot. The same process was performed for nine field stars suitably placed with respect to the mask. We used these field stars to estimate the foreground polarization, while two of them were selected to perform the differential photometry (see Cellone et al. 2007a for prescriptions on the appropriate choice of stars for differential photometry). In all the cases, a arcsec aperture was used.
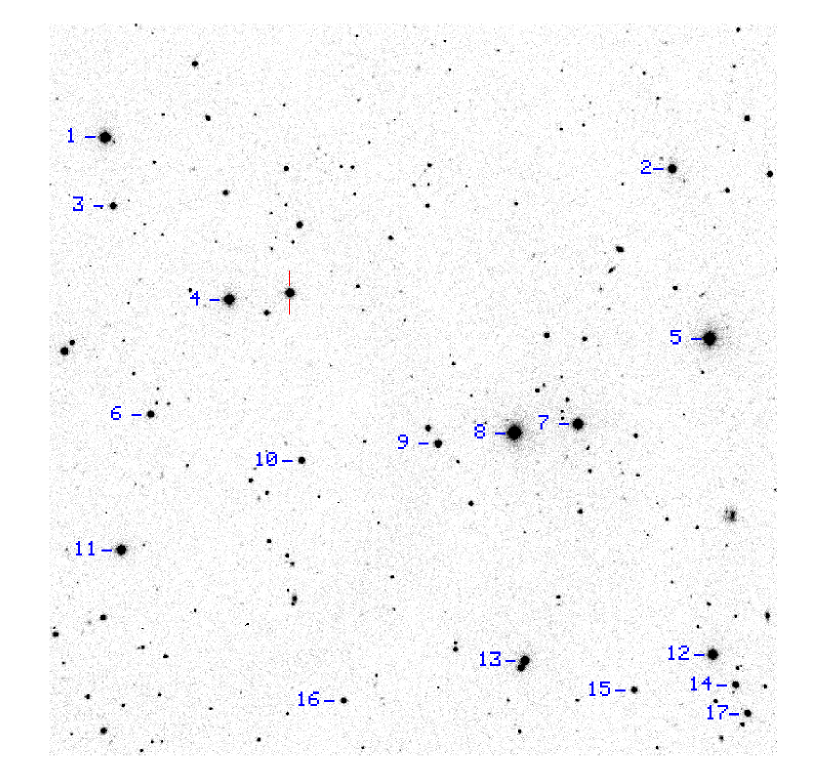
We obtained the linear polarization () and the position angle () through each filter for PG 1553+113 and the field stars along each night. The data were corrected for instrumental polarization using the results for the unpolarized standard stars. The foreground polarization (formally, a lower limit) was estimated from a suitable field star (#9, see Fig. 1), lying at 156 arcsec projected distance from PG 1553+113, resulting in . This value agrees with the low Galactic extinction in the direction to the blazar ( mag. , Schlegel et al. 1998). As a check, we measured the degree of polarization of several other field stars. The mean value in both filters, and , is , which confirms a low foreground polarization. The position angle was transformed to the standard system using the highly polarized standard stars.
3 Results
3.1 Photometry
The differential light-curves were obtained in the usual way, using a non-variable star in the field as comparison, while another (also non-variable) star was used to construct a second differential light-curve against the comparison star, to be used for control purposes. Fig. 1 is a finding chart for non-variable stars 222The stability of these stars was verified with the 2007 data, see below. suitable for differential photometry in the field of PG 1553+113. Their magnitudes in the standard system (Landolt 1992) are given in Table 1. Throughout this study we used stars and as comparison and control, respectively.
| star | ||||
|---|---|---|---|---|
| # | mag | mag | mag | mag |
| 1 | 14.52 | 0.02 | 13.45 | 0.02 |
| 2 | 15.62 | 0.02 | 14.16 | 0.02 |
| 3 | 16.45 | 0.03 | 15.26 | 0.02 |
| 4 | 14.58 | 0.02 | 13.59 | 0.02 |
| 5 | 13.95 | 0.03 | 12.74 | 0.03 |
| 6 | 16.52 | 0.03 | 15.18 | 0.02 |
| 7 | 14.66 | 0.02 | 13.58 | 0.02 |
| 8 | 13.53 | 0.02 | 12.50 | 0.02 |
| 9 | 15.92 | 0.02 | 14.98 | 0.02 |
| 10 | 16.62 | 0.02 | 15.33 | 0.02 |
| 11 | 15.75 | 0.02 | 13.79 | 0.02 |
| 12 | 14.71 | 0.02 | 13.76 | 0.02 |
| 13 | 15.20 | 0.02 | 14.00 | 0.02 |
| 14 | 16.68 | 0.03 | 15.38 | 0.02 |
| 15 | 16.84 | 0.03 | 15.77 | 0.03 |
| 16 | 16.80 | 0.03 | 15.95 | 0.03 |
| 17 | 16.62 | 0.03 | 15.58 | 0.03 |
A statistical analysis of these light-curves reveals that this VHE blazar showed no significant variability in or in . This is true considering each individual night (microvariability) as well as taking the five nights together (inter-night variability). The statistical analysis was performed as in Cellone et al. (2007a) and applying the corrective factor (see Howell et al. 1988), which weights the statistics taking into account the differences in magnitude among the target and the comparison and control stars. The values for were for and for 333 for the ideal case when target and both stars all have the same magnitude..
The dispersions of the curves ranged from to mag, and the mean apparent magnitudes of PG 1553+113 for the whole campaign were mag and mag. Differential photometry data taken with the 2.15-m “Jorge Sahade” telescope, at CASLEO, San Juan, Argentina, during April 2007 seem to point in the same direction: the source was non-variable at optical wavelengths. Because of the mask used for CAHA observations, different comparison and control stars were used for both data sets, but we were able to put all results on the same magnitude scale because they had several field stars in common. Although the blazar’s flux remained steady during each of both periods, the object was about mag fainter in the -band during 2009 compared with 2007. The results on PG 1553+113 from the April 2007 observing run, along with those for other TeV -ray emitting blazars, will be presented elsewhere (Andruchow et al., in preparation).
Both observations were performed after the high-energy detections (Aharonian et al. 2006 and Albert et al. 2007). On the other hand, the observations reported here were almost simultaneous with the final part of the first days of the Fermi Gamma-ray Space Telescope science operations (ended on February 22, 2009), when PG 1553+113 was studied in detail at the GeV gamma-ray regime (Abdo et al. 2010a). The GeV emission state of PG 1553+113 did not show any significant changes; this can be taken as an indication that it was in a low-energy state throughout the observations.
The photometric spectral index taking the five nights together and using the mean magnitudes (corrected for Galactic extinction, Schlegel et al. 1998) was . Falomo et al. (1994) reported a mean value for the spectral index at visual wavelengths of , obtained from continuum fitting to the optical spectrum. Part of the difference between the two values could arise because our was calculated using photometric observations, which could be affected by atmospherics effects not completely removed (e.g., telluric lines). During the period of five years in the early ’90s, the authors reported that the maximum variation in was of about .
3.2 Polarimetry
Figure 2 presents the curves for the linear polarization and position angle against time along the five nights.
Following a criterion, we performed the statistical analysis for each night, in each filter, and also for the whole campaign. According to this criterion, a source can be classified as variable in an observing session for the observable if the probability of exceeding the value by chance is %, and it is classified as non-variable if the probability is %. If no definite decision could be reached with that criterion (any value between % and %), we call this a dubious behaviour. If the errors are random, should be distributed as with degrees of freedom, where is the number of points in the distribution. In Table 2 we show the values of the variability parameters for the linear polarization percentage (upper section) and for the position angle (lower section). Column 1 gives the observation date, Col. 2 gives the corresponding filter, Col. 3 shows the number of points for each night, Col. 4 gives the mean polarization (position angle) for the observing night, Col. 5 shows the rms (), Col. 6 gives the value for () (the difference between the maximum and the minimum values during the period reported), Col. 7 is (between the maximum and the minimum), and Col. 8 shows the value of .
Andruchow et al. (2008) present a method to estimate the degree of polarization of the nucleus, corrected for the de-polarizing effect from the host galaxy light. This requires a detailed knowledge of the host’s absolute magnitude and effective radius, but this information is not available for PG 1553+113 (its host remains undetected). However, from the upper limits on the magnitudes given in Urry et al. (2000), we do not expect that the host galaxy of PG 1553+113 would significantly reduce the degree of polarization of the active nucleus, nor would it introduce any spurious variation.
4 Discussion
We found that the flux in both filters, and , remained steady during the observing run reported here. On the other hand, for the degree of polarization and the position angle in the same period and in the same filters, the source showed small variations. Comparing our results with previous ones, we remark that Osterman et al. (2006) found in their multiwavelength campaign (April-May 2003) that PG 1553+113 was brighter in both optical bands by about mag without signs of variation. Those observations were made during an X-ray flare. In the same period, Andruchow et al. (2005) followed the source in linear optical polarization ( filter) during two nights with a good sampling in both nights. The degree of polarization and the position angle then showed microvariations with a most likely flickering behaviour. For the values reported here (see Table 2), we note that the degree of polarization was higher during 2003, as was the position angle. The polarization vector seems to have rotated, because the position angle varied by between both epochs, but it was still roughly orthogonal to the radio-jet direction reported by Rector et al. (2003).
This is particularly interesting given the recent detection of rapid optical polarization changes correlated with -ray variability in the blazar 3C 279 (Abdo et al. 2010c), which have been interpreted as the result of geometrical effects (see also Andruchow et al. 2003).
We also have preliminary results from photometric and polarimetric data taken in April 2007 (Andruchow et al. 2007) trough and filters. These show that PG 1553+113 presented no flux variations during the four nights during which it was followed, although the blazar was then slightly brighter ( mag) than in 2009. Regarding the optical linear polarization, we obtained one point per night, with no significant variations. The mean value was .
During 2005 and 2006 this source was detected at very high energies by HESS and MAGIC (Aharonian et al. 2006 and Albert et al. 2007, respectively). This very high emission was detected in between the optical observations that we discused above.
The data presented here can be useful to complete the multiwavelength view of this peculiar object. In the near future, using deep exposures with the Gemini North 8 m telescope, we will attempt to determine the redshift of the host galaxy.
| Date | Filter | n | |||||
| (2009) | hr | ||||||
| 21 Apr | 7 | 1.92 | 0.27 | 0.80 | 3.56 | 13.96 (4) | |
| 21 Apr | 7 | 1.95 | 0.15 | 0.40 | 3.05 | 8.78 (4) | |
| 22 Apr | 10 | 1.80 | 0.14 | 0.41 | 4.94 | 8.77 (1) | |
| 22 Apr | 10 | 1.82 | 0.16 | 0.56 | 4.47 | 10.30 (3) | |
| 23 Apr | 13 | 2.05 | 0.16 | 0.53 | 2.72 | 11.87 (8) | |
| 23 Apr | 14 | 2.00 | 0.11 | 0.42 | 4.37 | 6.99 (1) | |
| 24 Apr | 2 | 2.36 | 0.36 | 0.51 | 0.60 | 1.91 (8) | |
| 24 Apr | 2 | 2.30 | 0.26 | 0.37 | 0.57 | 1.66 (6) | |
| 25 Apr | 2 | 3.06 | 0.38 | 0.53 | 0.62 | 1.07 (4) | |
| 25 Apr | 3 | 2.86 | 0.28 | 0.50 | 1.35 | 1.38 (4) | |
| All | 34 | 2.03 | 0.35 | 1.95 | 88.73 | 80.35 (1) | |
| All | 36 | 2.03 | 0.32 | 1.75 | 69.44 | 77.61 (8) | |
| Date | Filter | ||||||
| (2009) | ∘ | ∘ | ∘ | hr | |||
| 21 Apr | 7 | 120.24 | 2.06 | 5.11 | 2.11 | 7.06 (4) | |
| 21 Apr | 7 | 116.82 | 1.82 | 5.76 | 3.00 | 7.52 (7) | |
| 22 Apr | 10 | 131.75 | 1.74 | 5.09 | 4.97 | 5.86 (4) | |
| 22 Apr | 10 | 129.27 | 1.65 | 4.98 | 5.54 | 6.99 (3) | |
| 23 Apr | 13 | 129.86 | 1.58 | 5.44 | 5.77 | 5.76 (5) | |
| 23 Apr | 14 | 129.75 | 1.80 | 5.38 | 1.25 | 10.19 (2) | |
| 24 Apr | 2 | 128.77 | 0.20 | 0.28 | 0.60 | 0.00 (4) | |
| 24 Apr | 2 | 132.89 | 0.54 | 0.76 | 0.57 | 0.04 (8) | |
| 25 Apr | 2 | 124.19 | 2.51 | 3.55 | 0.62 | 0.53 (9) | |
| 25 Apr | 3 | 126.98 | 0.76 | 1.37 | 0.63 | 0.22 (2) | |
| All | 34 | 128.04 | 4.69 | 15.88 | 26.07 | 217.18 (4) | |
| All | 36 | 127.05 | 5.45 | 19.34 | 69.75 | 361.33 (1) |


Acknowledgements.
The authors acknowledge support for different aspects of this work by grants AYA2010-21782-C03-03 from the Spanish government, Consejería de Economía, Innovación y Ciencia of Junta de Andalucía as research group FQM-322, excellence fund FQM-5418, FEDER funds, and by grants PICT 960 and PICT 2008-0627, from ANPCyT, Argentina. G.E.R. and J.A.C. were supported by grant PICT 07-00848 BID 1728/OC-AR (ANPCyT) and PIP 2010-0078 (CONICET), Argentina. Skillful assistance by the CAHA staff during the observations is also warmly acknowledged.References
- Abdo et al. (2009) Abdo, A. A., Ackermann, M., Ajello, M., et al. 2009, ApJ, 700, 597
- Abdo et al. (2010a) Abdo, A. A., Ackermann, M., Ajello, M., et al. 2010a, ApJ, 708, 1310
- Abdo et al. (2010b) Abdo, A. A., Ackermann, M., Agudo, I., et al. 2010b, ApJ, 716, 30
- Abdo et al. (2010c) Abdo, A. A., et al. (Fermi-Lat Collaboration) 2010c, Nature, 463, 919
- Aharonian et al. (2006) Aharonian, F., Akhperjanian, A. G., Bazer-Bachi, A. R., et al. 2006, A&A, 448, L19
- Albert et al. (2007) Albert, J., Aliu, E., Anderhub, H., et al, 2007, ApJ, 654, L119
- Andruchow et al. (2003) Andruchow, I., Cellone, S. A., Romero, G. E., Dominici, T. P., & Abraham, Z. 2003, A&A, 409, 857
- Andruchow et al. (2005) Andruchow, I., Romero, G. E., & Cellone, S. A., 2005, A&A, 442, 97
- Andruchow et al. (2007) Andruchow, I., Cellone, S. A., & Romero, G. E, 2007, Bol. Asoc. Argentina de Astron., 50, 299
- Andruchow et al. (2008) Andruchow, I., Cellone, S. A., & Romero, G. E, 2008, MNRAS, 388, 1766
- Cellone et al. (2007a) Cellone, S. A., Romero, G. E., & Araudo, A. T. 2007a, MNRAS, 374, 357
- Cellone et al. (2007b) Cellone, S. A., Romero, G. E., Combi, J. A., & Martí, J. 2007b, MNRAS, 381, L60
- Donato et al. (2001) Donato, D., Ghisellini, G., Tagliaferri, G., & Fossati, G. 2001, A&A, 375, 739
- Donato et al. (2005) Donato, D., Sambruna, R. M., & Gliozzi, M. 2005, A&A, 433, 1163
- Falomo et al. (1994) Falomo, R., Scarpa, R., & Bersanelli, M. 1994, ApJS, 93, 125
- Green et al. (1986) Green, R. F., Schmidt, M., & Liebert, J. 1986, ApJS, 61, 305
- Howell et al. (1988) Howell, S. B., Warnock, A., III, & Mitchell, K. J. 1988, AJ, 95, 247
- Landolt (1992) Landolt, A. U. 1992, AJ, 104, 340
- Mankuzhiyil et al. (2009) Mankuzhiyil, N., Dorner, D., Prandini, E., et al. 2009, arXiv:0907.0740
- Miller & Green (1983) Miller, H. R., & Green, R. F. 1983, BAAS, 15, 957
- Miller et al. (1988) Miller, H. R., Carini, M. T., Gaston, B. J., & Hutter, D. J. 1988, ESA Special Publication, 281, 303
- Osterman et al. (2006) Osterman, M. A., Miller, H. R., Campbell, A. M., et al. 2006, AJ, 132, 873
- Perlman et al. (2005) Perlman, E. S., Madejski, G., Georganopoulos, M., et al. 2005, ApJ, 625, 727
- Rector et al. (2003) Rector, T. A., Gabuzda, D. C., & Stocke, J. T. 2003, AJ, 125, 1060
- Reimer et al. (2008) Reimer, A., Costamante, L., Madejski, G., Reimer, O., & Dorner, D. 2008, ApJ, 682, 775
- Schlegel et al. (1998) Schlegel, D. J., Finkbeiner, D. P., & Davis, M. 1998, ApJ, 500, 525
- Tramacere et al. (2007) Tramacere, A., Giommi, P., Massaro, E., et al. 2007, A&A, 467, 501
- Turnshek et al. (1990) Turnshek, D. A., Bohlin, R. C., Williamson, R. L., et al. 1990, AJ, 99, 1243
- Urry et al. (2000) Urry, C. M., Scarpa, R., O’Dowd, M., et al. 2000, ApJ, 532, 816