Solar cycle variation in Sun-as-a-star Ca II 854.2 nm bisectors
Abstract
The bisector of the strong chromospheric Ca II 854.2 nm line has an inverse-C shape the cause of which is not yet fully understood. We show that the amplitude of the bisector in Sun-as-a-star observations exhibits a solar cycle variation with smaller amplitudes during highest activity. The line core intensity is lower during solar minima while the part of the bisector most sensitive to the line core shows no systematic change with activity. Our results support the use of Ca II 854.2 nm bisectors in studying the relationship between convection and magnetic fields, not only in the Sun but in other stars as well.
1 Introduction
In the Sun photospheric iron lines are on average blue-shifted and have C-shaped bisectors caused by granular convective motions: there is an area asymmetry between the up- and downflows as well as a correlation between intensity and flows, i.e., the upward moving granules are brighter and larger than the dark downflowing intergranules (e.g. Beckers & Nelson 1978; Nordlund 1980). In contrast, the chromospheric Ca II 854.2 nm line exhibits an inverse-C shaped bisector and a strong red asymmetry in the line core (Uitenbroek, 2006). The cause of the inverse-C shape is not fully understood. An inverse C-shape is also seen in photospheric line bisectors from stars in the hotter half of the H-R diagram (Gray & Toner, 1986). Gray (2010) attributes it in hot stars to a combination of a steep decline in velocities with height and the amount of asymmetry between up- and downflows.
Numerical simulations of the Sun, both with and without magnetic fields, fail to reproduce the observed inverse-C shape of the Ca II 854.2 nm line bisector (Leenaarts et al., 2009; Uitenbroek, 2006). In addition, the simulated line core tends to be narrower and deeper than what is observed (Leenaarts et al., 2009). The latter appears to be at least partly due to insufficient grid resolution, and thus, reduced velocity amplitudes in the simulations. Uitenbroek (2006) proposes that the inverse-C bisectors are not solely due to an area asymmetry, but also a time asymmetry from shock waves: the change from a sinusoidal wave to one with a sawtooth pattern caused by the steepening of the wave implies that instead of spending nearly equal time in up- and downflows a wave spends more time in the downflow phase leading to the red asymmetry. Based on the computations of Uitenbroek (2006), however, shock waves alone cannot account for the observed inverse-C shape. The 3-dimensional radiative magnetohydrodynamic simulations including both convection and shock waves also fail to reproduce the observed bisectors (Leenaarts et al., 2009).
Livingston (1982) found that the bisector amplitude (span) of the photospheric Fe I 525.0 nm line was reduced in magnetic regions relative to non-magnetic regions. He interpreted this as magnetic fields inhibiting convection and, thus, leading to reduced bisector amplitudes. A decrease in photospheric bisector amplitudes was found during the period from 1976 to 1982, i.e., from solar activity minimum to maximum consistent with increased magnetic flux reducing granular convection (Livingston, 1984). Based on 30-day average mean magnetic fluxes and photospheric bisector amplitudes, Bruning & Labonte (1985) suggested that the decrease in bisector amplitude is related to old plage regions rather than to active regions. Livingston et al. (1999) did not find a correlation in Solar Fourier Transform Spectrometer (FTS) bisector data and activity indices; instead they found indications of a 2-3 year lag between the bisector response and solar activity.
In the stellar context the Ca II 854.2 nm line is used as a proxy for magnetic activity (e.g., Linsky et al. 1979; Montes et al. 2000; Busà et al. 2007). NLTE calculations of the Ca II infrared triplet lines around 850 nm in stellar models show that the line central depression is less sensitive to photospheric parameters than the equivalent width, and if rotational broadening is taken into account, the line central depression is a purely chromospheric proxy (Andretta et al., 2005). Since the Ca II infrared triplet lines are included in the spectral region that will be observed by the upcoming GAIA mission, it is important to understand in more detail how the Ca II 854.2 nm line changes with magnetic activity.
As further motivation for this study in a broader context, we note that line bisector analysis can play an important role in the detection of exoplanets. The signature of stellar spots in radial velocity (RV) measurements can be similar to that of exoplanets. By combining RV measurements with bisector measurements it is possible to evaluate the contribution of stellar activity to the RV variations (e.g, Queloz et al. 2001; Povich et al. 2001; Dall et al. 2006; Pont et al. 2010; Figueira et al. 2010). Lagrange et al. (2010) used observations of sunspot distributions over a solar cycle to model the RV curve of a solar-type star. They find that the RV curve is highly variable depending on activity level and that there is a correlation between bisector amplitudes and RV even when multiple spots are present. Understanding the interplay between spot-induced variation in RV, particularly as reflected in bisector variation, can help to distinguish between RV variations that are induced by activity versus those caused by the presence of exoplanets
In this paper we use Sun-as-a-star Ca II 854.2 nm data covering over 25 years in time to study the solar cycle variation of the Ca II 854.2 nm line bisector and intensity. We find that the line core intensity and the portion of the bisector sensitive to the line wings (formed in the upper photosphere/lower chromosphere) are correlated with activity, while the bisector portion sensitive to the very line core and, thus purely chromospheric, is uncorrelated with activity.
2 Data
The Ca II 854.2 nm line has been used in Sun-as-a-star observations at the McMath-Pierce telescope (McM/P, Pierce 1964) since the mid-1980s. The observations were made by scanning with the spectrograph grating (see Brault et al. 1971 for a detailed description). The spectrograph is in the double-pass mode which compensates for electronic offsets and scattered light. A single element silicon diode was used to detect the signal. To integrate the sunlight for the Sun-as-a-star (full disk) observations the normal concave image-forming mirror of the telescope was replaced with a flat resulting in a pinhole image of the Sun on the grating. The main change in the observational setup was the upgrade of the grating in 1992; the old (25 cm 15 cm) grating was replaced by a larger one (42 cm 32 cm). The upgrade lead to some changes in the spectra: the line core intensity prior was a factor 1.07 higher than after the change, perhaps because of better sampling of the limb. Each intensity profile consists of 4096 wavelength points and usually between 10 and 20 scans were averaged for each profile measurement. Two wavelength samplings were used: 5.85 mÅ and 9.44 mÅ. The larger sampling was used before the change in the grating. In the analysis we include profiles with both wavelength samplings.
For the present analysis we use all the full disk Ca II 854.2 nm data, altogether 1035 profiles, from the time period 1985 to 2002 omitting profiles for which remarks of bad seeing or instrumental problems were found in the observing logs. Thus, we have coverage over solar cycles 22 and 23. There are lengthy periods when no data are available, especially between 1990 and 1996. However, we have very good coverage between 1996 and 2002 coinciding with the rising phase of cycle 23.
To verify our results we repeat the analysis with the daily synoptic spectral observations recorded by the SOLIS Integrated Sunlight Spectrometer (ISS). ISS observes the Sun-as-a-star in various wavelength regions, including the Ca II 854.2 nm line (design spectral resolution 300000). We use data starting from 2006 (first available ISS data) to the end of 2010. The range of activity covered by the data set is limited compared to the McM/P set. We do not directly compare values of the bisectors from ISS and McM/P, but instead focus on temporal trends within an instrument.
3 Results
We measure the bisectors for each of the 1035 observed McM/P profiles. Because there is a blend in the blue wing of the Ca II 854.2 nm line, we only include intensities below =0.45 (with the continuum intensity) in the bisector analysis. No blends are present in the red wing. For each measured profile we compute the line core intensity, , and three parameters to describe the bisector (see Fig. 1): , which is the where the red excursion of the bisector is the largest, is the amplitude of the bisector’s lower part (between and ) and of the upper portion (between and /=0.45). The line core is formed in the chromosphere while the formation of the wings is in the upper photosphere. Therefore, describes the truly chromospheric component of the bisector and includes an upper photospheric (starting at z=500 km above ) component. By considering only relative measures, such as bisector amplitudes (distances between two wavelength points), instead of parameters requiring an absolute wavelength calibration, such as the line core position, we avoid uncertainties due to the determination of the zero wavelength.
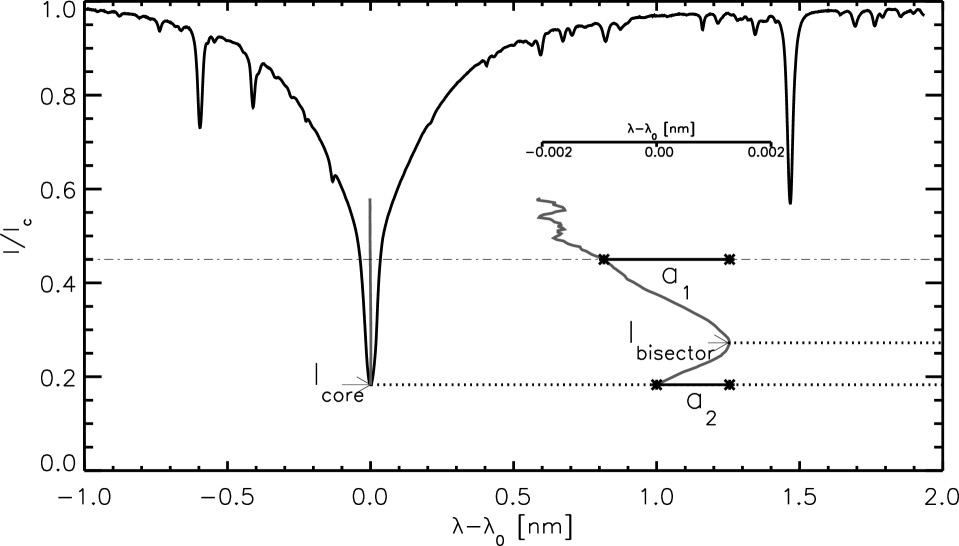
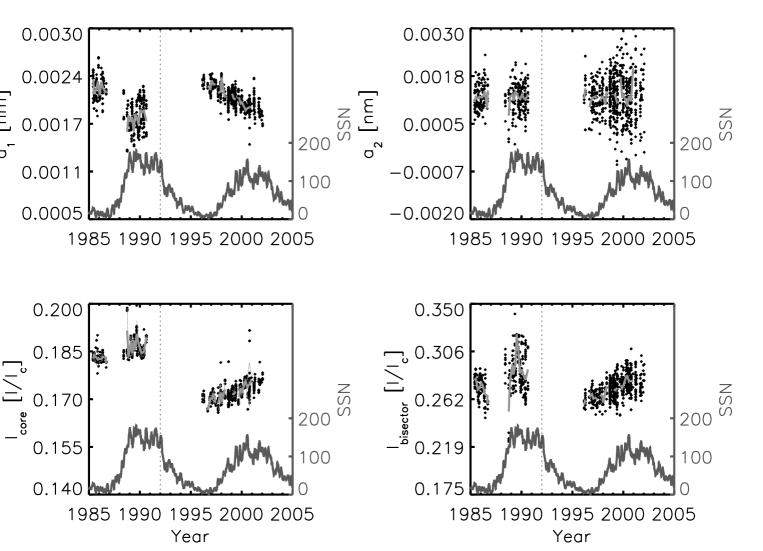
Fig. 2 shows how the Ca II 854.2 nm line changes with the solar cycle. Three of the measured parameters, , , and , show a solar cycle variation. This is especially well seen during the rising phase of cycle 23: the core intensity increases as the solar activity increases, i.e, the line becomes brighter. Also increases with activity. decreases with increasing activity while shows no systematic temporal trend.
| Parameter | |
|---|---|
| McM/P: | |
| -0.67 (-0.72) | |
| -0.071 | |
| 0.5 | |
| 0.46 | |
| ISS: | |
| -0.46 |
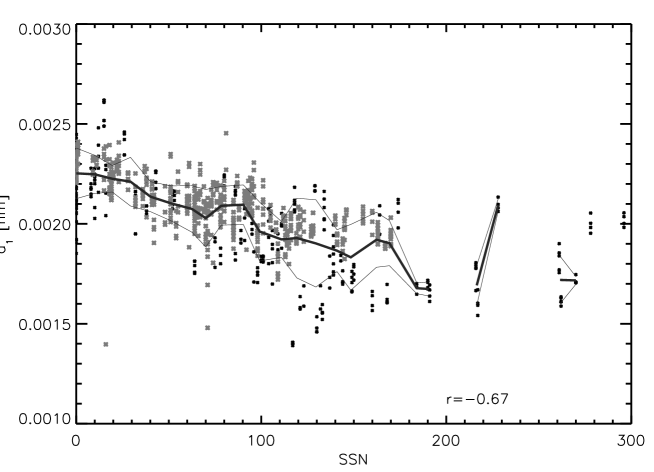
Of the two measures of the bisector amplitude, only (the component closer to continuum) is clearly correlated with the daily sunspot number (SSN, Fig. 3). Of all the parameters measured here, it has the strongest anticorrelation with SSN: the Pearson correlation coefficient is -0.67. See Table 1 for a summary of the correlation coefficients. If we only include profiles with the smaller wavelengths sampling, 5.85 mÅ, the correlation coefficient for and SSN is slightly larger: -0.72. This may be because of the better sampling or because the observations with the new grating coincide with the fairly monotonic rise of cycle 23. No correlation is seen for SSN and (r=-0.071). The correlation coefficient (after applying scaling factor 1.07 to account for the grating change) for SSN and is 0.50 and for SSN and 0.46.
Variation of with solar activity is a possible cause for the solar cycle dependence of . To rule this out, we recompute : instead of using a fixed =0.45 to define the intensity range from which the bisector amplitude is computed, we redefine the range as: [, +I]. The resulting correlation coefficients for and SSN for =0.2 and 0.3 are -0.54 and -0.67.
To test if there is a temporal delay between SSN and we used the discrete correlation function (Edelson & Krolik, 1988). The results show no evidence of a time lag, instead the function peaks at 0 days (r=-0.24).
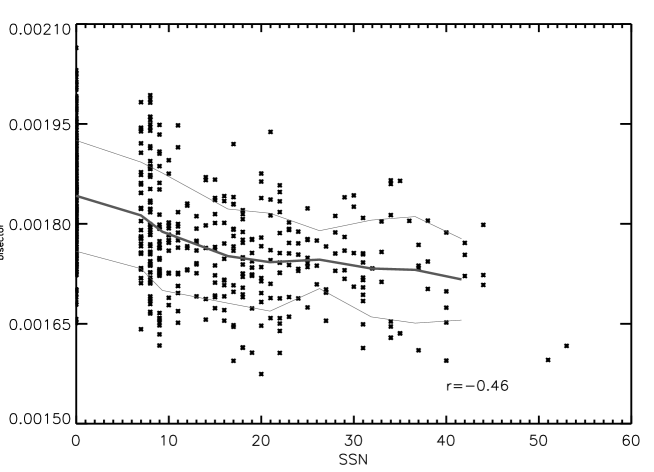
The ISS Ca II 854.2 nm data confirm that the change of the bisector amplitude is related to solar activity and not an artifact in the McM/P data (Fig. 3). The ISS spectral sampling is not as high as in the McM/P data, so for the ISS profiles we compute a single bisector amplitude, i.e., we do not divide the bisector in upper and lower parts. This amplitude essentially measures the same quantity as for the McM/P data. The correlation coefficient is -0.46, clearly lower than for the McM/P data. The range of solar activity covered by the ISS data is much smaller than in the McM/P data: the ISS data cover the very quiet solar cycle minimum when the sunspot number stayed below 50.
We also computed the correlation between the McM/P bisector amplitudes and the 1 Å Ca II K emission index from the NSO/AFRL/Sac peak Ca K-line Monitoring program (Keil et al., 1998). The correlation coefficient is -0.40. It should be noted that Ca II K data are available for only 420 days of the entire McM/P data set. The ISS also produces daily 1 Å Ca II K emission indices. For the ISS Ca II 854.2 nm bisector amplitude and Ca II K index data the correlation is -0.37.
4 Discussion
Our analysis combines data from McM/P and ISS and shows that there is a clear solar cycle variation in the line core intensity and the bisector of the Ca II 854.2 nm line. Furthermore, the bisector variation is mostly due to the upper photospheric/lower chromospheric component (). No solar cycle dependence is seen in the purely chromospheric bisector component (). The change in bisector amplitude as a function of sunspot number is seen both in McM/P and ISS data. The range of sunspot numbers in ISS data is smaller and also the scatter is larger. Since we see the trend in both, the formation of the asymmetries in the Ca II 854.2 nm line appears to be sensitive to fairly small changes in activity. Somewhat weaker correlations are found for the bisector amplitudes and the 1 Å Ca II K index.
An inverse correlation between solar activity and Ca II 854.2 nm bisector amplitudes is not surprising if convection is the cause of the inverse-C bisectors. Since we only see the variation in and not in , this may indicate that the amplitude of the inverse-C shape is mainly due to convective overshoot (similar to the regular C-shaped bisectors) and the lower portion of the bisector, (the purely chromospheric component), is produced by chromospheric dynamics which do not show any clear solar cycle variation when measured this way. Since we made no absolute wavelength calibration of the data, we cannot say if there is a solar cycle variation in the line core position. Convection simulations, both with and without magnetic fields, fail to reproduce the inverse-C shape (Leenaarts et al., 2009; Uitenbroek, 2006), making convection unlikely to be the sole explanation.
If instead the inverse-C bisectors are caused by shock waves as proposed by Uitenbroek (2006), then the amount of energy channeled into the chromosphere due to shock waves may depend on solar activity. The reduced bisector amplitude during activity may be related to the increased area of circumfacular regions, in which the Ca II 854.2 nm line is on average more symmetric and deeper (Harvey, 2005). The magnetic canopy, where the plasma- () is of the order of unity, is a region where waves are coupled and may be converted from one type to another (Bogdan et al., 2003). Near active regions the canopy is located at a lower height and the acoustic waves may be converted before they are steep enough to produce the observed red asymmetry (Uitenbroek 2006). As pointed out by Uitenbroek (2006), the inverse-C shape may be produced by a combination of time and area asymmetries although simulations including both have so far not been able to reproduce the observed bisectors. Whether more realistic simulations with higher spatial resolution will solve the problem remains to be seen.
We find that the bisector amplitude is correlated to the magnetic activity even during the last extended solar minimum. If canopies are a factor in producing the observed bisector solar cycle variation, then the Ca II 854.2 nm line bisector may provide an observational means to study convection and chromospheric magnetic fields in the Sun as well as other stars.
The Na I D1 line also has a bisector with an inverse-C shape (Uitenbroek, 2006). No long term monitoring of its bisector has been made, but it would not be surprising if it too exhibited similar solar cycle variation as Ca II 854.2 nm. Since the Na I D1 line is formed lower in the atmosphere than Ca II 854.2 nm, it would be interesting to see if the line core component of the Na I D1 bisector varies with solar activity. A study of bisectors in lines formed at different heights in the photosphere and chromosphere might reveal where and how a transition from the C- to the inverse C-shaped bisectors takes place.
Unlike Livingston et al. (1999), we find no temporal lag in the bisectors’ response to solar activity. It should be noted that Livingston et al. (1999) studied bisector amplitudes of photospheric lines whereas Ca II 854.2 nm is chromospheric. In Ca II 854.2 nm it is , not , which varies with solar activity. If the lag in photospheric line bisector amplitudes is real (the data used by Livingston et al. (1999) have some issues due to imperfect telescope alignment), a comparison between photospheric and chromospheric bisector amplitudes could help establish the cause of the observed inverse-C shaped bisectors.
We plan to expand the study of line bisector amplitudes’ solar cycle dependence to a larger number of solar spectral lines. The ISS data include a large variety of lines, both chromospheric and photospheric, which provide a unique data set to study the connection between convection and magnetic fields. Also of interest is to study in more detail how the bisectors respond to not only sunspots but also plage, network fields and canopies. In the stellar context it will be interesting to characterize how the Ca II 854.2 nm bisector is related to activity in other stars.
References
- Andretta et al. (2005) Andretta, V., Busà, I., Gomez, M. T., & Terranegra, L. 2005, A&A, 430, 669
- Beckers & Nelson (1978) Beckers, J. M. & Nelson, G. D. 1978, Sol. Phys., 58, 243
- Bogdan et al. (2003) Bogdan, T. J., Carlsson, M., Hansteen, V. H., et al. 2003, ApJ, 599, 626
- Brault et al. (1971) Brault, J. W., Slaughter, C. D., Pierce, A. K., & Aikens, R. S. 1971, Sol. Phys., 18, 366
- Bruning & Labonte (1985) Bruning, D. H. & Labonte, B. 1985, Sol. Phys., 97, 1
- Busà et al. (2007) Busà, I., Aznar Cuadrado, R., Terranegra, L., Andretta, V., & Gomez, M. T. 2007, A&A, 466, 1089
- Dall et al. (2006) Dall, T. H., Santos, N. C., Arentoft, T., Bedding, T. R., & Kjeldsen, H. 2006, A&A, 454, 341
- Edelson & Krolik (1988) Edelson, R. A. & Krolik, J. H. 1988, ApJ, 333, 646
- Figueira et al. (2010) Figueira, P., Marmier, M., Bonfils, X., et al. 2010, A&A, 513, L8+
- Gray (2010) Gray, D. F. 2010, ApJ, 721, 670
- Gray & Toner (1986) Gray, D. F. & Toner, C. G. 1986, PASP, 98, 499
- Harvey (2005) Harvey, J. W. 2005, AGU Spring Meeting Abstracts, B5+
- Keil et al. (1998) Keil, S. L., Henry, T. W., & Fleck, B. 1998, in Astronomical Society of the Pacific Conference Series, Vol. 140, Synoptic Solar Physics, ed. K. S. Balasubramaniam, J. Harvey, & D. Rabin, 301–+
- Lagrange et al. (2010) Lagrange, A., Desort, M., & Meunier, N. 2010, A&A, 512, A38+
- Leenaarts et al. (2009) Leenaarts, J., Carlsson, M., Hansteen, V., & Rouppe van der Voort, L. 2009, ApJ, 694, L128
- Linsky et al. (1979) Linsky, J. L., Hunten, D. M., Sowell, R., Glackin, D. L., & Kelch, W. L. 1979, ApJS, 41, 481
- Livingston (1984) Livingston, W. 1984, in Small-Scale Dynamical Processes in Quiet Stellar Atmospheres, ed. S. L. Keil, 330–+
- Livingston et al. (1999) Livingston, W., Wallace, L., Huang, Y., & Moise, E. 1999, in Astronomical Society of the Pacific Conference Series, Vol. 183, High Resolution Solar Physics: Theory, Observations, and Techniques, ed. T. R. Rimmele, K. S. Balasubramaniam, & R. R. Radick, 494–+
- Livingston (1982) Livingston, W. C. 1982, Nature, 297, 208
- Montes et al. (2000) Montes, D., Fernández-Figueroa, M. J., De Castro, E., et al. 2000, A&AS, 146, 103
- Nordlund (1980) Nordlund, A. 1980, in Lecture Notes in Physics, Berlin Springer Verlag, Vol. 114, IAU Colloq. 51: Stellar Turbulence, ed. D. F. Gray & J. L. Linsky, 213–224
- Pierce (1964) Pierce, A. K. 1964, Appl. Opt., 3, 1337
- Pont et al. (2010) Pont, F., Aigrain, S., & Zucker, S. 2010, ArXiv e-prints
- Povich et al. (2001) Povich, M. S., Giampapa, M. S., Valenti, J. A., et al. 2001, AJ, 121, 1136
- Queloz et al. (2001) Queloz, D., Henry, G. W., Sivan, J. P., et al. 2001, A&A, 379, 279
- Uitenbroek (2006) Uitenbroek, H. 2006, ApJ, 639, 516