Low polarized emission from the core of coronal mass ejections
Abstract
Aims. In white-light coronagraph images, cool prominence material is sometimes observed as bright patches in the core of coronal mass ejections (CMEs). If, as generally assumed, this emission is caused by Thomson-scattered light from the solar surface, it should be strongly polarised tangentially to the solar limb. However, the observations of a CME made with the SECCHI/STEREO coronagraphs on 31 August 2007 show that the emission from these bright core patches is exceptionally low polarised.
Methods. We used the polarisation ratio method of Moran and Davila (2004) to localise the barycentre of the CME cloud. By analysing the data from both STEREO spacecraft we could resolve the plane-of-the-sky ambiguity this method usually suffers from. Stereoscopic triangulation was used to independently localise the low-polarisation patch relative to the cloud.
Results. We demonstrated for the first time that the bright core material is located close to the centre of the CME cloud. We show that the major part of the CME core emission, more than 85% in our case, is H radiation and only a small fraction is Thomson-scattered light. Recent calculations also imply that the plasma density in the patch is 8 108 cm-3 or more compared to 2.6 106 cm-3 for the Thomson-scattering CME environment surrounding the core material.
Key Words.:
Sun: corona – Lines: profiles1 Introduction
The core of coronal mass ejection (CME) clouds occasionally exposes very bright concentrated patches in white-light coronagraphs. They are interpreted as cool plasma material from a prominence that was embedded inside the streamer environment of the CME before the eruption. During the eruption process, the prominence is then expelled along with the surrounding streamer plasma.
Poland and Munro (1976) report one such observation made on 21 August 1973, 15:11 UT with the Skylab white-light coronagraph and its HeII 30.4 nm spectroheliograph. About 18 min before, an H image taken at the Sacramento Peak Observatory had shown bright patches extending out to 1.42 R⊙ but fading in intensity with time. Even though the coronagraph field-of-view was limited to above 1.5 R⊙, it was concluded that H radiation contributed to the white-light image because its signal was less polarised in some bright patches than in the surrounding region.
H radiation is the result of the electronic =3 =2 transition of the hydrogen atom. In equilibrium at an electron temperature below 50,000 K, the =3 level is populated much more by absorption of the ambient Ly radiation than by absorption of photospheric H. This causes a substantial decrease in polarisation of the emitted H radiation below the theoretical maximum value of 30% for pure resonant scattering (Poland and Munro 1976). Besides, the Hanle effect caused by the coronal magnetic field (Sahal-Brechot et al. 1977, Heinzel et al. 1996) and collisional depolarisation (Bommier et al. 1986) reduce the amount of polarisation even further. As a result, the linear polarisation of H radiation observed in prominences well above the limb ranges from a fraction of a percent (Gandorfer, 2000; Wiehr and Bianda, 2003) to a few percent (Leroy et al., 1984).
The white-light emission of the solar K-corona originates in Thomson-scattering of photospheric light by free electrons. Detailed description of the Thomson-scattering theory can be found in various papers (e.g., Minnaert 1930; van de Hulst 1950; Billings 1966). The anisotropy of the incident light causes the observed scattered radiation to exhibit a polarisation parallel to the visible limb. The degree of polarisation depends on the distance from the solar surface and on the scattering angle to the observer. Indeed, it has been proposed to use the observed degree of polarisation to estimate the distance of the coronal scattering volume off the plane of the sky (POS; e.g., Moran and Davila 2004, Dere et al. 2005, Vourlidas and Howard 2006). Hence, a reduction of polarisation of a white-light signal from the corona can in principle also be explained by a geometric effect, and Poland and Munro’s conclusion only holds if it is assumed that the H material is well embedded in the CME cloud of enhanced electron density and is located close to the POS of the observer.
In this letter, we report the observation of a similar incidence with the COR1 coronagraph on board the two STEREO spacecraft A and B. In addition to the polarisation measurements from which we determine the azimuthal barycentre position of the CME plasma, a stereoscopic triangulation of the low-polarisation patch proves that the prominence material is well embedded inside the CME.
2 Observations
EUVI and COR1 are the multi-wavelength EUV telescope and the innermost coronagraph of the Sun Earth Connection Coronal and Heliospheric Investigation (SECCHI) instrument suite (Howard et al. 2008) aboard the twin Solar Terrestrial Relations Observatory spacecraft (STEREO, see Kaiser et al. 2008). Each of the COR1/STEREO telescopes has a field of view from 1.4 to 4 R⊙ and observes in a white-light waveband 22.5 nm wide centred at the H line at 656 nm (Thompson and Reginald 2008). The COR1 coronagraphs take polarised images at three different polarisation angles at 0, 120, and 240 degrees. These primary data allow to derive Stokes I,U and Q components and finally total (), polarised () and unpolarised brightness () images.
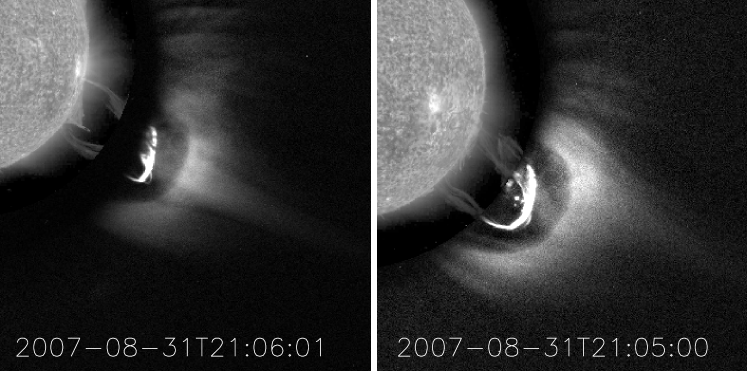
The start of a prominence eruption was observed in EUVI HeII bandpass images at 30.4 nm on 31 August 2007, at around 19:00 UT. Approximately eight hours before, a dark filament was detected about 100,000 km south of an active region close to the west limb in the H images of Kanzelhöhe Observatory, which had disappeared the following day (http://cesar.kso.ac.at/halpha2k/archive/2007). At about 21:00 UT, the HeII prominence had risen to 1.5 R⊙ and appeared co-spatial with the bright core of a structured CME detected in COR1 images (Fig. 1, see for e.g. Cremades and Bothmer 2004 for the definition of a structured CME).
Preliminary COR1 images of the event studied here revealed patches of extremely low polarisation in the bright CME core. These patches of low polarisation could faintly be detected even out to about 7 R⊙ in COR2 at about 2:00 UT the next day. COR2 is the outer coronagraph of STEREO/SECCHI, which covers distances from 3 to 15 R⊙. The outward velocity of these patches started from about 170 km/s in COR1 and accelerated to 240 km/s in the COR2 field of view.
3 Data analysis
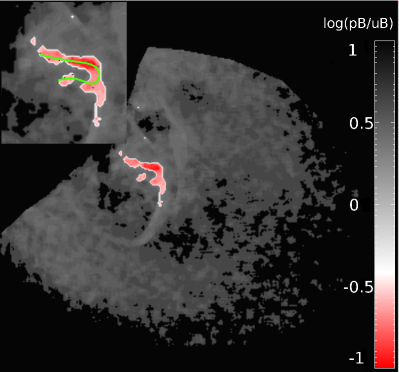
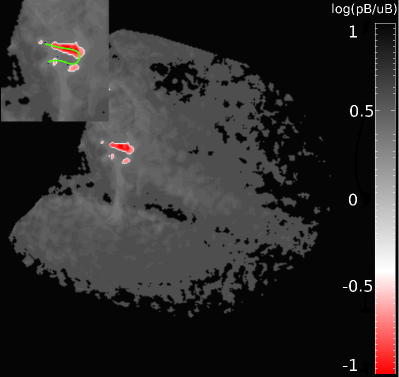
For a more quantitative analysis we removed the background contribution by subtracting a minimum intensity and image from each and images, respectively. The minimum images were obtained over a time range of 12 hours, centred at the launch time of the CME. As a result, we obtain the brightness of the CME alone. In Fig. 2 we display the resulting ratio of polarised to unpolarised image intensities. From both instruments we see bright patches of extremely low polarisation (red, 0.1) at about 1.5 R⊙ inside the strongly polarised CME cloud (grey, 0.5).
The degree of polarisation of Thomson-scattered light by coronal electrons is a function of the scattering angle between the incident light direction and the direction towards the observer (Billings, 1966). A scattering location close to the POS has a 90 degree scattering angle and yields a high polarisation parallel to the limb. A scattering location far off the POS corresponds to nearly forward/backward scattering, which is hardly polarised. This effect allows us to estimate an effective scattering angle from the observed degree of polarisation for each pixel that can be related to an effective distance of the scattering location from the POS.
Moran and Davila (2004) and Dere, Wang, and Howard (2005) introduced this method, called polarisation ratio method (PR), to construct the azimuthal barycentre plane of a CME. We used this technique to infer the propagation direction of the CME discussed here (Mierla et al. 2009). The method is applied here to polarisation data from COR1/STEREO A and B taken at around 21:30 UT. At each pixel of the images, the ratio is calculated and converted into the effective scattering distance along the line-of-sight from the POS. Owing to the forward/backward symmetry of Thomson scattering, the brightness ratio does not indicate whether the scatterer is in front of or behind the POS. This ambiguity can be resolved, however, by matching the scattering locations derived from STEREO A and B observations.
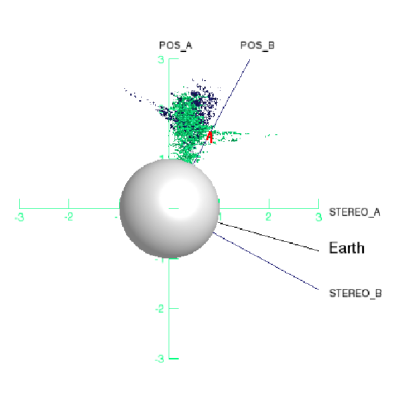
In Fig. 3 we display the result of this analysis as viewed from a direction along the northward normal of the STEREO mission plane. The green and blue dots represent the scattering location derived from COR1/STEREO A and B pixels of the CME cloud, respectively. Obviously, they match well if the barycentre of the CME is assumed in front of the POS of STEREO A but behind the POS of STEREO B. The only exception are the ”horns” that extend to the far right for STEREO A and to the far left for STEREO B pixels. These “horns” result from the low-polarisation patches observed in each of the COR1 images. If they were produced by Thomson scattering, the low-polarisation patch would have to be located at the tip of the ”horns” in Fig.3, i.e., far away from the centre of the CME. However, these positions from STEREO A and B are several solar radii apart and are therefore inconsistent.
An independent estimate of the location of the low-polarisation patch can be obtained by stereoscopy, provided we assume that the patches we see in both coronagraphs are the same object. Both in brightness (see Fig. 1) and in polarisation ratio (see Fig. 2) the patches displayed a high contrast and a sharp boundary with respect to the CME environment. The COR1 instrument of STEREO B seems somewhat less sensitive because not all features of the STEREO A patch can be matched to an equivalent signal in the STEREO B image. Yet we could determine a loop-like 3D curve, the projections of which trace out the patches in COR1/STEREO B and the major structures in COR1/STEREO A. These projections are drawn in green into the inserts of Fig. 2.
The 3D curve is again projected into Fig. 3, in red. The triangulation of the patches locates it very close to the barycentre plane of the CME. Note that the cloud in Fig. 3 does not show the full extent of the CME, but is only an approximation of its azimuthal barycentre plane. The PR method cannot resolve the azimuthal extent of a CME (see Mierla et al., 2011).
4 Discussion
Low polarisation in coronagraph images can have several explanations: 1) F-corona emission (e.g., Morgan and Habbal 2007), 2) Thomson scattering from enhanced plasma density far away from the POS (e.g., Billings 1966), and 3) H emission (e.g., Poland and Munro, 1976). F-corona contributions can be ruled out because it forms a diffuse background and does not vary rapidly in time. The subtraction of the minimum background intensities from our images should have removed any F-corona contribution. The interpretation of the low-polarisation patches by Thomson scattering can also be ruled out. We showed in the previous section that this assumption leads to different locations of the scatterer for STEREO A and B observations, which are both inconsistent with the results from the stereoscopic triangulation.
We are therefore left with the last explanation. H patches in white-light coronagraph images have only rarely been reported, even though bright amorphous structures are often seen in CME clouds. Coronal mass ejections often appear in coronagraph images as three-part structures composed of a bright leading edge, a dark cavity, and a bright core, which are associated with the compressed solar plasma ahead of the ejecta, the erupting magnetic flux rope, and the cool and dense prominence plasma, respectively (e.g., Cremades and Bothmer 2004). However, a convincing identification of the white-light core of the CME with the cool prominence material is relatively rare. Even if recent studies have demonstrated a strong connection between prominence eruptions and CMEs, the correlation is not always one-to-one.
It is not quite clear how much of the emission from the bright core structures are produced by Thomson scatter from its enhanced plasma density and how much stems from H radiation. Because we observed the patches at an outward velocity above 100 km/s, their H resonance is well outside of the H absorption line from the solar surface spectrum. Even though the depth of the absorption is 1/7 of the surrounding continuum, the H radiation emitted from the rising patch is only little enhanced by this Doppler brightening effect because of the complicated balance of the electronic level population of hydrogen atoms exposed to the solar spectrum (e.g., Hyder and Lites 1970).
The observed brightness of the H patch in the image is in fact a line-of-sight (LOS) superposition of the radiation from the three different sources: the H radiation, , and the Thomson scatter, , from inside the H cloud and the ambient Thomson scatter, , along remaining part of the LOS through the patch. The latter contribution can roughly be assumed equal to the Thomson scatter measured close to, but outside the H patch.
Both the total and the polarised intensities add (assuming that the polarisation direction in all three components is the same),
| (1) | |||
| (2) |
We find that the total brightness of the H patch (around 1–5 MSB, where MSB is mean solar brightness) is about 10 times as high as a typical value in the Thomson-scattering area (around 1–5 MSB), i.e., . According to the Thomson-scattering theory (Billings 1966), the calibrated value of corresponds to an electron column density along the LOS of 1.8 1017 cm-2. For a depth of the CME cloud of about 1 R⊙, this yields an excess density of the CME over the streamer background of 2.6 106 cm-3.
For the polarisation ratio we find (see Fig. 2)
where is the polarisation ratio of the respective component. For Thomson scatter, should depend only on the distance from the solar surface, hence we can assume . Obviously, must be significant in (1) over the Thompson scatter contribution because differs considerably from .
Inserting the observed total brightness and polarisation ratios into (1) and (2) and eliminating , we obtain the relation
Judging from the brightness and polarisation ratios observed, cannot be higher than 1/18. This low value of the intrinsic H polarisation ratio agrees with the low values obtained for chromospheric measurements (Gandorfer, 2000; Wiehr and Bianda, 2003). Moreover, the ratio cannot be lower than 8. Consequently a large part of the radiation from the core patch (at least 88%) must be H emission.
Jejčič and Heinzel (2009) have calculated the ratio for various temperatures and densities (note that they assume a different white-light bandwidth 10 nm instead of 22.5 nm and a dilution factor =0.416 instead of 0.21 appropriate for 1.5 R⊙. This causes our white-light intensities to be 1.3 times brighter than the model intensities assumed in their paper. We neglect this factor in view of the approximate nature of our estimate). For the comparatively low densities we expect in the corona, they derive a linear relation, , which only weakly depends on temperature, provided it is below 15000 K. If these conditions hold in our case, the density in the H patch would exceed 8 108 cm-3 and would hence be nearly three orders of magnitude of what we estimated for the CME cloud outside of the patch.
The brightness from the core patch in the CME is dominated by H radiation. If, reversely, we had assumed to be entirely caused by Thomson scatter, we would have obtained a gross overestimate of the density in the CME core. In view of this result, some CME mass estimates in previous studies, where the contribution of the core brightness was not negligible, may have to be revised.
5 Conclusions
We showed that the white-light core of the 31 August 2007 CME is clearly identified with the eruptive prominence observed in the EUVI 304 images. To our knowledge, we demonstrate for the first time that this core material is located close to the centre of CME cloud. Moreover, we showed that the major part of the CME core emission, more than 85% in our case, is H radiation and only a small fraction is Thomson-scattered light. We made a rough estimate of the electron density, showing that the density in the H patch will exceed by nearly three orders of magnitude what we estimated for the CME cloud outside of the patch.
Acknowledgements.
MM would like to thank T. Moran and A. Vourlidas for constructive discussions on PR method and electron densities. The authors acknowledge the use of SECCHI data. The contribution of the IC and BI benefited form support of the German Space Agency DLR and the German ministry of economy and technology under contract 50 OC 0904. BI thanks A. Gandorfer for enlightening discussions on the nature of the H radiation.References
- Billings (1966) Billings, D.E., 1966, A guide to the Solar Corona, New York Academic Press.
- Bommier et al. (1986) Bommier, V.; Sahal-Brechot, S.; Leroy, J. L., 1986, A&A, 156, 79
- Cremades and Bothmer (2004) Cremades, H., Bothmer, V., 2004, A&A, 422, 307
- Dere et al. (2005) Dere, K. P.; Wang, D.; Howard, R., 2005, ApJ, 620, 119
- Gandorfer (2000) Gandorfer, A. 2000, The Second Solar Spectrum, vol. I: 4625 Å to 6995 Å, ISBN No. 3 7281 2764 7 (Zurich: VdF)
- Heinzel et al. (1996) Heinzel, P.; Bommier, V.; Vial, J. C., 1996, Sol.Phys., 164, 211
- Howard et al. (2008) Howard, R. A.; Moses, J. D.; Vourlidas, A. et al., 2008, SSRv, 136, 67
- Hyder and Lites (1970) Hyder, L.C.; Lites, B.W., 1970, Sol.Phys., 14, 147,
- Jejčič and Heinzel (2009) Jejčič, S.; Heinzel, P., 2009, SolPhys, 254, 89
- Kaiser et al. (2008) Kaiser, M. L.; Kucera, T. A.; Davila, J. M. et al., 2008, SSRv, 136, 5
- Leroy et al. (1984) Leroy, J. L.; Bommier, V.; Sahal-Brechot, S., 1984, A&A, 131, 33
- Lyot (1939) Lyot, B., 1939, MNRAS, 99, 580
- Mierla et al. (2009) Mierla, M.; Inhester, B.; Marque, C. et al., 2009, Sol.Phys., 259, 123
- Mierla et al. (2010) Mierla, M.; Inhester, B.; Rodriguez et al., 2011, JASTP, in press, doi:10.1016/j.jastp.2010.11.028
- Minnaert (1930) Minnaert, M., 1930, ZA, 1, 209
- Moran and Davila (2004) Moran, T.G., Davila, J.M., 2004, Science, 305, 66
- Morgan and Habbal (2007) Morgan, H.; Habbal, S. R., 2007, A&A, 471, 47
- Poland and Munro (1976) Poland, A. I.; Munro, R. H., 1976, ApJ, 209, 927
- Sahal-Brechot (1977) Sahal-Brechot, S.; Bommier, V.; Leroy, J. L., 1977, A&A, 59, 223
- Tandberg-Hanssen (1995) Tandberg-Hanssen, E. 1995, Science, 269, 111
- Thompson and Reginald (2008) Thompson, W. T.; Reginald, N. L., 2008, Sol.Phys., 250, 443
- van de Hulst (1950) van de Hulst, H. C., Bull. of Astron. Inst of Netherland, 11, 135
- Vourlidas and Howard (2006) Vourlidas, A., Howard, R.A., 2006, ApJ, 642, 1216
- Wiehr and Bianda (2003) Wiehr, E.; Bianda, M., 2003, A&A, 404, 25