The Expansion Proper Motions of the Planetary Nebula NGC 6302 from HST imaging
Abstract
Planetary nebulae expand on time scales of – yr. For nearby objects, their expansion can be detected within years to decades. The pattern of expansion probes the internal velocity field and provides clues to the nebula ejection mechanism. In the case of non-symmetric nebulae, and bipolar nebulae in particular, it can also provide information on the development of the morphology. We have measured the expansion proper motions in NGC 6302 from two epochs of HST imaging, separated by 9.43 years. This is used to determine the expansion age and the structure of the velocity field. We use HST images in the [N II] 6583Å filter from HST WF/PC2 and WFC3. The proper motions were obtained for a set of 200 individual tiles within 90 of the central star. The velocity field shows a characteristic linear increase of velocity with radial distance (a so-called Hubble flow). It agrees well with a previous determination by Meaburn et al. (2008), made in a lobe further from the star, which was based on a much longer time span, but ground-based imaging. The pattern of proper motion vectors is mostly radial and the origin is close to the position of the central star directly detected by Szyszka et al. (2009). The results show that the lobes of NGC 6302 were ejected during a brief event yr ago. In the inner regions there is evidence for a subsequent acceleration of the gas by an additional 9.2 km/s, possibly related to the onset of ionization. The dense and massive molecular torus was ejected over 5000yr, ending about 2900yr ago. The lobes were ejected after a short interlude (the ’jet lag’) of yr during a brief event. The torus and lobes originate from separate mass-loss events with different physical processes. The delay between the cessation of equatorial mass loss and the ejection of the lobes provides an important constraint for explaining the final mass-loss stages of the progenitor stellar system.
keywords:
stars: AGB and post-AGB stars: winds, outflows planetary nebulae: general planetary nebulae: individual: NGC 63021 Introduction
Planetary nebulae (PNe) are among the fastest evolving objects in the Universe. They form when a solar-like star with mass in the range 1–7 M⊙ reaches the asymptotic giant branch (AGB). On the AGB the star develops a degenerate C/O core and a convective envelope which is ejected during a phase of extreme mass loss (e.g. Habing, 1996). The ejected envelope expands away from the star with velocities of a few tens of km s-1. The remaining core quickly transitions from a surface temperature of K to K, within yr, before nuclear burning ceases and the star enters the white dwarf cooling track. The envelope is ionised by the hot core and forms the visible PN.
Since the shell ejection is short-lived, expansion of the planetary nebula can be observed within decades for nearby PNe. This expansion in the plane of the sky (expansion proper motion) has been measured for several objects, mostly using Very Large Array (VLA) and/or Hubble Space Telescope (HST) observations. By equating the nebula expansion in the plane of the sky with the measured line-of-sight expansion velocity, expansion proper motions have been used as a tool for measuring distances (Masson, 1986; Hajian et al., 1993; Meaburn, 1997; Palen et al., 2002; Meaburn et al., 2008; Guzmán et al., 2009) and thus stellar masses (Zijlstra et al., 2008).
The expansion of the planetary nebulae is assumed to be spherically symmetric (e.g. Guzmán et al., 2009) or described by a simple velocity law (Zijlstra et al., 2008). But PNe show complex morphologies, including tori, bipolar outflows, highly collimated jet-like structures, and knots (Balick & Frank, 2002). It is unlikely that all these structures expand in spherical unison. In fact, velocity fields and expansion proper motions in some cases show evidence of Hubble-like (viz. ) outflows (e.g. Meaburn et al., 2008; Corradi, 2004). High accuracy expansion measurements can reveal the internal dynamics of the complex structures, and thus help to constrain their origin and evolution.
A detailed study of the expansion of the the planetary nebula NGC 6302 (PN G349.5+01.0) is presented here based on the highest spatial resolution imagery available. NGC 6302 is among the most strongly bipolar (or even multi-polar) of the Galactic planetary nebula, and has been imaged twice with the HST.
Meaburn et al. (2008) measured the proper motion of 15 features (knots) in the north-western lobe, from two observations separated by a period of 50.88 years. From the expansion parallax, a distance of 1.17 kpc and an age of 2200 years were derived. The earlier epoch observation was based on archival photographic plates (Evans, 1959). The accuracy is limited by (apart from the time baseline), the image quality of the plate, and the seeing of the ground-based observations. To significantly improve on these data, space-based observations are required.
Two sets of HST observations taken 9.4 years apart are used in this paper to study the differential expansion of the lobes in the inner regions of the nebula. The HST images give a spatial resolution of 0.1′′ per pixel, allowing very compact knots and structures to be resolved, and to thus detect small proper motions. Section 2 presents the observations. The reduction and analysis are described in Section 3. The discussion in section 4 concentrates on the implication of the pattern of the nebula expansion proper motions. Conclusions are presented in Section 5.
2 Observations
The planetary nebula NGC 6302 has been imaged with the Hubble Space Telescope (HST) at two epochs. The first data set was taken on 2000 February 21 (MJD = 51595.93171041) with Wide Field Planetary Camera 2 (WF/PC2). Two narrow-band filters F658N and F656N were used for this observation. The second set of imaging observations were made on 2009 July 27 (MJD = 55039.80441102) with Wide Field Camera 3 (WFC3) ultra-violet and visible channel (UVIS) as part of the Servicing Mission 4 Early Release Observations. Among the six narrow-band filters used, F658N, F656N are in common with the WF/PC2 data. Table 1 presents brief details of both sets of observations.
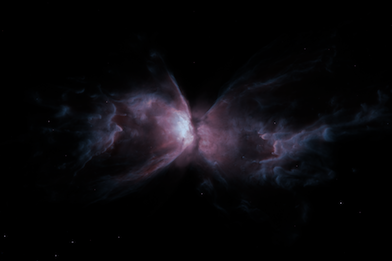
The existence of two epochs of observation, separated by 3443.8727 days (9.4353 years) presents the opportunity to directly measure proper motions (PM) of the expanding nebula. The WFC3 field of view is arcsec. This covers the bright, central region of the nebula. The approximate area covered is shown in Fig 1, overlaid on an ground-based H image covering the full nebula. The older WF/PC2 observations (Matsuura et al., 2005), taken with a smaller field of view, focussed on the eastern lobe. The WFC3 data cover most of the nebula, but the expansion could obviously only be studied in the region of overlap. Meaburn et al. (2008) used the opposite, western lobe, and used data at larger distances from the central star than studied here.

| Filter | Date | Integration | Dataset |
|---|---|---|---|
| F656N | 2000-02-21 | 610s | U5HH0602B |
| F658N | 2000-02-21 | 470s | U5HH0602R |
| F656N | 2009-07-27 | 2100s | IACO01010 |
| F658N | 2009-07-27 | 2220s | IACO01020 |
2.1 Differences in filters transmissions
| Instrument | Filter | [N ii] 6549Å | H6565Å | [N ii] 6585Å |
|---|---|---|---|---|
| WF/PC2 | F656N | 0.22a | 0.77 | 0.03 |
| WF/PC2 | F658N | – | 0.03 | 0.78 |
| WFC3 | F656N | 0.01b | 0.81 | – |
| WFC3 | F658N | – | – | 0.91 |
-
a
The filter curve is steep at this wavelength. Based on the largest observed velocity shifts on the nebula, the transmission can vary within the range 0.1–0.4.
-
b
Similar as for a, the transmission ranges from 0.001 to 0.03.
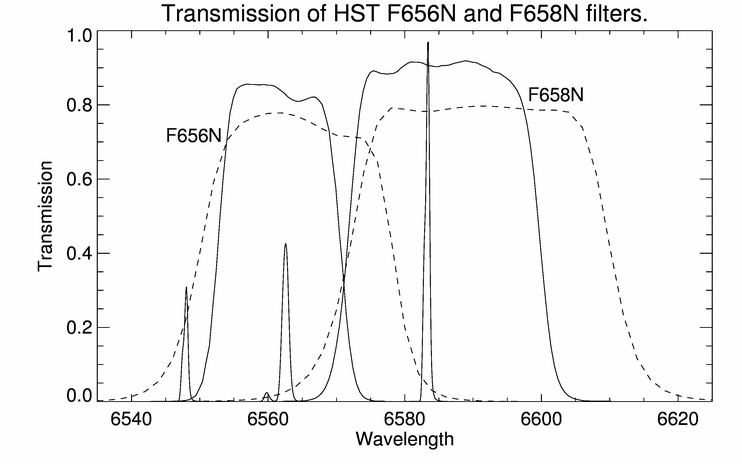
During both epochs, NGC 6302 was observed with both the F658N and F656N filters. Although the filter names stayed the same, the characteristics have changed. The WFC3 filters are narrower, sharper, and more efficient than the WF/PC2 filters of the same name, as demonstrated by Figure 2. The F656N image is usually called the H image while the F658N frame is attributed to [N ii] emission at wavelength 6583Å. For the expansion measurements the [N ii] image (F658N) proved to be most suitable and is the one used in this work.
For reference a scaled spectrum of NGC 6302 is shown in Figure 2 where three brightest emission lines are clearly visible (H 6563 Å, [N ii] 6548 and 6583 Å). The filter transmissions at these specific wavelengths are listed in Table 2. These filter responses, together with the observed integrated line flux ratios [N ii](6549 Å):H:[N ii](6549 Å) = 1:1.6:3.0 (Tsamis et al., 2003) reveals that about 25% of the total photon count in the WF/PC2 F656N image comes from the [Nii] doublet, while the same ion contributes only about 2% of the total flux for the WFC3 F656N filter. This makes it more difficult to directly compare these two H images. The nebular line wavelengths also depend on the position within the nebula, due to the velocity field (Meaburn & Walsh, 1980; Meaburn et al., 2005). This introduces a further transmission uncertainty for the [N ii] 6548 Åline which is situated at the edge of the F656N filter.
The difference in the [N ii] contribution causes a notable difference in the two H images. The WFC3 image, which isolates H much better, shows a smooth emission structure. The WFPC2 image shows a mixture of this smooth component and a knotty component. This knotty component dominates the F658N images and is attributed to the [N ii] emission. Because of this strong difference between the two H images, and the fact that proper motions measurements are aided by the presence of compact structures, we only make use of the F658N images here.
3 Reduction and analysis
The analysis started with the pipeline-reduced data products, provided by the Hubble Archive hosted by the Space Telescope European Coordinating Facility (ST-ECF). For WF/PC2, data products from version 2.5.1 of the STSDAS calibration pipeline (CALWFP) were used while for WFC3 UVIS, the data were calibrated using version 2.0 of the calibration pipeline (CALWF3). The pipelined images were ’drizzled’ (i.e. created by combining images with sub-pixel shifts) using the task ’multidrizzle’ in STSDAS. This also corrects for the geometric distortion of the respective cameras.
Further reductions to improve the astrometric calibration, and the geometric distortions were applied and are detailed below.
3.1 Astrometry Calibration
The absolute astrometry as returned by the pipeline reduction is based on guide stars from the GSC2, which have a typical positional uncertainty of – depending on magnitude (Lasker et al., 2008). Depending on the sets of guide stars used, the astrometry for both sets of observations can differ. In addition the WFC3 data had not been fully calibrated at the time the observations were reduced, so larger errors may be present in the pipeline calibration.
To improve the relative astrometry of the two sets of images, we identified common field stars present in both epochs. The stars were identified from the Two Micron All Sky Survey (2MASS) catalogue (Skrutskie et al., 2006), being the most complete stellar catalogue at the relevant magnitude levels. Catalogue stars were excluded where two sources were visible in the HST images within a circle of 1′′ radius from the 2MASS position (which would be merged at the 2MASS resolution). Stars were also excluded if they were farther than 1′′ from the 2MASS position, taken as evidence for large proper motion.
For the WF/PC2 frame, the astrometric solution was tested using the astrometry tool in Gaia/Starlink with the 2MASS catalogue in the field of view (rejecting galaxies). The solution showed an individual scatter in the stellar positions of around 0.3′′ and a mean shift of 0.1′′ ( 1 pixel). The procedure was repeated with the WFC3 image. This latter step revealed a distinct shift (about 75 WFC3 pixels), attributed to the pipeline reduction of these early in-flight data. This shift was corrected within Gaia by a translation in RA and Dec, assuming no rotation and a constant pixel scale.
At this point, the WFC3 and WFC2 images have the same astrometry but different pixel scale and orientation. We rotated the images to a N-E orientation (for the WF/PC2 image this was already done by the pipeline), and re-binned the higher resolution WFC3 data (0.04 arcsec/pixel) to the resolution of WF/PC2 chips (i.e. 0.1 arcsec/pixel), bringing both frames onto the same spatial grids. This was done utilising the MONTAGE software tool.
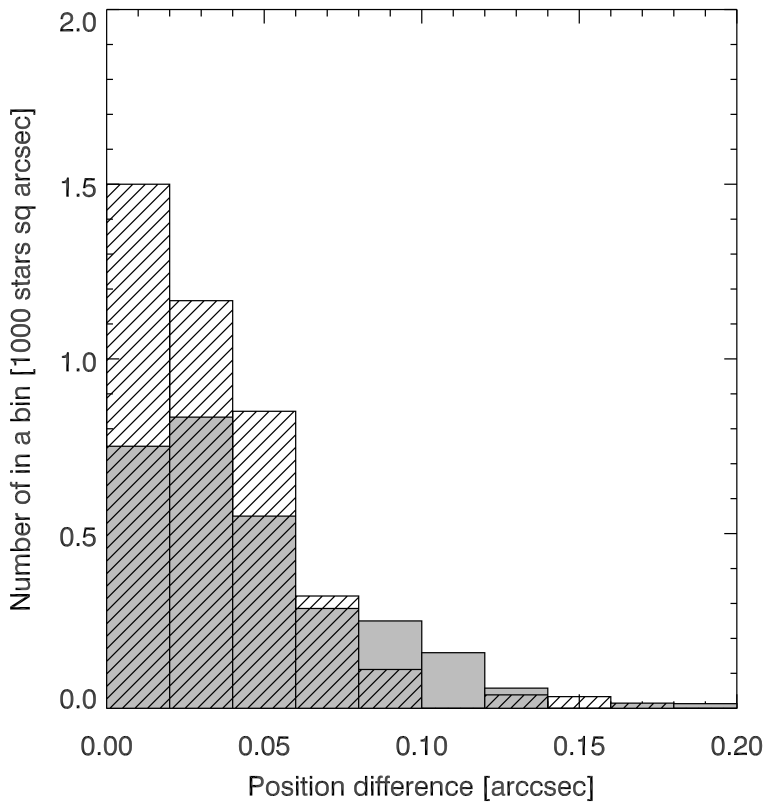
In a third step, for the 2MASS stars in common between both epochs, the centroid positions were measured in GAIA/STARLINK in each frame to test for shifts. Sources which presented a shift between the two epochs larger than 1.4pix (0.14”) were excluded, suspected to be stars with high proper motion (this step removed five stars). This left 54 stars in common between both frames. The histogram of the shifts between these 54 stars is shown in Fig. 4 (the shaded area). This distribution is rather wide, suggesting a possible residual astrometric error.
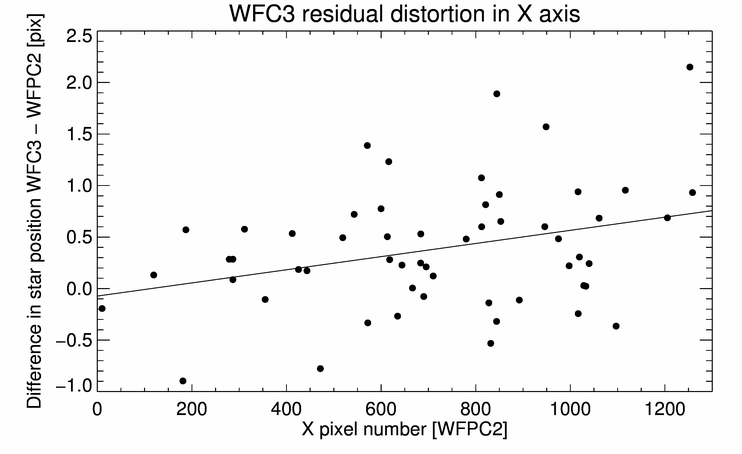
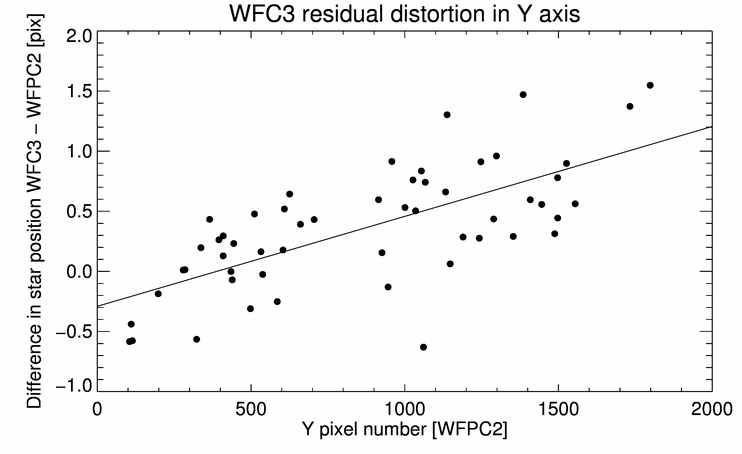
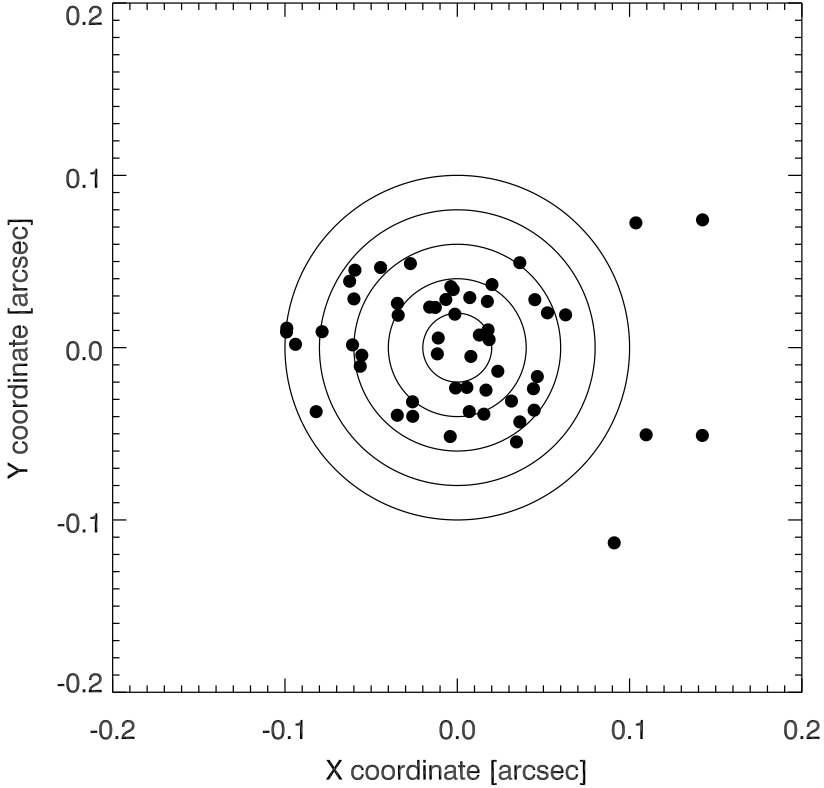
Comparing the difference in the positions of the stars on the WFC3 and WF/PC2 images as a function of and pixel number, shows that there is indeed a residual distortion in one (or both) of the images, with an amplitude of about 0.1′′ from edge to edge. The shear between both sets of images is clearly visible in Fig. 5. We fitted the difference in star position versus pixel number, separately for and , with a linear functions of pixel number ( and ) where the primed coordinates are the corrected ones. The best fit yielded ()=() and ()=(). The reliability of this transformation is limited by the intrinsic proper motion of the stars which is not known. The constants , indicate a small difference in pixel scale, which needs to be corrected: the fact that both axes yield the same factor within the uncertainties gives us confidence that this is valid. The , show a misalignment between the frames, largest in . We applied the and coefficients to the WFC3 image.
This correction improved the astrometric calibration, as demonstrated by the hatched histogram in Fig. 4. The mean scatter in stellar positions is now better than 0.05′′ (Fig. 6). This is probably dominated by the proper motions of the individual stars. The motion corresponds to about 25 km s-1 at a distance of 1 kpc which is of the order of the expected stellar velocity dispersion in the Galactic plane. The accuracy of the relative alignment between the two images, as measured from the error on the mean, is approximately 0.01 arcsec.
3.2 Proper motion measurements
3.2.1 Expected shifts
The expected level of proper motions can be estimated from the existing measurements of Meaburn et al. (2008). They detected proper motions in the northwestern lobe (see Fig 1), between 1 arcmin and 3 arcmin from the centre of the nebula. Their innermost measurement derives from a feature at 1.06 arcmin from the centre of the nebula, and revealed a proper motion (PM) of 29.5 mas/yr. At large distances, they find a linear increase of PM with distance.
The most distant features measured in this work extend up to about 1′ from the centre of the nebula, matching well with the innermost measurement of Meaburn et al. (2008) (albeit at opposite side of the nebula). The two epochs of HST imaging are separated by 10 years. Thus, we expect shifts up to 0.3′′ in the outer area of the HST images, down to 0.1′′ at 20′′ from the centre. The latter corresponds to 1 pixel, and is ten times larger than the alignment errors derived in the previous section.
3.2.2 Method
Direct evidence for proper motion of the structures in the nebula can be seen from difference imaging. This is shown in Fig. 7. The pattern shows clear motion of sharp-edged features, in most cases directed away from the centre of the nebula. In the display, we used the arctan of the differential intensity, to flatten the image. In reality, the amplitudes in the right part, close to the center, are much higher than on the left. The strong effect seen on the northern edge of the obscuring torus (top right) is not caused by a very large motion, but represents a braided structure with one chain brightening and the other fading. The intensity changes may be partly caused by the H emission in this region, which affects the two filters differently. The results below indicate that the gas flow in this region is along the linear feature.
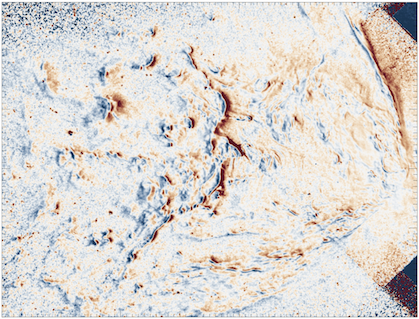
The proper motion cannot be directly measured from the difference image. In regions where there is a field star close to a nebular feature, the motion can be measured with respect to the reference star. In areas without such a reference point a more detailed comparison is required. The accuracy of the proper motion is limited by the fact that the nebular features are not point sources, but are extended. This introduces uncertainties which are much larger than the systemic error derived from stellar (point) sources.
The best measurement for the proper motion is obtained by shifting the two images and calculating the of the difference image. This technique works for extended emission features, as long as the region studied is sufficiently small that a linear shift provides a good approximation, whilst there is sufficient structure in the emission features within this region. We implemented this technique by considering the nebula as an array of adjoining square tiles. To ensure sufficient structure within the selected region, we chose to cut the nebula into a 23 19 grid of fairly large square tiles, 41 41 pixels in size (4.14.1′′) (437 tiles in total.)
To determine the shift for each tile, we employed the MPFIT IDL package (Markwardt, 2009). This finds the best matching model iteratively by means of minimization, with as parameters the shift in and (proper motion of the nebular features) and the scaling factor for the intensity. The scaling factor for the intensity accounts for the sensitivity difference between WF/PC2 and WFC3. For each step (each shift) in this procedure, the WFC3 image was interpolated to the pixel frame WFPC2 image, before the of the difference image was calculated. This interpolation required non-integer shifts, and was done using the IDL function INTERPOLATE.
The interpolation of the WFC3 image was always done using the entire WFC3 image. This avoids edge effects on the extracted squares. The difference image was obtained for the analysed tile only.
3.2.3 Uncertainties
To assess the intrinsic errors of this method, we artificially introduced a shift to the WF/PC2 image, and next used the same method on the original and shifted WF/PC2 images. The aim was to reproduce the shift. This measures both the intrinsic uncertainty in the calculation, and the reliability of each tile.
We used shifts of (2.0, 1.0, 0.8, 0.3) pixels in both directions, extracted the full set of tiles, and re-ran the analysis for each tile. For integer pixel shifts, the introduced shift was reproduced with accuracy close to the computational precision for single-precision numbers, with standard deviation of pixels. (The standard deviation excludes tiles where the calculated shift differed from the applied shift by more than 10%.)
Not all tiles produce consistent results. Large errors are found for tiles which lack nebular emission structure necessary for an accurate determination of the shift. We exclude tiles where the calculated shift was in error by more than 50% for all of the trial shifts. This removed all tiles without detected emission in the WF/PC2 image (the WFC3 image is deeper and shows emission in some tiles which are empty in WF/PC2). It also removed a few tiles in regions with smooth emission. It left 246 tiles.
Subsequently, we ran the full analysis on the WFC3 versus WF/PC2 image, extracting the determined shifts for the tiles identified in the previous step. A number of tiles were affected by field stars, which may move differently from the nebula. These tiles (a total of 46) were manually removed. We also removed tiles with very large shifts or where the shift measurements in one of the two axes had failed. The final sample of ’good’ tiles for proper motion measurements is 200.

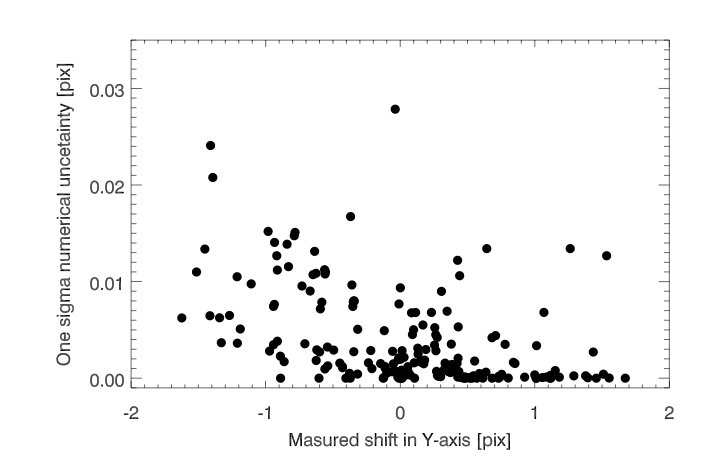
The MPFIT routine returns the measured shift, separately for and , and the error on these shifts determined from the minimization. Fig. 8 shows the reported 1- uncertainties as function of the factual measurements for both axes. The formal errors yield a typical S/N in excess of 100 for our observed shifts. Significant clustering is visible in the x-axis shifts, around the integer values. The measured values avoid the range between (,) and (,). There may also be an excess at 0. This appears to be a numerical artifact of the interpolation procedure, which is part of the core IDL package. This artifact must be taken into account during interpretation.
In the large majority of tiles, the uncertainty is less than 0.01 pixel, or 1 mas. The artifact discussed above amounts to errors of order 0.1 pixel, which over a 10 year time span is still only 1 mas/yr. This is likely to be the best achievable as the test was done under ’ideal’ circumstances of no change in emission apart from the motion. The real uncertainty is harder to quantify. However, the spread in observed proper motions for different tiles, as shown in Fig. 10, provides an indication for this. The spread amounts to an rms of 5 mas/yr, 5 times worse than derived from the numerical uncertainty. The spread does not seem to increase with distance from the centre, where the emission is fainter by two orders of magnitude. This indicates that we are not limited by S/N on the emission, but by the presence of nebular structures needed to detect proper motion.
3.2.4 Results
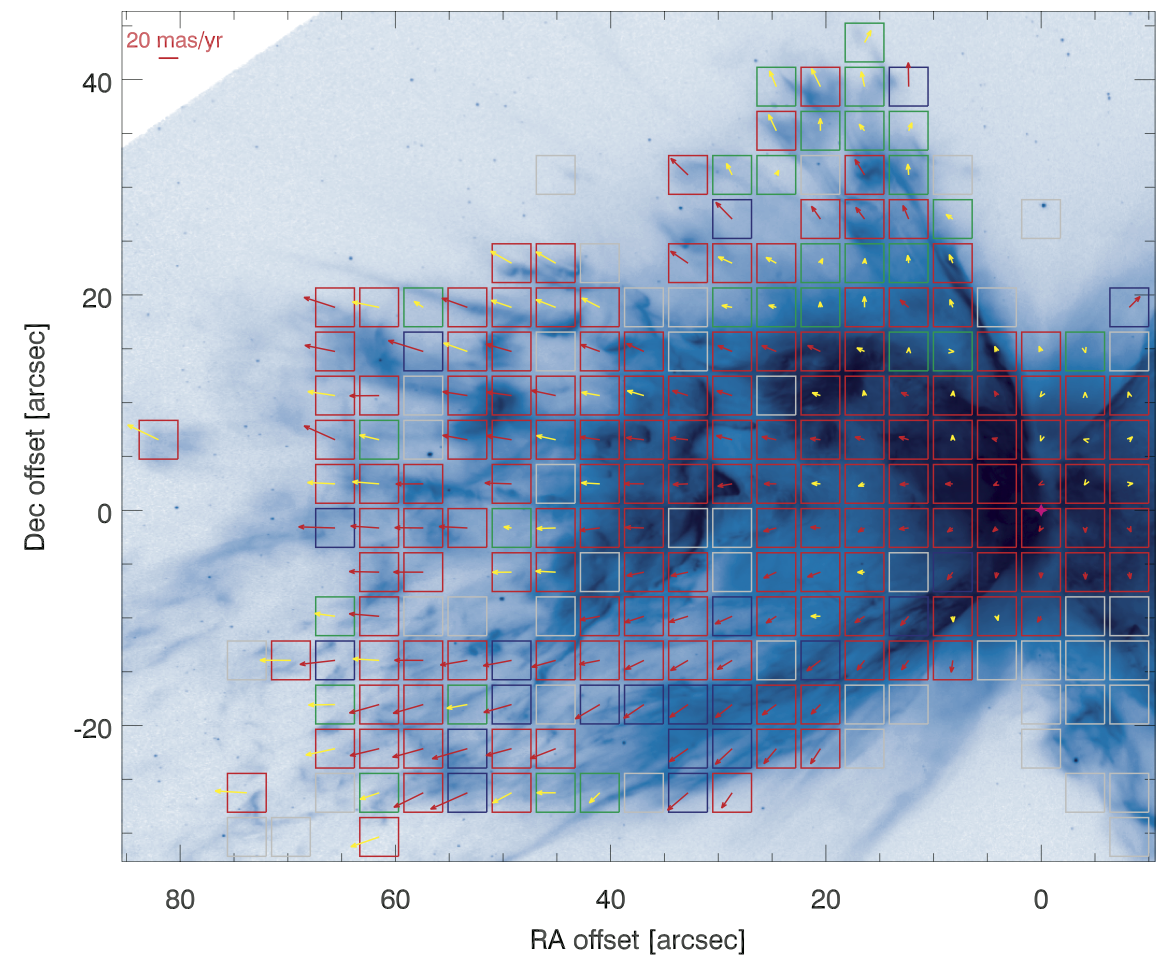
Fig. 9 shows the proper motion velocity field. The boxes show the squares which were classified as ’good’ by the automatic fitting routine on the test shifts. The arrows show the measured proper motion. If the box is empty, that specific measurement was flagged as ’bad’ manually, either because of the presence of a field star or because of lack of nebular structure. The yellow arrows indicate measurements where one of the axes returned a zero error; this may in cases be related to the numerical artifact listed above. The confidence in the direction of these vectors is reduced. All remaining vectors have good confidence. The length of each arrow is proportional to the proper motion. The bar at the bottom right shows a proper motion of 20 mas/yr (0.2 pixels over 10 years). The magenta symbol at the centre of the nebula shows the position of the central star from Szyszka et al. (2009).
A very regular velocity field emerges, largely radial from the location of the central star (Szyszka et al., 2009), at all distances from the star. The vectors are well aligned with the nebular structures, in particular the bright linear structures delineating the obscuring torus where the flow is along the structures. The shock-like structure embedded in the centre of the eastern lobe (from tile (37”, 15”) to tile (45”, -14”)) moves radially, at an angle to the front, however where such a structure develops a tail (e.g. tile (55”, 18”), the tail is along the flow direction. Such tails are seen especially in the outer regions, and appear to be a flow-driven phenomenon.
4 Discussion
4.1 Hubble flow
So called Hubble-like outflows (viz. recession velocity distance) have been found in a number of bipolar planetary nebulae (Corradi, 2004; Jones et al., 2010) and appear to be relatively common in such objects. In the case of NGC 6302, such a velocity law was first reported by Peretto et al. (2007), as a component in molecular CO lines close to the expanding torus: their Fig. 10 shows a clear linear dependence of velocity with distance. A Hubble flow in the lobes was reported by Meaburn et al. (2008), based on a tight correlation between proper motion of 15 individual knots and distance to the central star. In ’normal’ (non-bipolar) nebulae, the expansion velocity increases outward because of the overpressure of the ionized region (e.g. Gesicki et al., 2003). However, the linearly increasing Hubble flows are more likely related to short-lived ejection events (Huggins, 2007) or fast changes in outflow velocity (Zijlstra et al., 2001).
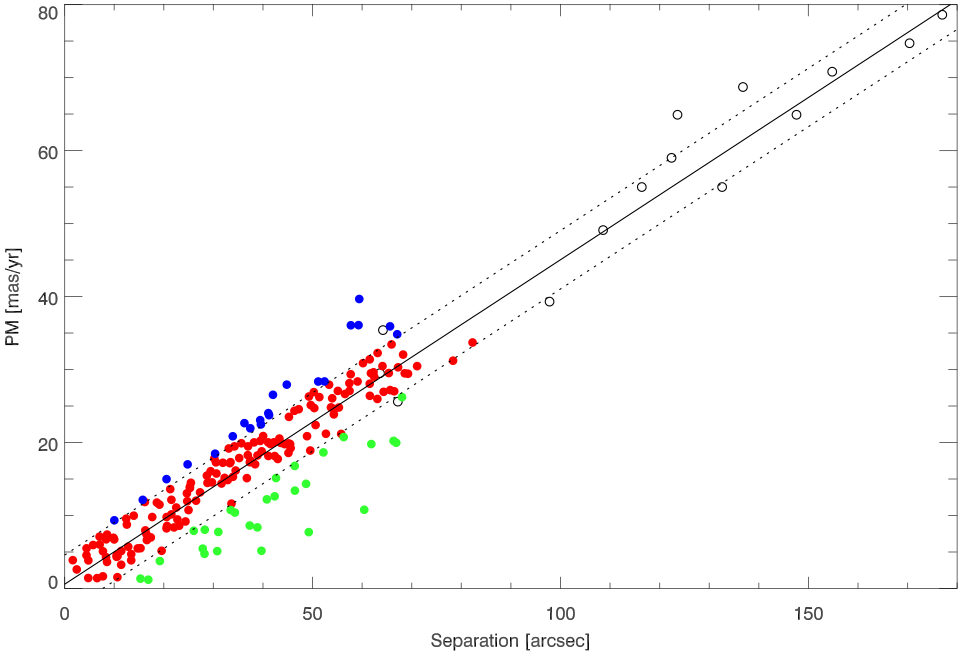
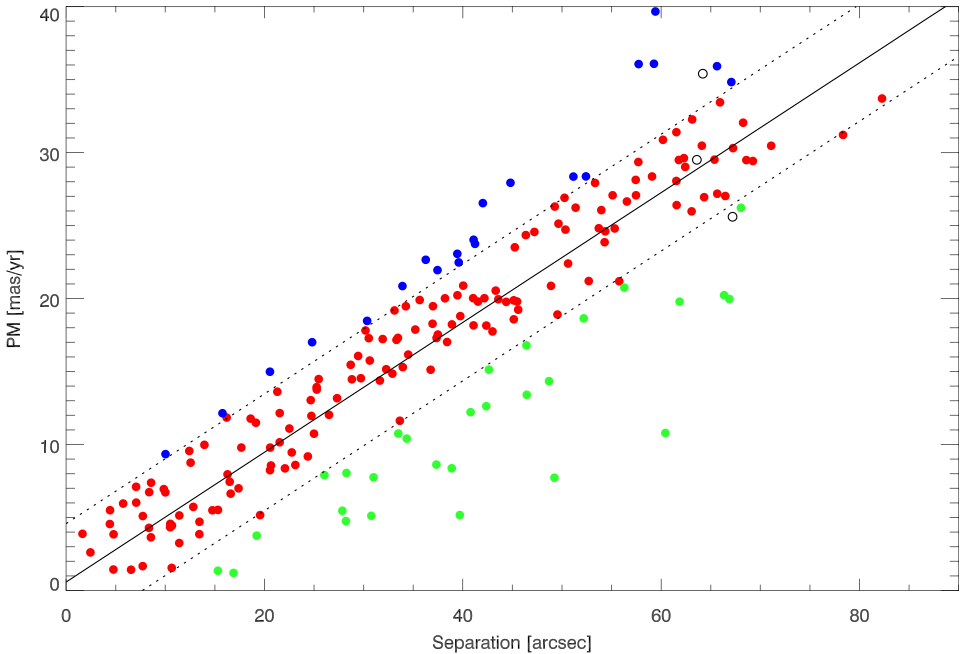
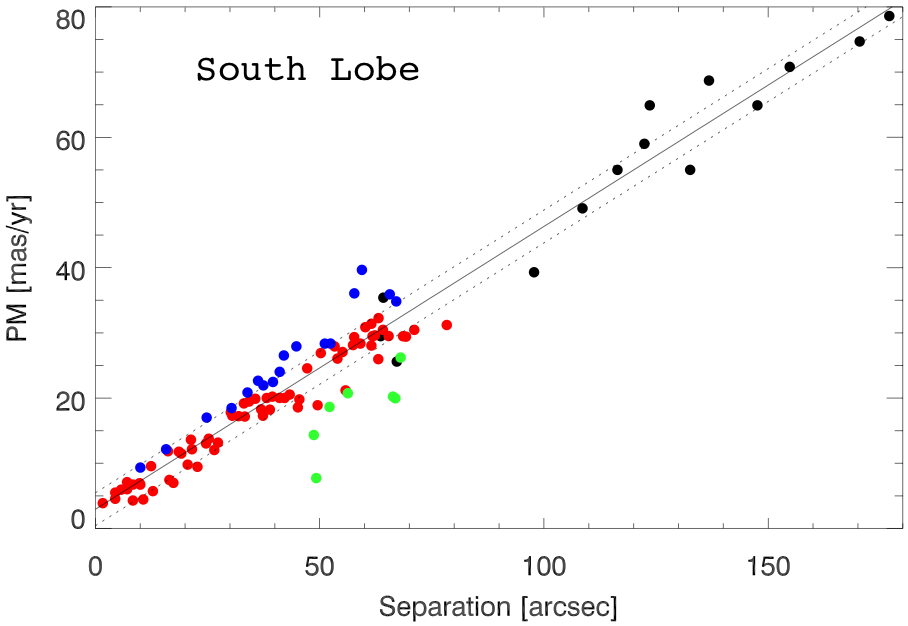
In Fig. 10, the dependence of the proper motion magnitude versus separation of the individual knot from the central source is plotted for our HST data (including all measurements presented in Fig. 9). We assume that the central star is the point source revealed by the imaging in the WFC3 F683N filter, at the position (Szyszka et al., 2009). The data points from Meaburn et al. (2008) are presented in this figure by open circles. We find that a linear relation provides an accurate representation of the results. The measurements of Meaburn et al. fall on the same line, in spite of being located on the oposite side of the nebula, and in most cases at much larger distances from the star. The HST points extend to 70” from the star, while the Meaburn knots range from 60” to 180”. Thus, both lobes have a common origin.
A linear fit is shown in Fig. 10. The parameters of this best fit, obtained from combining the HST and Meaburn et al. data (214 data points), is given by
| (1) |
where is the proper motion in mas/yr, and is the distance to the centre in arcsec. We quantified the spread of points about the fitted line by calculation of the standard deviation, which was . This quantity is indicated in the Fig. 10 by parallel dotted lines.
Fig. 10 shows a number of points falling somewhat below the fitted line. Fig. 9 shows the location of these vectors, encoded by the green boxes. Most of these vectors come from tiles with relatively smooth emission, or from tiles only containing linear features along the flow direction; all are low confidence points marked by yellow arrows. We conclude that ’green’ points can be safely omitted from the fit. Refitting the line excluding these lower points (186 points) yields:
| (2) |
The blue vectors show the points more than 1- above the fit. These are predominantly found in the lower right corner. Excluding also the higher points we retain 165 data points which result in fit:
| (3) |
The fit remains the same within the errors, but the spread is significantly reduced. Without the lower points, the spread is 2.9 mas/yr, which is a reasonable value for the measurement error on good squares.
As the HST and Meaburn data are well fitted by a single line, we conclude that the Hubble flow detected by Meaburn et al. (2008) extends to the innermost parts of the nebula.
Meaburn et al. (2005) find that the outer lobe is tilted with respect to the plane of the sky at an angle of 12.8o (77o to the line of sight). The current data does not restrict the angle of inclination for the inner lobe, as the measured proper motion versus distance is inclination independent. In published archival spectra (Meaburn & Walsh, 1980; Meaburn et al., 2005), an additional radial-velocity component is clearly visible in the inner regions attesting to the presence of multiple components that may not occupy the same range of inclination angles. Thus, it is likely that a broader range of inclination angles exists in the inner flow.
The Hubble like flow reported by Peretto et al. (2007) in molecular CO lines is detected in radial velocity, within the inner 20 arcsec. The increase of the radial velocity is 24 km/s over 15 arcsec, or 280 km s-1 pc-1, in the blue-shifted component. The Hubble flow reported in this work gives a tangential velocity gradient of 410 km s-1 pc-1. If these components trace the same outflow, the inclination to the line of sight is 56o. The redshifted CO component shows a minor Hubble flow with a similar gradient, indicating a similar inclination to the line of sight. This symmetry is consistent with Meaburn et al. (2005) finding that the lobes are oriented close to the plane of sky.
The velocity gradient of the Hubble flow derived from the tangential velocity, 410 km s-1 pc-1, gives the correct value, as both velocity and distance are projected by the same factor.
4.2 Age of the nebula
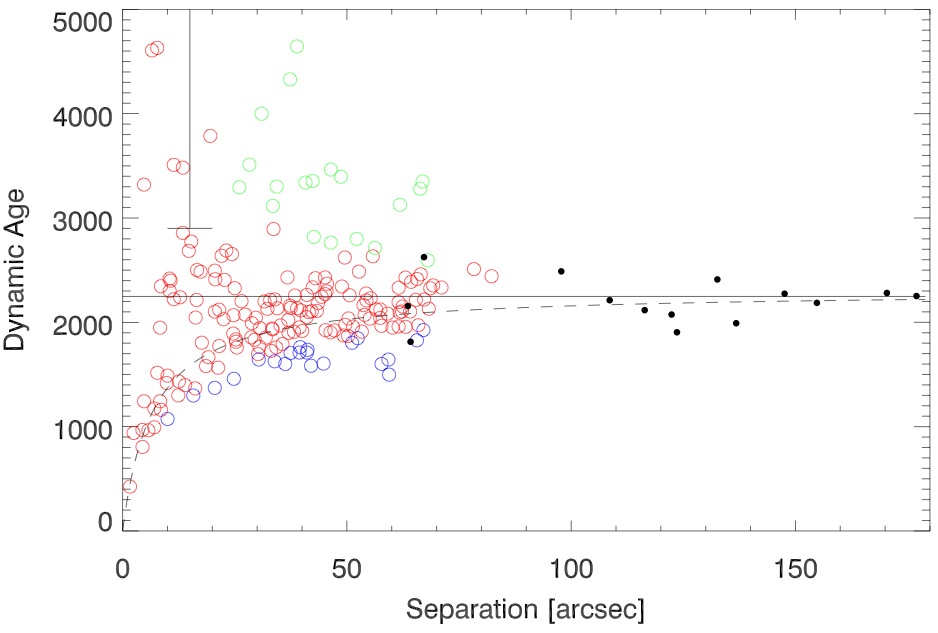
Meaburn et al. (2008) reported an age of 2200 yr. The global age of the nebula can be derived from the slope of the Hubble flow relation. In this work it varies between 0.44 and 0.45 mas yr-1 arcsec-1 (see Eq. (1)-(3)), which translates to an age of 2250 35 yr.
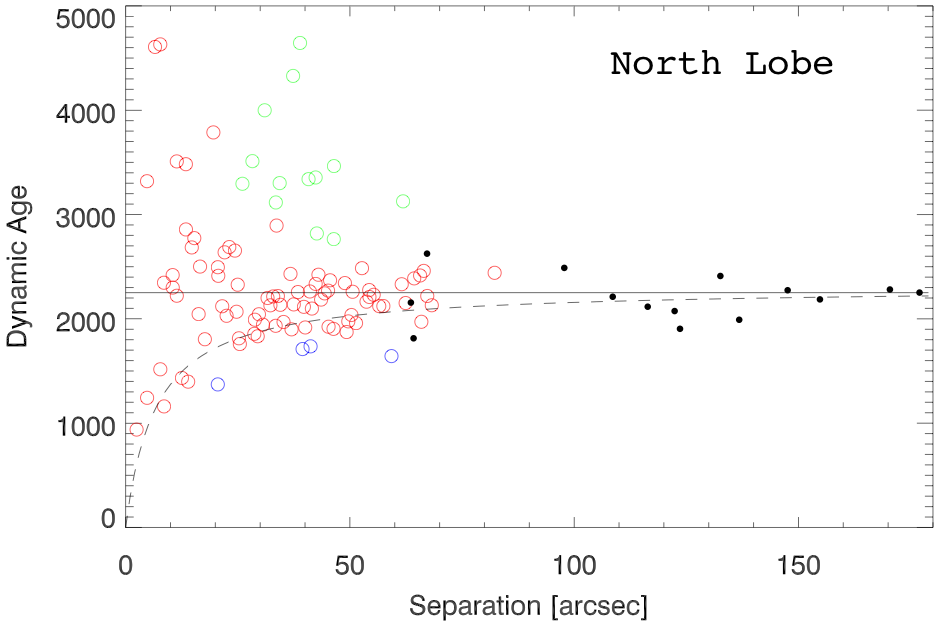
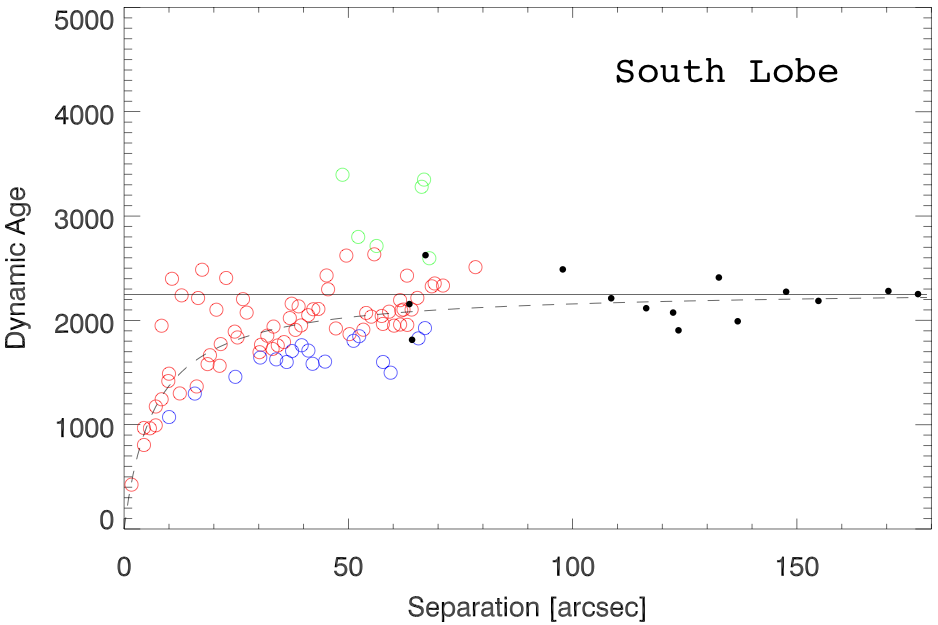
The large number of individual measurements allows us to study the age of the nebula in more detail. The separation of specific fragments of the nebula from the central star divided by their measured proper motion gives the dynamic age of this patch of the nebula. The distribution of these ages as function of distance from the star is plotted in Fig. 11. If all the nebular structures were ejected at the same time, and the velocity field remained unchanged since the ejection, the distribution in Figure 11 would be flat. This is not the case for NGC 6302. The scatter increases towards the central star, because of the large effect of measurement errors. However, allowing for this, there is a clear indication that the inner parts of the nebula appear dynamically younger than the outer parts.
To explain this phenomena, let us make the assumption that the nebula experienced an additional act of acceleration at some point during its evolution. If this occurred very recently (compared to the time of ejection of the AGB envelope), it will alter the nebular velocity field but not yet the position of each specific fragment of the nebula. This will reduce the apparent ages; the reduction will be largest in the inner part of the nebula where the pre-acceleration velocities were the smallest.
We model this by adding an extra velocity component
| (4) |
The modified age [yr] can be described by the formula
| (5) |
where [arcsec] is the separation from the central star, [mas/yr] the initial velocity and [mas/yr] represents the additional velocity component. The conversion factor [mas/arcsec] is needed for conservation of units. For small , the modified age becomes and is a constant function of separation. Eq. (5) can be also presented as a function
| (6) |
which has the same form as the linear fit to the PM data in Fig 10. Thus, the fitted parameters in Eq. (1)-(3) represent and .
The solid line in Fig. 11 shows this model for the fitted parameters of Eq. (1). Excluding the low-confidence points above the relation (the green points), as fitted in Eq. (2), gives the dashed line. The dashed line gives a derived age of the nebula slightly less than before, of 2240 yr.
The best fit reveals an acceleration that occurred in the planetary nebula phase and resulted in a velocity increase of . A similar effect was observed in Gesicki et al. (2003) where extra acceleration was needed at the inner edge of a nebula to explain the velocity broadening of profiles of high excitation ions.
The same kind of internal acceleration was reported by Peretto et al. (2007) in their figure 10. The Hubble flow derived from radial velocity CO observations at the offset 0 [arcsec] does not have a zero velocity. Instead the slope of Hubble flow relation starts at a velocity of km/s.
4.3 Nebula asymmetries
The consistency of the Hubble flow throughout the lobes indicates that the expansion is homologous, and effectively free-flow. As derived in subsection 4.2, there is some evidence for additional acceleration; although this affects the inner regions most, it may in fact be present throughout the nebula.
However, there appear to be some differences in kinematics between different regions. The tiles where the gas is moving faster than expected (the blue points in Fig. 10) are primarily located in the southern part of the nebula (the blue-edged tiles in Fig. 9).
To show this, we divided the tiles into two samples, depending on the offset in Fig. 9. The northern tiles are defined as those where the declination offset relative to the position of the central star and the southern tiles are those with offset < 0”. The apparent age () distribution for both samples is presented in Fig. 12. Very few tiles from the southern part of the nebula appear to be older than 2250 yr, compared to the northern tiles. The effect of the additional velocity component is also much clearer in the southern part of the lobe. The differences are seen mainly within 50 arcsec of the central star.
We fitted the Hubble-flow relation to the southern sub-sample of the nebula. We excluded points falling outside the 1- [mas/yr] upper and lower threshold of the distribution, n the same way it was done for Eq. (1)-(3). The re-fitted relation is
| (7) |
The fit is presented in Fig. 13. The parameter [mas/yr], expressed as the velocity in the plane of the sky equals . This is a bit higher than previously found for the whole nebula.
The nature of these velocity asymmetries is not well understood. In Fig. 9 we notice a cluster of short vectors predominantly along the northern edge of the eastern lobe. These represent the measurements with large dynamical ages ( 2700yr). In the southern section of the nebula we observe higher velocities, thus younger dynamical ages, at the same distance from the star. This cannot be due to a difference in inclination with the line of sight, as this projection effect disappears in the Hubble diagram. One possibility is that the northern region has undergone deceleration; another possibility is that the innermost southern region is younger. A plausible model for the development of multipolar nebulae is the warped disk model of Icke (2003), suggested to be applicable to NGC 6302 by Matsuura et al. (2005). In this model, the most elongated lobes develop only once the stellar wind breaks through the constraining disk. This happens after a significant time delay. It is noteworthy that the southern, younger vectors in NGC 6302 are found point-symmetrically to the most elongated north-western lobe Meaburn et al. (2005).
4.4 Centroid of PM measurements
With a sufficient number of PM vectors we can attempt to find the point of common origin of these velocities. Two methods were used to test whether the PM vectors converge in one point. The first is a propagation of each measurement back in time, conserving its direction. The time is derived from the distance to the assumed central position. Each vector gives a position at the same distance as assumed for the central star position. The second is a more novel technique called criss-cross mapping (Steffen et al., 2010), and relies solely on directions of vectors.
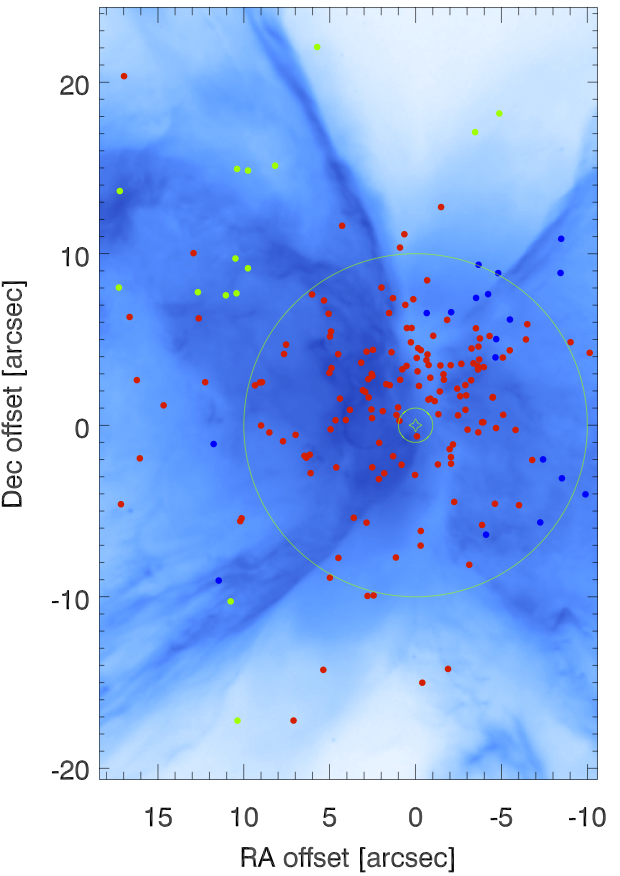
In the first approach we propagated the PM vector in the opposite direction to the measured motion. We assumed that the age [yr] for each specific fragment of the nebula at the distance [arcsec] can be described by Eq. (5) using parameters from the fit to the Hubble flow relation (see Eq. (2)). The derived age together with the PM vector defines the ’origin’ point of this specific part of the nebula. The result is presented in Fig. 14, with the same colouring conversion as in Fig. 10. The background is the optical image of the nebula. We can see that the convergence is rather poor. Out of 200 considered PM measurements, 155 fall within the circle of 10 arcsec from the central star. These are mostly (133) ’red’ points which follow the Hubble-flow relation reasonably well (see Fig. 10). We also find 11 ’blue’ origin points above this relation; notably, none of the ’green’ points was found within the 10” circle.
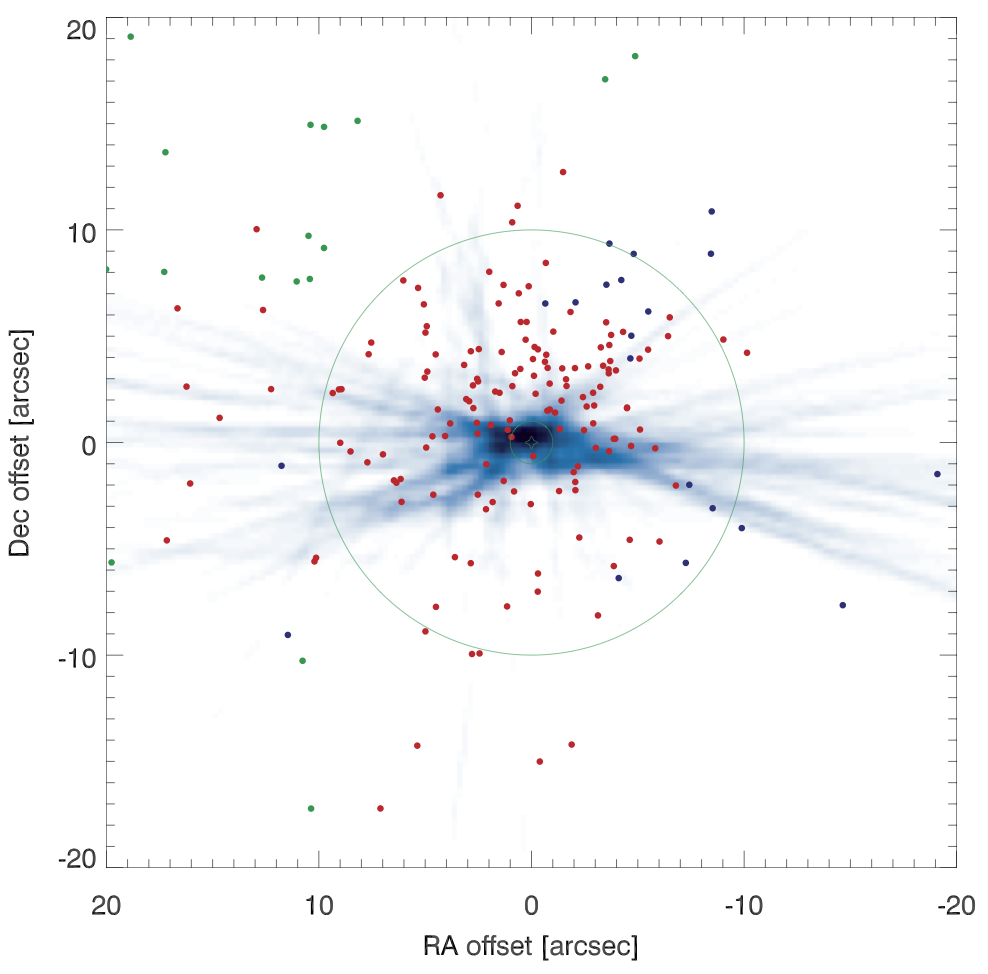
The criss-cross mapping is implemented in the modelling tool Shape (Steffen et al., 2010). In this technique we construct a map of crossing points between all the measurements, much like an intensity map. Each PM vector is represented as an infinite line, with some width. At the crossing point the number of lines is added up. The peak of the the number density map indicates the position where the largest number of PM vectors crossed each other.
The result of criss-cross calculation is presented in Fig. 15. The number density map is squared to highlight regions with the highest probability to be a centroid of the PM velocity field. The origin points from the previous method are over-plotted for reference. The convergence is very close to the central star position (the (0,0) offset on the map), with an offset of only 0.5” north. The criss-cross analysis provides support for the identification of the point source found by Szyszka et al. (2009) as a central star. The fact that most of PM vectors cross the position of the central star indicates that the velocity field is mostly radial.
The two methods show different results. The fact that for the first method, the PM vectors do not converge to a common origin point, we attribute to the variations in velocities due to the kinematic effects discussed above. The second method showed that a large number of the PM vectors indeed cross at the position of the central star. If we apply this result in the first method, we conclude that the age was underestimated (for the northern lobe) or overestimated (for the southern lobe).
4.5 The molecular torus and ionized centre
The nebula has a prominent high extinction torus (Matsuura et al., 2005). This torus is also detected in CO, is oriented N-S, extends from 5.5” to 12” (Peretto et al., 2007), and has an estimated dust mass of M⊙ and a total mass of 1 M⊙ (Matsuura et al., 2005). (Peretto et al. (2007) improved the torus mass estimation to 2 M M⊙. Dinh-V-Trung et al. (2008) however derive a much lower mass of 0.1 M⊙, based on almost identical data. This value is surprisingly low given the extremely high extinction (Matsuura et al., 2005), but it shows that the mass determinations remain uncertain.)
The molecular torus reported by Peretto et al. (2007) is centered at declination . The declination of the central star is , whilst the peak of the criss-cross map is about 0.5” North at . All these positions agree to within the uncertainties. The torus has an age of 2900 yr, based on its size and the expansion velocity of 8 km s-1, (Peretto et al., 2007).
The region inside of the molecular torus is not devoid of gas. There is an inner, ionized torus, located within the central few arcseconds(Gomez et al., 1989). This ionized torus is also expanding (Gomez et al., 1993), at a fractional growth rate of 8.36yr-1, which gives a dynamic age of 1200yr, making it much younger than any other part of the nebula. There are uncertainties in this measurement. The ionization front travels faster than the gas by as much as 40% and this can lead to overestimation of measured expansion rates of ionization-bounded nebulae, as found for the case of NGC 7027 by Zijlstra et al. (2008). (Gomez et al. (1993) apply their expansion to the inner radius, assuming a Hubble-type velocity field but this retains the uncertainty.) A second problem is that the velocity field in the ionized region can be altered by the overpressure caused by the ionization, leading to acceleration. The nature and evolution of the inner torus is not yet fully understood. The expansion of the inner torus appears to be in the same direction as the faster (younger) proper motion vectors measured by HST in the southeastern part of the nebula, and there may be a relation between these two regions.
The HST data do not allow us to study the expansion of the inner 4” of the nebula as this is approximately the size of the single tile which is 4.14.1′′. Because of the lack of clear features in this highly obscured region, we have also been unable to make an expansion map of the inner regions at higher spatial resolution.
4.6 Mass-loss history of NGC 6302
We find three separate components in NGC 6302: the lobes, expanding fast with a Hubble flow, the molecular torus, expanding slowly at , and the inner ionized torus. This raises the question whether these components date from separate mass-loss events, or have a common origin.
Peretto et al. (2007) derived the timing and duration of the mass loss event which lead to the formation of the torus. This event lasted 4600 yr, began 7500 years ago and finished 2900 years ago. Fig. 11 indicates the duration of this mass loss phase as a vertical bar. The present work estimates the age of the lobes to be 2240 yr. Thus, the lobes formed after the torus was ejected, and there appears to be a delay of yr between the ejection of the torus and lobes. The inner torus has a reported age of 1200 yr, but this needs confirmation.
Differences in time between the ejection of a torus and of a jet are known from other objects. Huggins (2007), based on a sample of 9 nebulae for which both times where available, found that there was a small delay of typically a few hundred years between torus and jets. For this time delay pattern he coined the term jet lag. The fact that this statistical effect is confirmed in this detailed study of the lobes and torus of NGC 6302 provides support for this mass-loss description.
Excluding the innermost torus, we find a mass-loss history for NGC 6302 consisting of a slow, dense, equatorial wind with mass-loss rates of , lasting for roughly 5000 yr, followed by a brief interlude, before a short-lived event caused the formation of the fast, bipolar lobes.
Assuming a lobe mass of (Dinh-V-Trung et al., 2008), the mass-loss rate of the rapid lobe ejection would seem to be extreme. However, it is more likely that this event accelerated gas previously ejected.
Peretto et al. (2007) argue that the momentum of the torus is almost an order of magnitude larger than that in the stellar radiation field. The lobes, moving much faster, having a few times less mass but having formed at least ten times faster, have a much higher ratio of momentum to that in the stellar radiation field over the time of the ejection. This suggests the late ejection was energy-driven, as has been suggested for other bipolar post-AGB stars (Bujarrabal et al., 2001).
Bujarrabal et al. (2001) suggest as one possibility that the fast outflows are driven by conversion of gravitational energy of re-accreted material into bipolar jet momentum. This model can also be proposed for NGC 6302. Peretto et al. (2007) suggest that the torus ejection was aided by a binary companion. In this case, the later fast flows could be powered by an accretion disk around the same binary companion.
5 Conclusions
The comparison of two HST F658N images allowed for measurement of the PM vector for 200 4.1”4.1” square tiles predominantly across the eastern lobe. The resultant velocity field is very regular and largely radial. We have shown that the Hubble-flow relation extends into the innermost parts of the nebula. The age of 2250 yr of the nebula agrees with the one derived for northwestern lobe by Meaburn et al. (2008). The inner parts of the nebula show evidence of additional acceleration which took place only in the recent history of the nebula. The additional velocity component is more clearly pronounced in the southern half of the lobe, than in the northern. We attribute this recent acceleration to overpressure after the onset of ionization.
The criss-cross mapping indicates that the PM velocity field points toward the central star reported by Szyszka et al. (2009). It also shows that the lobes and the torus have the same kinematic origin, close to the central star. The comparison of torus ejection time with lobe ejection time provide further evidence that these two events, although separated in time, are linked together.
The mass-loss history for NGC 6302 shows a phase of equatorial, slow mass loss at a high rate of , lasting about 5000 yr, and followed by an interlude of yr before the fast lobes formed during a short-lived, energetic event. We suggest that the lobes may have formed through an accretion disk around a companion to the central star.
acknowledgements
We would like to thank W. Steffen for his assistance preparing the criss-cross map. We also thank the anonymous referee whose careful reading of the manuscript lead to improvements of this paper. CS is grateful to the University of Manchester, School of Physics and Astronomy for a bursary.
This research made use of Montage, funded by the National Aeronautics and Space Administration’s Earth Science Technology Office, Computation Technologies Project, under Cooperative Agreement Number NCC5-626 between NASA and the California Institute of Technology. Montage is maintained by the NASA/IPAC Infrared Science Archive.
References
- Balick & Frank (2002) Balick B., Frank A., 2002, ARA&A, 40, 439
- Bujarrabal et al. (2001) Bujarrabal V., Castro-Carrizo A., Alcolea J., Sánchez Contreras C., 2001, A&A, 377, 868
- Corradi (2004) Corradi R. L. M., 2004, in M. Meixner, J. H. Kastner, B. Balick, & N. Soker ed., Asymmetrical Planetary Nebulae III: Winds, Structure and the Thunderbird Vol. 313 of Astronomical Society of the Pacific Conference Series, Multiple, Coeval and Hubble-Like Bipolar Outflows. pp 148–+
- Dinh-V-Trung et al. (2008) Dinh-V-Trung Bujarrabal V., Castro-Carrizo A., Lim J., Kwok S., 2008, ApJ, 673, 934
- Evans (1959) Evans D. S., 1959, MNRAS, 119, 150
- Gesicki et al. (2003) Gesicki K., Acker A., Zijlstra A. A., 2003, A&A, 400, 957
- Gomez et al. (1993) Gomez Y., Rodriguez L. F., Moran J. M., 1993, ApJ, 416, 620
- Gomez et al. (1989) Gomez Y., Rodriguez L. F., Moran J. M., Garay G., 1989, ApJ, 345, 862
- Guzmán et al. (2009) Guzmán L., Loinard L., Gómez Y., Morisset C., 2009, AJ, 138, 46
- Habing (1996) Habing H. J., 1996, A&ARv, 7, 97
- Hajian et al. (1993) Hajian A. R., Terzian Y., Bignell C., 1993, AJ, 106, 1965
- Huggins (2007) Huggins P. J., 2007, ApJ, 663, 342
- Icke (2003) Icke V., 2003, A&A, 405, L11
- Jones et al. (2010) Jones D., Lloyd M., Mitchell D. L., Pollacco D. L., O’Brien T. J., Vaytet N. M. H., 2010, MNRAS, 401, 405
- Lasker et al. (2008) Lasker B. M., Lattanzi M. G., McLean B. J., Bucciarelli B., Drimmel R., Garcia J., Greene G., Guglielmetti F., Hanley C., et al. X., 2008, AJ, 136, 735
- Markwardt (2009) Markwardt C. B., 2009, in D. A. Bohlender, D. Durand, & P. Dowler ed., Astronomical Society of the Pacific Conference Series Vol. 411 of Astronomical Society of the Pacific Conference Series, Non-linear Least-squares Fitting in IDL with MPFIT. pp 251–+
- Masson (1986) Masson C. R., 1986, ApJL, 302, L27
- Matsuura et al. (2005) Matsuura M., Zijlstra A. A., Molster F. J., Waters L. B. F. M., Nomura H., Sahai R., Hoare M. G., 2005, MNRAS, 359, 383
- Meaburn (1997) Meaburn J., 1997, MNRAS, 292, L11
- Meaburn et al. (2008) Meaburn J., Lloyd M., Vaytet N. M. H., López J. A., 2008, MNRAS, 385, 269
- Meaburn et al. (2005) Meaburn J., López J. A., Steffen W., Graham M. F., Holloway A. J., 2005, AJ, 130, 2303
- Meaburn & Walsh (1980) Meaburn J., Walsh J. R., 1980, MNRAS, 193, 631
- Palen et al. (2002) Palen S., Balick B., Hajian A. R., Terzian Y., Bond H. E., Panagia N., 2002, AJ, 123, 2666
- Peretto et al. (2007) Peretto N., Fuller G., Zijlstra A., Patel N., 2007, A&A, 473, 207
- Skrutskie et al. (2006) Skrutskie M. F., Cutri R. M., Stiening R., Weinberg M. D., Schneider S., Carpenter J. M., Beichman C., Capps R., Chester T., et al. X., 2006, AJ, 131, 1163
- Steffen et al. (2010) Steffen W., Koning N., Wenger S., Morisset C., Magnor M., 2010, ArXiv e-prints
- Steffen et al. (2010) Steffen W., Tamayo F., Koning N., 2010, ArXiv e-prints
- Szyszka et al. (2009) Szyszka C., Walsh J. R., Zijlstra A. A., Tsamis Y. G., 2009, ApJL, 707, L32
- Tsamis et al. (2003) Tsamis Y. G., Barlow M. J., Liu X., Danziger I. J., Storey P. J., 2003, MNRAS, 345, 186
- Zijlstra et al. (2001) Zijlstra A. A., Chapman J. M., te Lintel Hekkert P., Likkel L., Comeron F., Norris R. P., Molster F. J., Cohen R. J., 2001, MNRAS, 322, 280
- Zijlstra et al. (2008) Zijlstra A. A., van Hoof P. A. M., Perley R. A., 2008, ApJ, 681, 1296