The non-uniform, dynamic atmosphere of Betelgeuse observed at mid-infrared wavelengths
Abstract
We present an interferometric study of the continuum surface of the red supergiant star Betelgeuse at 11.15 m wavelength, using data obtained with the Berkeley Infrared Spatial Interferometer each year between 2006 and 2010. These data allow an investigation of an optically thick layer within 1.4 stellar radii of the photosphere. The layer has an optical depth of 1 at 11.15 m, and varies in temperature between 1900 K and 2800 K and in outer radius between 1.16 and 1.36 stellar radii. Electron-hydrogen atom collisions contribute significantly to the opacity of the layer. The layer has a non-uniform intensity distribution that changes between observing epochs. These results indicate that large-scale surface convective activity strongly influences the dynamics of the inner atmosphere of Betelgeuse, and mass-loss processes.
Subject headings:
infrared: stars — stars: individual (Betelgeuse) — circumstellar matter — stars: mass-loss — techniques: interferometric1. Introduction
Mass-loss from massive stars in the red supergiant phase is fundamental to the chemical enrichment of the interstellar medium (Gehrz, 1989). Red supergiants, with initial masses of 1050, are known to lose mass at rates of up to 10/yr (Humphreys, 1986). Mass-loss rates are commonly estimated indirectly, using observations of infrared continuum excesses (e.g., Stencel et al., 1989) or measurements of CO rotational line intensities (e.g., de Beck et al., 2010). Outflowing material is also directly surveyed through observations of systematic spectral line displacements (Adams & MacCormack, 1935) and interferometric studies over multiple epochs (Bester et al., 1996). The physical processes involved in red supergiant mass-loss are however not well understood. While mass-loss from less massive stars, such as AGB stars, is understood in terms of significant radial pulsations and winds driven by radiation pressure on dust grains, such mechanisms are not applicable to red supergiants (Josselin & Plez, 2007), except those in a superwind phase (Yoon & Cantiello, 2010). Rotation in stars that are spun-up as they condense from protostellar clouds could play a role in driving mass-loss (Heger & Langer, 1998), as could Alfvèn and acoustic waves (e.g., Hartmann & MacGregor, 1980). In the case of Betelgeuse ( Orionis, spectral type M2Iab), the elevation of cool photospheric gas (Lim et al., 1998) and gas at chromospheric temperatures (Gilliland & Dupree, 1996) has been attributed to large-scale surface convective activity (Schwarzschild, 1975; Antia et al., 1984).
Betelgeuse is perhaps the archetypal red supergiant. Its large angular diameter (0.047″, Michelson & Pease, 1921) and high apparent magnitude () make it an excellent subject for high spatial resolution studies. The continuum angular diameter of Betelgeuse has been measured using interferometric techniques at radio (Lim et al., 1998), mid-IR (812 m, Weiner et al., 2003a; Perrin et al., 2007), near-IR (e.g., Perrin et al., 2004; Haubois et al., 2009), optical (e.g., Michelson & Pease, 1921; Bonneau & Labeyrie, 1973; Buscher et al., 1990) and ultraviolet (Gilliland & Dupree, 1996) wavelengths, and significant variation of the diameter with wavelength is observed. The apparent mid-IR diameter is also observed to vary significantly on timescales of years (Townes et al., 2009). Numerous interferometric campaigns, from optical to mid-IR wavelengths, have further revealed up to three hotspots on the stellar surface (e.g., Buscher et al., 1990; Young et al., 2000; Haubois et al., 2009; Tatebe et al., 2007). These spots range in intensity from a few to a few tens of percent of the intensity of the stellar disk. The detection of these spots is generally interpreted as direct evidence for the presence of a few giant convection cells on the stellar surface (e.g., Chiavassa et al., 2010).
A profusion of circumstellar components have been identified surrounding Betelgeuse. Furthest from the star, an analysis of mid-IR spectra and interferometric data by Danchi et al. (1994) showed the presence of two thin shells of dust at approximately 40 and 80 stellar radii (), with temperatures of 400 K and 200 K respectively. Later work by Bester et al. (1996) revealed a third, more compact dust shell at 4 that was not apparent in previous data. The dust condensation zone and acceleration mechanism are not identified. Radio continuum observations by Lim et al. (1998) at wavelengths between 0.7 cm and 6 cm, probing spatial scales of , revealed the presence of neutral gas at temperatures between 3500 K and 1300 K. These temperatures are consistent with the temperature profile of the Betelgeuse atmosphere in these regions, as derived from mean temperature and density models (Harper et al., 2001, 2009). At , the gas distribution is asymmetric, indicating an anisotropic mechanism for elevating the gas above the photosphere. Ultraviolet (Gilliland & Dupree, 1996) and H (Hebden et al., 1987) imaging observations have shown that this cool gas co-exists with asymmetrically-distributed hot chromospheric material. Observations of [Fe II] lines by Harper et al. (2009) that correspond to the dominant cool atmospheric component showed, surprisingly, that this material was at rest with respect to the star. The circumstellar envelope as viewed across the JHK wavelength bands was imaged using a ‘lucky-imaging’ approach combined with adaptive optics by Kervella et al. (2009), and was found to include a plume extending to 6.
Closer to the star, strong evidence exists for the presence of a cool molecular layer or shell directly above the photosphere within (e.g. Ohnaka, 2004; Perrin et al., 2007). This layer is optically thick at mid-IR wavelengths but is optically thin in the near-IR. Spectral signatures of water from Betelgeuse and the red supergiant Cephei, found using data from the Infrared Space Observatory (ISO), were interpreted by Tsuji (2000a, b) as originating from a 1500 K layer surrounding these stars. Modeling of near- and mid-IR interferometric data by Perrin et al. (2004) confirmed the presence of such a layer, with a mid-IR optical depth of 2 and a temperature of 2000 K. Further work by Tsuji (2006) combining both interferometric and spectroscopic data placed the layer surrounding Betelgeuse at beyond , with a temperature of 2250 K. The layer was shown not to be solely composed of water by Verhoelst et al. (2006), who suggested the presence of amorphous alumina (Al2O3) to explain the high mid-IR opacity. The spectrum of water lines from Betelgeuse is indeed more complex than revealed by the ISO data; signatures of water at photospheric temperatures were detected by Jennings & Sada (1998) and Ryde et al. (2006). Most recently, wide-band, spectrally dispersed mid-IR interferometric observations by Perrin et al. (2007) were fitted by a layer containing SiO, amorphous alumina and water. High resolution measurements of the CO overtone band near 2.3 m (Ohnaka et al., 2009) and one-dimensional imaging (Ohnaka et al., 2011) were modeled with a large patch of gas near with motions of 1015 km s-1 with respect to the star. This emerging model of a photosphere and overlying layer for a selection of red supergiant stars allows a better understanding of dust formation and red supergiant wind acceleration (e.g. Verhoelst et al., 2009), leading towards a convergent picture of red supergiant mass loss.
Studies of the extended Betelgeuse atmosphere form a basis for a better understanding of the atmospheric dynamics of red supergiant stars. The existence of a cool layer with high opacity at mid-IR wavelengths directly above the photosphere is now established for Betelgeuse. The size, temperature and composition of the layer have been investigated, assuming spherical symmetry. Little, however, is known about the spatial structure and time-variability of this layer. Consistent instrumentation and modeling procedures have also not been applied over multiple observation epochs. In this paper, we present observations of the mid-IR continuum of Betelgeuse using the Berkeley Infrared Spatial Interferometer (ISI, Hale et al., 2000). Interferometric data using three telescopes were gathered during each year between 2006 and 2010, with angular resolutions sufficient to model the stellar shape and potential large-scale features. We describe the observations and image-modeling processes in §2, and perform fits to a photosphere-and-layer model for our observations in §3. In §4, we discuss the nature of the observed non-uniformities in our model images. We examine the implications of our results for models of the Betelgeuse atmosphere and red supergiant mass-loss in §5, and present our conclusions in §6.
2. ISI observations of Betelgeuse
2.1. Observational methods
The ISI consists of three 1.65 m aperture telescopes with a heterodyne detection system at each telescope. The double-sideband detection systems are sensitive to m radiation within single sideband widths of 2.7 GHz. The 13CO2 laser local oscillators can operate at numerous wavelengths corresponding to vibrational molecular transitions between wavelengths of 9 m and 12 m. For the observations reported here, the local oscillators at each telescope were tuned to a wavelength of 11.15 m, chosen so as to exclude strong stellar and telluric spectral lines from the detection band (Weiner et al., 2003b).
| Year | Dates (UT) | 11.15 m flux density (103 Jy) |
|---|---|---|
| 2006 | 8, 9, 10 Nov; 7 Dec | 4.20.2 |
| 2007 | 14, 15, 16 Nov | 4.10.3 |
| 2008 | 22, 23, 24 Sep | 3.80.5 |
| 2009 | 4, 5, 7, 9, 18, 20, 22 Nov | 4.40.1 |
| 2010 | 5, 17, 18 Nov; 9, 13 Dec | 4.90.3 |
The van Cittert-Zernicke theorem equates the complex cross-correlation of the electric fields detected at two spatially-separated telescopes with the two-dimensional Fourier transform of the source brightness distribution within the telescope fields of view. Instead of measuring complex cross-correlations, the ISI, like all optical/IR interferometers, measures the normalized cross-correlation amplitude, known as the Michelson fringe visibility. The Michelson fringe visibility, , is given by
| (1) |
where the fringe power, is the cross-correlation amplitude between signals measured at two telescopes, and , and and are the source powers measured at telescopes and respectively. Visibility amplitudes are recorded for each ISI telescope baseline pair. The visibility phase in the mid-IR for a given baseline is, however, strongly affected by randomly varying atmospheric pathlengths above each telescope, and cannot be recovered from the data. The ISI instead measures the closure phase, or the sum of the measured visibility phases for each baseline. The closure phase is independent of optical pathlength differences between pairs of telescopes (Jennison, 1958) and it provides information about the point-inversion symmetry of the source. The spatial frequency sampled by the projection of a baseline of length , perpendicular to the direction of a source, at a wavelength , is proportional to . By obtaining measurements at different source hour-angles, multiple spatial frequencies at different position angles are sampled.
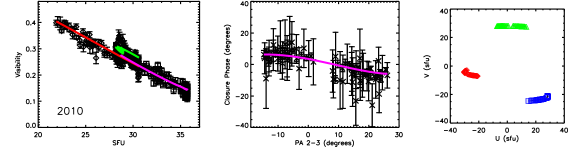
Visibility and closure phase data were recorded for Betelgeuse over timespans of five weeks or less each year between 2006 and 2010 (see Table 1). During this time period, the three ISI telescopes were configured in an approximately equilateral triangle with baseline lengths between 34 m and 40 m. For Betelgeuse, this configuration allows spatial frequencies between 20 and 37 SFU (Spatial Frequency Unit; 1 SFU cycles radian-1) to be sampled. For all observations, tip-tilt corrections were applied to center the source on K-band guider cameras operating at frame rates of 27 Hz. A standard observing sequence consisted of 4.5-minute dataset intervals of staring at the source and position-switching between the source and blank fields on either side of the source. The position-switching measurements moved the telescopes between the source and the sky every 15 s. The source powers were measured using additional 140 Hz chopping between the source, or the sky, and cold loads with temperatures near that of the sky. A single visibility measurement consisted of either: (1) a fringe power measured during a chopping/position-switching dataset, normalized using the source powers during that dataset; or (2) a fringe power measured during a staring dataset, normalized by weighted averages of source powers measured during the nearest chopping/position-switching datasets. Closure phases were calculated for each triplet of visibility measurements.
Visibility magnitudes and closure phase zero-point offsets were calibrated using observations of Aldebaran ( Taurus) conducted on the same night. Aldebaran was assumed to have a diameter of 20 mas and zero closure phase. The visibility calibrations for the two kinds of visibility measurements were different because of the different times spent on-source during chopping and staring datasets. Data that were affected by systematic errors or poor atmospheric conditions were discarded. The total flux densities of Betelgeuse during each observing epoch were also estimated using Aldebaran, assumed to have a flux density at 11.15 m of 615 Jy (Monnier et al., 1998), as a calibrator. These total flux density values are given in Table 1, and represent the total power of Betelgeuse within the 5″5″ fields of view of the ISI detectors.
2.2. Image modeling
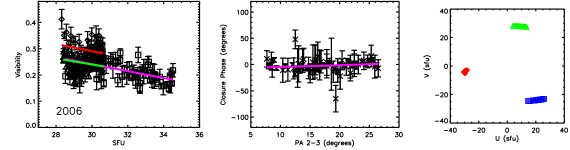
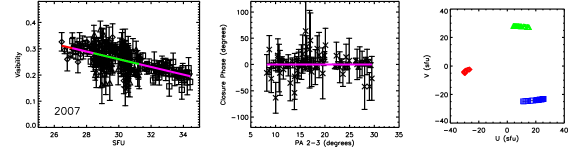
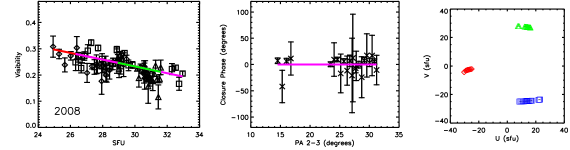
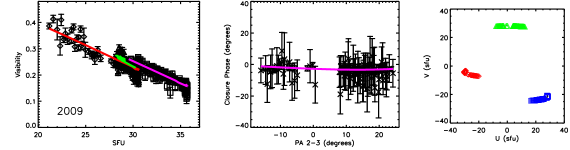
Image models were fitted to the calibrated visibility and closure phase datasets for each epoch. The data, analytic fits, and coverage of the spatial frequency plane, are shown in Figure 1. Effective model-independent image reconstruction was not possible because of the sparsity of the coverage in all epochs. Our model images include a centered uniform disk (UD), and up to two point sources offset from the image centers. The uniform disks represent the apparent stellar surface, and the point sources represent localised intensity fluctuations in this surface. Emission from the dust surrounding the star at large angular scales, while contributing to the total detected intensity, was assumed not to contribute to the visibility at the sampled spatial frequencies. The intensity of each image component was fitted to a fraction of the total intensity. Other free parameters included the UD radius and the positions of the point sources. The model complex visibility at a point in the plane was given by
where is the fraction of the total intensity contributed by the UD, is the uniform disk angular radius, denotes a Bessel function of the first kind and of order unity, represents the fractions of the total intensity of the point sources, and and represent angular offsets to the West and North for the point sources, with .
| Year | UD fraction | UD radius | Point source fraction | Pt src (mas) | Pt src (mas) | Reduced |
|---|---|---|---|---|---|---|
| 2006 | 0.510.02 | 24.50.8 | 0.040.01 | -2.40.1 | -23.70.2 | 2.683 |
| 2007 | 0.540.01 | 24.80.3 | - | - | - | 2.053 |
| 2008 | 0.480.02 | 24.70.8 | - | - | - | 2.416 |
| 2009 | 0.5570.008 | 26.40.2 | 0.0090.001 | -25.00.3 | 10.50.2 | 4.565 |
| 0.0070.001 | 18.30.3 | -20.20.2 | ||||
| 2010 | 0.610.03 | 26.40.3 | 0.0250.009 | -29.70.3 | -9.30.1 | 3.65 |
| 0.0090.004 | 8.30.3 | -25.90.1 |
We used a weighted least-squares fitting technique for each epoch, with each baseline and the closure phase data given equal weights. The differing quality of data from different epochs necessitated using models with different numbers of free parameters to fit different epochs. Data from 2006 were fitted with a single point source in addition to a UD, data from 2007 and 2008 were only fitted with UDs, and data from 2009 and 2010 were each fitted with a UD and two point sources. An additional point source was added to the fit for a given epoch only if the reduced values calculated for the full dataset, and for the closure phase data alone, were both decreased upon the addition of the point source. We also attempted to fit other image models. These included uniform ellipses, uniform ellipses with point sources, and UDs with offset uniform disks or offset two-dimensional Gaussian profiles in place of the point sources. None of these trials, however, converged to a satisfactory image, and the angular sizes of the fitted point sources are not determined. The fractions of the total intensity contributed by the point sources were not constrained to be positive, as our data are sensitive to both bright and dark features on the stellar disk.
Simulations were conducted to assess possible degeneracies in fitted image model parameters given the sparsity of the coverage of our datasets, in order to ensure that our data were not being over-fitted. No significant degeneracies were found for any epoch. For example, the 2006, 2009, and 2010 datasets constrain both the locations and brightnesses of the point sources. Closure phase measurements at multiple array position angles constrain the position angles of the point sources, and both the closure phase measurements and the visibility measurements constrain the angular offsets of the point sources from the image centers.
The results of the fits, as well as the reduced for each epoch, are given in Table 2. All the fits have reduced values that are greater than unity. This implies that the data contain minor features besides Gaussian noise that are not being fitted by the free parameters of the image models.
ISI data for Betelgeuse obtained during 2006 were also analyzed by Tatebe et al. (2007). Despite our choice of different observing dates, a different method of calibration and slightly different image fitting procedures, our results match those of Tatebe et al. (2007) within the margins of error. We however do not adopt Tatebe et al.’s results for the 2006 epoch in order to maintain the same analysis procedure across all epochs.
2.3. The changing angular diameter of Betelgeuse

Using ISI observations over the period 19932009, Townes et al. (2009) reported a systematic decrease of 15% in the mid-IR continuum UD diameter of Betelgeuse. Here, we augment this finding with new measurements of the UD diameter of Betelgeuse. Figure 2 shows the data plotted in Figure 1 of Townes et al. (2009), with the new results also included. Though the present work re-analyzes some previous observations examined by Tatebe et al. (2007), the diameter measurements are obtained from different data sets and analyses from those reported by Townes et al. (2009). The measurement of the UD diameter of Betelgeuse at 11.15 m by Perrin et al. (2007), obtained using the Very Large Telescope Interferometer in 2003, is also plotted. Recently, Ohnaka et al. (2011) showed that K-band diameter measurements, made over a similar time period, vary less than the mid-IR diameters plotted in Figure 2.
While our results from 20062008 are consistent to within the margins of error with the trend towards a smaller size (Townes et al., 2009), the UD diameters of Betelgeuse in 2009 and 2010 are significantly larger than those during 20062008. Our analysis method for the 2007 and 2008 datasets essentially matched that of Townes et al. (2009), in that only UDs were fitted to the data. Our technique however differed somewhat in the methods of calibration and fitting. We consider the variability in the apparent size of Betelgeuse in the mid-IR further in §5.2.
3. A photosphere-and-layer model for Betelgeuse
3.1. The effective temperature

Effective temperatures of stellar surfaces are among the fundamental parameters of stars (van Belle et al., 2010). The ISI measurements of the flux density of Betelgeuse, and of the UD sizes and fractions of the total intensity, allow the effective temperature of the 11.15 m apparent stellar surface to be determined at each observing epoch. We use a Planck function for the power emitted by a blackbody to express the effective temperature, , as
| (2) |
where is Planck’s constant, is the observing frequency, is Boltzmann’s constant, is the solid angle subtended by the stellar disk, is the vacuum speed of light, and is the measured power from the stellar disk in units of W m-2 Hz-1. We do not use the widely-applied technique of calculating effective temperatures using estimates for the bolometric flux from the star (e.g., Perrin et al., 2004; Boyajian et al., 2009) for two reasons: radiation at mid-IR wavelengths is strongly affected by thermal emission from circumstellar dust shells and bolometric correction factors at these wavelengths are unique to individual stars; and also because the correspondance between the 11.15 m scattering surface and the photosphere of Betelgeuse is not certain.
The calculated effective temperatures for the observed stellar disk of Betelgeuse during each observing epoch are plotted in Figure 3. We do not account for attenuation by the interstellar medium, estimated as modifying the observed flux density by a factor of 0.975 (Bester et al., 1996). We also do not account for absorption of the stellar radiation by the dust that surrounds Betelgeuse at angular scales of 1″ or larger, or for the emission from this dust in the line of sight to the stellar face. This is because the dust shells are extremely optically thin at mid-IR wavelengths when viewed radially, with a total line-of-sight optical depth of approximately 0.0065 (Danchi et al., 1994).
Our measured effective temperatures of the mid-IR surface of Betelgeuse are consistently lower than the value of 3641 K derived by Perrin et al. (2004) for the photospheric component of a photosphere-and-layer model. Furthermore, significant variability is evident between the effective temperatures measured at different epochs. We therefore consider sources of mid-IR continuum opacity in the atmosphere of Betelgeuse in an attempt to elucidate the scattering surface probed by our observations and the cause of the observed variability.
3.2. The 11.15 m scattering surface of Betelgeuse
Stellar atmospheres have opacities that vary with wavelength. Stars appear smaller at wavelengths where the atmospheric opacity is smaller. The surface of a star, when observed at a given wavelength, can be approximated as the location where the optical depth at that wavelength, measured from the observer, is approximately unity. The photosphere of a star, however, is the apparent stellar surface observed at a wavelength where the opacity matches the Rosseland mean opacity (Rosseland, 1924). The Rosseland mean opacity, , is given by
| (3) |
where is the intensity of radiation from a point in a stellar atmosphere, is the temperature at that point, and is the opacity at a frequency . Regions of a stellar spectrum with large radiation intensity but low opacity contribute most to determining the Rosseland mean opacity. Weiner et al. (2003a) concluded that the mid-IR continuum opacity of a gas with solar atomic abundances under surface conditions present on red giant stars closely matches the Rosseland mean opacity of such a gas.
Molecular layers surrounding red giant stars have, however, been shown to significantly change the mid-IR opacity from that of a solar abundance atomic gas, while remaining relatively transparent in shorter wavelength IR bands (Weiner, 2004; Perrin et al., 2004; Verhoelst et al., 2006; Woodruff et al., 2009). The Perrin et al. (2004) model for Betelgeuse, combining -band visibility data and a 11.15 m ISI visibility curve (Weiner et al., 2000), includes a shell with a -band optical depth of 0.06 and a 11.15 m optical depth of 2.33. Perrin et al. (2007) showed that this shell was composed of water, amorphous alumina dust and SiO gas, and that the 11.15 m opacity was dominated by alumina. The presence of alumina in a layer surrounding Betelgeuse, within 1.5, was suggested by Verhoelst et al. (2006) as the only dust species that could condense at the temperatures present in this region. Alumina dust grains forming close to stars possibly play a role as nucleation sites for dust species that condense at lower temperatures (e.g. Salpeter, 1977).
Bremsstrahlung interactions between electrons and neutral hydrogen atoms also contribute to the mid-IR continuum opacity in red giant stars (Tatebe & Townes, 2006). This emission mechanism was adduced by Reid & Menten (1997) to explain the variation with wavelength of the apparent sizes of the radio photospheres of long-period variables, and ascribed to Betelgeuse by Lim et al. (1998). We discuss this opacity model further in §3.4.
3.3. Fits to a photosphere-and-layer model
Prior work, the dramatic variations in apparent mid-IR diameters of Betelgeuse, and the low effective temperatures all provide clear motivation to model the new ISI observational results in terms of a photosphere and a molecular layer. Our method is similar to that of Perrin et al. (2007) in that we modeled a spherically symmetric layer surrounding an opaque stellar photosphere with an assumed diameter of 0.04371″ and an assumed surface temperature of 3641 K (Perrin et al., 2004). Visibility and closure phase models for any observed point sources were subtracted from the data during each observation epoch in order to allow the model to be spherically symmetric. We did not attempt to fit an asymmetric layer because of the large number of free parameters involved. The free parameters of our model were: the temperature, , of the layer; the optical depth, , of the layer along the line of sight to the center of the star; and, the outer radius, , of the layer.
The layer was assumed to have uniform temperature and opacity, and was also assumed to have an inner radius that corresponds to the photospheric radius. Radiation within the ISI band was assumed to arise only from blackbody emission by the layer.
The modeling procedure involved fitting visibilities derived from a model image, created using a
trial set of free parameters, to the measured visibilities. The measured visibilities for each epoch,
and their errors, were scaled by the measurements of the measured power emitted by the UD surface of
Betelgeuse. The flux density of a pixel in the model image grid was calculated as:
for ,
| (4) |
and, for ,
| (5) |
Here, describes the optical path length through the layer, is the absorption coefficient, is the radial distance of a pixel from the image center, is the solid angle subtended by a single pixel, is the specific intensity radiated by a blackbody of temperature at frequency , and is the assumed temperature of the photosphere. and are given by
| (6) | |||||
| (7) | |||||
| (8) |
The pixel size of the model images was milli-arcseconds. For each iteration of the fit, a model image was generated and integrated along one dimension, and a one-dimensional Fourier transform was performed in order to generate a set of visibilities. Each model visibility was compared to measured visibilities that were closest to it (i.e., within ) in spatial frequency. A Levenberg-Marquardt fitting algorithm was employed to calculate the free parameter set that minimized the global .
The results of the fit for each observing epoch are given in Table 3. Errors for each parameter were calculated using the resulting covariance matrix. In order to confirm the validity of our analyses, we added the visibility and closure phase models of the point sources, that were earlier subtracted from the visibility data from each epoch, to the best-fit model visibilities. values relating this sum to the original visibility data were calculated for each epoch, and were found to be comparable to the values of the fits to UDs and point sources shown in Table 2.
The changes with time of the fitted layer temperatures and outer radii are similar to the changes with time in the effective stellar temperatures and the apparent UD radii respectively. All our fitted layer radii and temperatures are roughly consistent with the 1.31.5 (0.057″ to 0.065″diameter) and 15002000 K layers modeled by most authors (Tsuji, 2000a; Ohnaka, 2004; Tsuji, 2006; Verhoelst et al., 2006; Perrin et al., 2007). The values we calculate for the 11.15 m optical depth of 1 are half of those resulting from the models of Perrin et al. (2004) and Perrin et al. (2007).
| Year | (K) | (mas) | |
|---|---|---|---|
| 2006 | 1.90.7 | 0.80.1 | 28.60.7 |
| 2007 | 2.50.9 | 0.90.1 | 25.50.9 |
| 2008 | 21 | 1.20.2 | 251 |
| 2009 | 2.30.8 | 0.990.06 | 26.80.8 |
| 2010 | 2.80.6 | 1.050.03 | 29.80.6 |
3.4. Modeling the layer opacity
The lack of wideband mid-IR spectral information during our observing epochs limits modeling of molecular gas and dust species that contribute to the layer opacity. We are able, however, to investigate some basic physical characteristics of the layer using the opacity mechanism described by Tatebe & Townes (2006). This work showed that, for solar abundance gas at temperatures similar to those in red giant atmospheres, collision processes between neutral hydrogen atoms and free electrons dominate the mid-IR opacity. For temperatures of 2500 K to 3000 K, the primary sources of free electrons were found to be thermally ionized Na and Al. The abundances of H-, H2 and H+ relative to H were found to be too low to contribute to the opacity through collisions with electrons, and photoionization and photodissociation processes were also found to be insignificant. The absorption coefficient due to electron-hydrogen atom collisions, first derived by Dalgarno & Lane (1966), is given in simplified form as
| (9) |
where is the electron number density, is the hydrogen atom number density, and is expressed as a third-order polynomial in (Tatebe & Townes, 2006). This opacity mechanism is used to explain the sizes of the radio photospheres of red giant stars (Reid & Menten, 1997; Lim et al., 1998), at different wavelengths. For example, Lim et al. (1998) found that the radio photosphere of Betelgeuse appeared larger, yet cooler, for longer wavelengths.
We consider the implications of this mechanism dominating the mid-IR continuum opacity. Equation 9 can be used to calculate hydrogen atom number densities from the fitted layer optical depths. The electron number densities were obtained from Table 2 of Tatebe & Townes (2006), which gives the fractional ionizations, relative to , of various metals at different temperatures. We further used the hydrogen number densities to calculate the total layer mass, , for each epoch, using a distance of pc to Betelgeuse (Harper et al., 2008). Our results are given in Table 4.
We find masses for the layer of between and . Our values for the hydrogen number density of between cm-3 and cm-3, using a hydrogen atomic mass of g, are equivalent to mass densities of g cm-3. Such values are consistent with the hydrogen density derived for the Betelgeuse layer modeled by Perrin et al. (2007), where they derived their hydrogen density by assuming a ratio between the H2O number density and the hydrogen number density of (Jennings & Sada, 1998) and using their calculated values of for the layer. Our values for the hydrogen density are therefore also consistent with the values for the water density derived by Perrin et al. (2007), though they result from very different methods of calculation.
| Year | (cm) | () |
|---|---|---|
| 2006 | 51 | 61 |
| 2007 | 4.60.9 | 31 |
| 2008 | 92 | 42 |
| 2009 | 4.30.8 | 31 |
| 2010 | 3.50.4 | 5.00.9 |
4. The origin of the point sources in the mid-IR
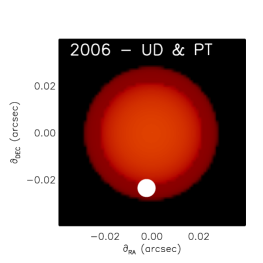
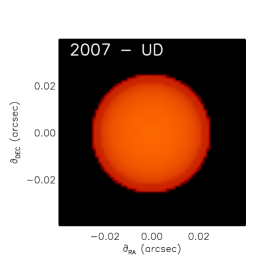
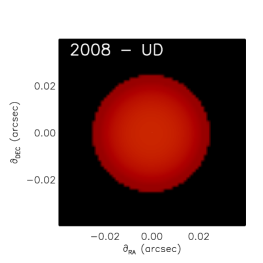
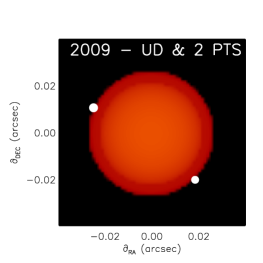
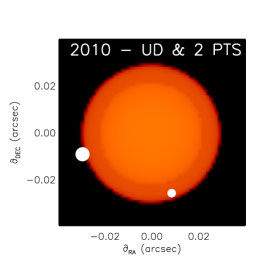
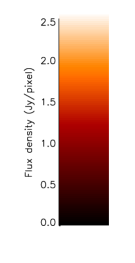
We now consider a physical interpretation of the point sources used to model the ISI interferometric data on Betelgeuse. Figure 4 shows images of the intensity distribution of Betelgeuse during each observing epoch, calculated from the photosphere and layer models, with the point source locations indicated by filled white disks. The color brightness of the images is consistent with the same flux density scale, also depicted in Figure 4, and the areas of the disks representing the point sources indicate their flux densities calculated from their fitted fractions of the total intensity. All point sources are positive in intensity with respect to the star.
Non-uniformities on the observed stellar disk of Betelgeuse at optical and near-IR wavelengths have been reported by several authors (e.g., Buscher et al., 1990; Haubois et al., 2009). These asymmetries are generally modeled either as point sources, or as UDs or two-dimensional Gaussian profiles of fixed, unresolved size. The intensities of these ‘spots’ are generally found to be between 5% and 20% of the intensity of the stellar disk. The distribution and strengths of the spots are found to vary significantly across optical and near-IR bands during contemporaneous observations (Young et al., 2000), with the star sometimes appearing featureless in one band and highly non-uniform in another. The spots are also found to vary on timescales of less than 8 weeks (Wilson et al., 1997). One such spot was recently resolved in the H-band by Haubois et al. (2009), who reported a diameter of 0.011″for this spot.
These results are consistent with a prediction by Schwarzschild (1975) for extremely large-scale convection on red giants. Red supergiants are suggested to have only a few tens of convection cells on their surfaces, as opposed to the thousands present on the surface of the Sun. Similar predictions also result from three-dimensional numerical simulations (e.g., Freytag et al., 2002; Chiavassa et al., 2009), and an initial attempt at matching simulations to interferometric observations was made by Chiavassa et al. (2010). Schwarzschild (1975) predicted temperature fluctuations of up to K with respect to the photospheric temperatures of red giant stars. This is consistent with the intensities of spots observed in the visible and near-IR.
The point sources fitted to our mid-IR data do not arise directly from large-scale convective features on the surface of Betelgeuse. If we assume a 0.01″ diameter for the weakest of our point sources (see Table 2), which contributes 0.7% of the 4400 Jy flux density of Betelgeuse in 2009, its temperature of 660 K above the effective surface temperature, calculated using Equation 2, is consistent with a photospheric hotspot of 1000 K behind the layer. If we assign a similar diameter to any of the other point sources we observe, even greater temperatures would result for associated photospheric hotspots. The mid-IR point sources are hence more intense than expected from surface temperature fluctuations caused by giant convection cells (Schwarzschild, 1975). Furthermore, every one of our point sources is located beyond the edge of the photospheric disk (see Figure 4).
It is clear therefore that the observed asymmetry of Betelgeuse in the mid-IR is caused by a non-uniform intensity distribution in the layer. We do not have sufficient sampling of the plane in any epoch to identify whether the layer is in fact spherically symmetric, but with temperature fluctuations, or whether the layer is extended in particular directions. The point sources can also be explained in terms of opacity inhomogeneities in the layer. In the Rayleigh-Jeans approximation to the Planck law, the effective radiation temperature, , of a column of material with optical depth and temperature is given by
| (10) |
For example, increasing the value of from 1 to 3 increases by a factor of 1.5. Non-uniform spatial, temperature and opacity distributions of the Betelgeuse layer could all explain the observed mid-IR non-uniformities.
5. Discussion
5.1. The extended atmosphere of Betelgeuse
Molecular layers directly surrounding the photospheres of red supergiant stars, and in particular Betelgeuse, have been modeled by a variety of authors under differing assumptions for the layer geometry and the dominant opacity source. A layer of water with a column density of 1020 cm-2 at a temperature of 1500 K was first suggested by Tsuji (2000a) for Betelgeuse, based on modeling of near-IR spectra. A combination of spectral and interferometric modeling by Ohnaka (2004), assuming a layer geometry identical to ours, suggested a layer temperature of 2050 K and an outer radius of 1.45, while modeling the mid-IR opacity as being dominated by a continuum of water emission and absorption lines. Under the assumption of a layer with a well-defined inner radius, Tsuji (2006) modeled a shell beyond 1.3 with a temperature of 2250 K, again dominated by water opacity. More advanced spectral modeling by Verhoelst et al. (2006) revealed that water could not play a dominant role in determining the mid-IR continuum opacity, and instead suggested the presence of amorphous alumina in the molecular layer. This model was consolidated by Perrin et al. (2007) to suggest a shell between 1.32 and 1.42 at a temperature of 1520 K.
The properties we derive for a layer surrounding Betelgeuse, summarised in Table 3 for each observing epoch, are largely consistent with these results. We find temperatures that vary between 1900 K and 2800 K and outer radii that vary between 1.14 and 1.36. Our modeling technique most closely matched that of Perrin et al. (2004) in assuming thermal continuum emission from the layer within our observing band. This assumption is justified by the featureless spectrum of Betelgeuse within, and around, our observing band and by the lack of any significant water lines within and surrounding our band (Weiner et al., 2003b). The results are consistent with previous models of the Betelgeuse layer.
A consistent picture of the composition of the layer has, however, not been achieved. While spectral modeling has uncovered the presence of numerous molecular species, including H2O, CO, SiO and possibly CN, as well as alumina dust (Tsuji, 2006; Perrin et al., 2007; Kervella et al., 2009), the opacity of the layer as a function of wavelength is not yet fully determined. Our results for the optical depth of the layer of 1 at 11.15 m wavelength are not in agreement with those of Perrin et al. (2004) and Perrin et al. (2007), who obtain optical depths of 2.
The number density of atomic hydrogen, based on the 11.15 m opacity arising from electron-hydrogen atom collisions, is 1011 cm-3. This density, given the derived layer size, corresponds to H2O column densities of 1019 cm-2; this result is consistent with H2O column densities measured by Jennings & Sada (1998) and those derived from spectral modeling (e.g., Tsuji, 2006). We therefore suggest that electron-hydrogen atom collisions play a significant role in determining the mid-IR continuum opacity of the Betelgeuse layer, and that this mechanism must also be accounted for in models for the layer composition.
We have shown that the layer of material surrounding the photosphere of Betelgeuse has a non-uniform intensity distribution. A similar result was recently reported by Ohnaka et al. (2011) based on interferometric measurements of the one-dimensional intensity and velocity profile of CO gas in the inner atmosphere of Betelgeuse. Ohnaka et al. (2011) also reported a change in the one-dimensional CO intensity and velocity profile between two epochs spaced by a year. We find that the intensity distribution of the layer varies between each the five observing epochs we present, which are also spaced by approximately one year.
The non-uniformities that we observe in the layer reflect, on much smaller spatial scales, the non-uniformities observed in various components of the circumstellar environment of Betelgeuse. A gaseous component at similar temperatures to the Betelgeuse layer was shown to have an asymmetric intensity distribution by Lim et al. (1998). Our observations and those of Lim et al. (1998) could be linked by the opacities in both wavelength bands being partly caused by electron-hydrogen atom collisions. The opacity due to this mechanism is proportional to , implying that the observed stellar size decreases with shorter observing wavelengths. Material at chromospheric temperatures is also observed to be asymmetrically distributed (Hebden et al., 1987; Gilliland & Dupree, 1996), and observations of a circumstellar envelope by Kervella et al. (2009) at near-IR wavelengths also reveal significant asymmetry. Asymmetry in the large-scale (1″) dust distribution surrounding Betelgeuse was also observed by Bloemhof et al. (1985).
Molecular layer models have been applied to the few red supergiant stars that have been observed with sufficient spatial resolution, such as Cephei (Perrin et al., 2005; Tsuji, 2006) and Herculis (Ohnaka, 2004). Similar layers are identified around AGB stars (Weiner et al., 2003a; Ohnaka et al., 2005). The properties of individual red supergiant layers vary significantly from star to star, and a greater sample of measurements is required to understand what determines individual layer properties.
5.2. Implications of the results reported for red supergiant mass-loss
The processes by which red supergiant stars form and accelerate dust, while crucial to mass-loss scenarios, are little understood. Existing models of stellar atmospheres (e.g., Gustafsson et al., 2008; Plez, 2010) cannot predict locations for dust condensation, and attempts to model dust acceleration through radiation pressure have also so far been unsuccessful (e.g., Woitke, 2007). Our multi-epoch study of a layer directly surrounding Betelgeuse provides new insight into the processes involved in red supergiant mass-loss.

We have shown that the basic properties of the layer, given in Table 3, exhibit striking variability from year to year. The layer is found to decrease in size and increase in optical depth over the years , and increase in size and decrease in optical depth between . The layer temperature does not show such systematic variability, although the largest layer size (in 2010) does correspond to the highest temperature. The variability in the apparent mid-IR size of Betelgeuse reported by Townes et al. (2009) can also be interpreted to indicate variations in the layers. Intriguingly, a similar phenomenon was reported by Pease (1922), who noted a decrease in the size of Betelgeuse at visible wavelengths followed by an increase.
Figure 5 shows measurements of the visual magnitude of Betelgeuse during between 2006 and 2010, as well as the ISI measurements of the total 11.15m flux density (also listed in Table 1). The timespans of the ISI observing epochs are also plotted. The visual magnitude measurements were obtained from the online database111http://www.aavso.org/data-download of the American Association of Variable Star Observers (AAVSO). The data, collected by a multitude of volunteer observers, were averaged over 30-day timespans; each timespan with less than 10 measurements was discarded. The visual variability of Betelgeuse over our observing epochs was approximately 0.9 magnitudes. The visual intensity of Betelgeuse is not likely to represent that of the photosphere because the apparent stellar diameter at visible wavelengths is greater than that at near-IR wavelengths (Young et al., 2000). Also, using contemporaneous interferometric observations of Betelgeuse at different wavelengths, Young et al. (2000) found that hotspots evident in the visible were not present in the near-IR. Observations of Betelgeuse at visible wavelengths could represent regions within the layer observed at mid-IR wavelengths. It is interesting that the mid-IR flux density of Betelgeuse, as well as the effective temperatures plotted in Figure 3, and the visual magnitude appear somewhat correlated, particularly in their increase during the 2009 and 2010 epochs. Previous authors (Kiss et al., 2006) have concluded that the visual variability of Betelgeuse is probably indicative of quasi-periodic pulsations, and is too great to be explained by variations in the hotspot distribution.
The layer of material surrounding Betelgeuse is a candidate location for the onset of dust formation. A number of authors have identified the presence of alumina dust directly above the photosphere (Verhoelst et al., 2006; Perrin et al., 2007; Verhoelst et al., 2009). The derived physical parameters of the layer, such as the temperatures and hydrogen mass densities, are suitable for the formation of amorphous alumina (Woitke, 2006; Dirks et al., 2008). While some aspects of the modeled variability of the layer might be due to variations in the photosphere, measurements of changes in the apparent mid-IR appearance of Betelgeuse must be largely caused by variations in the layer. If alumina contributes significantly to the mid-IR continuum opacity, these variations would represent variations in the dust content of the layer. Our estimates of changes in the mass of the layer, on the order of (see Table 4), might indicate evolution in the layer.
The point sources we observe in the layer of material surrounding Betelgeuse and their changes suggest that the layer dynamics are anisotropic. Asymmetries observed in the circumstellar environment of Betelgeuse are generally linked to the presence of giant convection cells on the stellar surface. Such convection cells are thought to shape the circumstellar environment of Betelgeuse by elevating cool photospheric material (Lim et al., 1998) and driving large-scale chromospheric motions (Gilliland & Dupree, 1996). Our results indicate that giant convection cells have a significant role in shaping the Betelgeuse layer. This is because the mechanism that elevates the layer material above the photosphere is clearly anisotropic. The large intensities of the observed point-source components imply the action of large-scale photospheric features, and their variability between observing epochs demonstrates the transient nature of the cause of the point sources. Changes in the distribution of convection cells on the photosphere of Betelgeuse could also influence the overall layer properties. While the nature of the non-uniform brightness distribution of the layer is yet to be determined, our observations represent evidence for the role of giant convection cells in shaping the inner atmosphere of Betelgeuse.
5.3. Future work
Observations of a sample of red supergiant stars with high spatial resolution and wide bandwidth, over multiple epochs, are necessary to form a general picture for the role of molecular layers in mass-loss processes. More detailed interferometric imaging of Betelgeuse at mid-IR wavelengths is also required to understand the true role of giant convection cells in shaping the layer. Simultaneous visible, near-IR, and mid-IR interferometry could also provide interesting information on correspondences between different regions of the layer. Interferometric studies with both high spatial resolution and high spectral resolution are planned for the ISI (Wishnow et al., 2010), and have been performed at near-IR wavelengths by Ohnaka et al. (2009) and Ohnaka et al. (2011). Such investigations are aimed at revealing the molecular compositions, kinematic structures and true extents of red supergiant layers. More detailed modeling of layer opacities is also required, taking into account contributions from molecular absorption and emission, dust and electron-hydrogen atom collisions. Upcoming optical and infrared interferometer systems, such as the Magdalena Ridge Observatory Interferometer and the MATISSE instrument at the Very Large Telescope Interferometer, as well as high spatial resolution observations with the next generation of extremely large telescopes could finally clarify our understanding of red supergiant mass loss.
6. Conclusions
The ISI has been used to conduct observations of Betelgeuse over 20062010 in the mid-IR continuum with high spatial resolution. By fitting visibility and closure phase measurements with image models, the apparent stellar size was measured at each observing epoch, and up to two point sources were sometimes detected at the edge of the stellar disk. The results were interpreted in terms of an absorbing layer surrounding an assumed 3641 K photosphere. We have shown that:
-
1.
Observations during every epoch can be modeled in terms of a layer surrounding the photosphere, with optical depths of 1 at 11.15 m wavelength, outer sizes between 1.16 and 1.36, and temperatures between 1900 K and 2800 K.
-
2.
Electron-hydrogen atom collisions contribute to the opacity of the layer.
-
3.
Assuming a non-varying photosphere, the layer exhibits significant variability.
-
4.
The layer has a non-uniform intensity distribution that also varies from year to year.
Both the non-uniformity and the variability of the modeled layer suggest that giant convection cells play an important role in shaping the inner atmosphere and the mass-loss dynamics of Betelgeuse.
References
- Adams & MacCormack (1935) Adams, W. S., & MacCormack, E. 1935, ApJ, 81, 119
- Antia et al. (1984) Antia, H. M., Chitre, S. M., & Narasimha, D. 1984, ApJ, 282, 574
- Bester et al. (1996) Bester, M., Danchi, W. C., Hale, D., Townes, C. H., Degiacomi, C. G., Mekarnia, D., & Geballe, T. R. 1996, ApJ, 463, 336
- Bloemhof et al. (1985) Bloemhof, E. E., Danchi, W. C., & Townes, C. H. 1985, ApJ, 299, L37
- Bonneau & Labeyrie (1973) Bonneau, D., & Labeyrie, A. 1973, ApJ, 181, L1
- Boyajian et al. (2009) Boyajian, T. S., et al. 2009, ApJ, 691, 1243
- Buscher et al. (1990) Buscher, D. F., Baldwin, J. E., Warner, P. J., & Haniff, C. A. 1990, MNRAS, 245, 7P
- Chiavassa et al. (2009) Chiavassa, A., Plez, B., Josselin, E., & Freytag, B. 2009, A&A, 506, 1351
- Chiavassa et al. (2010) Chiavassa, A., Haubois, X., Young, J. S., Plez, B., Josselin, E., Perrin, G., & Freytag, B. 2010, A&A, 515, A12
- Dalgarno & Lane (1966) Dalgarno, A., & Lane, N. F. 1966, ApJ, 145, 623
- Danchi et al. (1994) Danchi, W. C., Bester, M., Degiacomi, C. G., Greenhill, L. J., & Townes, C. H. 1994, AJ, 107, 1469
- de Beck et al. (2010) de Beck, E., Decin, L., de Koter, A., Justtanont, K., Verhoelst, T., Kemper, F., & Menten, K. M. 2010, A&A, 523, A18
- Dirks et al. (2008) Dirks, U., Schirrmacher, V., & Sedlmayr, E. 2008, A&A, 491, 643
- Freytag et al. (2002) Freytag, B., Steffen, M., & Dorch, B. 2002, Astronomische Nachrichten, 323, 213
- Gehrz (1989) Gehrz, R. 1989, in Interstellar Dust, eds. L. J. Allamandola & A. G. G. M. Tielens, IAU Symp. 135, pg. 445
- Gilliland & Dupree (1996) Gilliland, R. L., & Dupree, A. K. 1996, ApJ, 463, L29
- Gustafsson et al. (2008) Gustafsson, B., Edvardsson, B., Eriksson, K., Jørgensen, U. G., Nordlund, Å., & Plez, B. 2008, A&A, 486, 951
- Hale et al. (2000) Hale, D. D. S., et al. 2000, ApJ, 537, 998
- Harper et al. (2001) Harper, G. M., Brown, A., & Lim, J. 2001, ApJ, 551, 1073
- Harper et al. (2008) Harper, G. M., Brown, A., & Guinan, E. F. 2008, AJ, 135, 1430
- Harper et al. (2009) Harper, G. M., Richter, M. J., Ryde, N., Brown, A., Brown, J., Greathouse, T. K., & Strong, S. 2009, ApJ, 701, 1464
- Hartmann & MacGregor (1980) Hartmann, L., & MacGregor, K. B. 1980, ApJ, 242, 260
- Haubois et al. (2009) Haubois, X., et al. 2009, A&A, 508, 923
- Hebden et al. (1987) Hebden, J. C., Eckart, A., & Hege, E. K. 1987, ApJ, 314, 690
- Heger & Langer (1998) Heger, A., & Langer, N. 1998, A&A, 334, 210
- Humphreys (1986) Humphreys, R. M. 1986, in Luminous Stars and Associations in Galaxies, eds. C. W. H. De Loore, A. J. Willis, & P. Laskarides, IAU Symp. 116, pg. 45
- Jennings & Sada (1998) Jennings, D. E., & Sada, P. V. 1998, Science, 279, 844
- Jennison (1958) Jennison, R. C. 1958, MNRAS, 118, 276
- Josselin & Plez (2007) Josselin, E., & Plez, B. 2007, A&A, 469, 671
- Kervella et al. (2009) Kervella, P., Verhoelst, T., Ridgway, S. T., Perrin, G., Lacour, S., Cami, J., & Haubois, X. 2009, A&A, 504, 115
- Kiss et al. (2006) Kiss, L. L., Szabó, G. M., & Bedding, T. R. 2006, MNRAS, 372, 1721
- Lim et al. (1998) Lim, J., Carilli, C. L., White, S. M., Beasley, A. J., & Marson, R. G. 1998, Nature, 392, 575
- Michelson & Pease (1921) Michelson, A. A., & Pease, F. G. 1921, ApJ, 53, 249
- Monnier et al. (1998) Monnier, J. D., Geballe, T. R., & Danchi, W. C. 1998, ApJ, 502, 833
- Ohnaka (2004) Ohnaka, K. 2004, A&A, 421, 1149
- Ohnaka et al. (2005) Ohnaka, K., et al. 2005, A&A, 429, 1057
- Ohnaka et al. (2009) Ohnaka, K., et al. 2009, A&A, 503, 183
- Ohnaka et al. (2011) Ohnaka, K., et al. 2011, arXiv:1104.0958
- Pease (1922) Pease, F. G. 1922, PASP, 34, 346
- Perrin et al. (2004) Perrin, G., Ridgway, S. T., Coudé du Foresto, V., Mennesson, B., Traub, W. A., & Lacasse, M. G. 2004, A&A, 418, 675
- Perrin et al. (2005) Perrin, G., Ridgway, S. T., Verhoelst, T., Schuller, P. A., Coudé du Foresto, V., Traub, W. A., Millan-Gabet, R., & Lacasse, M. G. 2005, A&A, 436, 317
- Perrin et al. (2007) Perrin, G., et al. 2007, A&A, 474, 599
- Plez (2010) Plez, B. 2010, in Hot and Cool: Bridging Gaps in Massive Star Evolution, eds. C. Leitherer, P. Bennett, P. Morris, & J. van Loon, ASP Conf. Ser. 425, pg. 124
- Reid & Menten (1997) Reid, M. J., & Menten, K. M. 1997, ApJ, 476, 327
- Rosseland (1924) Rosseland, S. 1924, MNRAS, 84, 525
- Ryde et al. (2006) Ryde, N., Harper, G. M., Richter, M. J., Greathouse, T. K., & Lacy, J. H. 2006, ApJ, 637, 1040
- Salpeter (1977) Salpeter, E. E. 1977, ARA&A, 15, 267
- Schwarzschild (1975) Schwarzschild, M. 1975, ApJ, 195, 137
- Stencel et al. (1989) Stencel, R. E., Pesce, J. E., & Bauer, W. H. 1989, AJ, 97, 1120
- Tatebe & Townes (2006) Tatebe, K., & Townes, C. H. 2006, ApJ, 644, 1145
- Tatebe et al. (2007) Tatebe, K., Chandler, A. A., Wishnow, E. H., Hale, D. D. S., & Townes, C. H. 2007, ApJ, 670, L21
- Townes et al. (2009) Townes, C. H., Wishnow, E. H., Hale, D. D. S., & Walp, B. 2009, ApJ, 697, L127
- Tsuji (2000a) Tsuji, T. 2000, ApJ, 538, 801
- Tsuji (2000b) Tsuji, T. 2000, ApJ, 540, L99
- Tsuji (2006) Tsuji, T. 2006, ApJ, 645, 1448
- van Belle et al. (2010) van Belle, G. T., et al. 2010, arXiv:1012.1146
- Verhoelst et al. (2006) Verhoelst, T., et al. 2006, A&A, 447, 311
- Verhoelst et al. (2009) Verhoelst, T., van der Zypen, N., Hony, S., Decin, L., Cami, J., & Eriksson, K. 2009, A&A, 498, 127
- Weiner et al. (2000) Weiner, J., Danchi, W. C., Hale, D. D. S., McMahon, J., Townes, C. H., Monnier, J. D., & Tuthill, P. G. 2000, ApJ, 544, 1097
- Weiner et al. (2003a) Weiner, J., Hale, D. D. S., & Townes, C. H. 2003, ApJ, 588, 1064
- Weiner et al. (2003b) Weiner, J., Hale, D. D. S., & Townes, C. H. 2003, ApJ, 589, 976
- Weiner (2004) Weiner, J. 2004, ApJ, 611, L37
- Wilson et al. (1997) Wilson, R. W., Dhillon, V. S., & Haniff, C. A. 1997, MNRAS, 291, 819
- Wishnow et al. (2010) Wishnow, E. H., Mallard, W., Ravi, V., Lockwood, S., Fitelson, W., Wertheimer, D., & Townes, C. H. 2010, Proc. SPIE, 7734
- Woitke (2006) Woitke, P. 2006, A&A, 452, 537
- Woitke (2007) Woitke, P. 2007, in Why Galaxies Care About AGB Stars: Their Importance as Actors and Probes, eds. F. Kerschbaum, C. Charbonnel, & R. F. Wing, ASP Conf. Ser. 378, pg. 156
- Woodruff et al. (2009) Woodruff, H. C., et al. 2009, ApJ, 691, 1328
- Yoon & Cantiello (2010) Yoon, S.-C., & Cantiello, M. 2010, ApJ, 717, L62
- Young et al. (2000) Young, J. S., et al. 2000, MNRAS, 315, 635