Prospects of detecting gamma-ray emission from galaxy clusters: cosmic rays and dark matter annihilations
Abstract
We study the possibility for detecting gamma-ray emission from galaxy clusters. We consider 1) leptophilic models of dark matter (DM) annihilation that include a Sommerfeld enhancement (SFE), 2) different representative benchmark models of supersymmetric DM, and 3) cosmic ray (CR) induced pion decay. Among all clusters/groups of a flux-limited X-ray sample, we predict Virgo, Fornax and M49 to be the brightest DM sources and find a particularly low CR-induced background for Fornax. For a minimum substructure mass given by the DM free-streaming scale, cluster halos maximize the substructure boost for which we find a factor of . Since regions around the virial radius dominate the annihilation flux of substructures, the resulting surface brightness profiles are almost flat. This makes it very challenging to detect this flux with imaging atmospheric Cherenkov telescopes since their sensitivity drops approximately linearly with radius and they typically have linear resolution elements across a cluster. Assuming cold dark matter with a substructure mass distribution down to an Earth mass and using extended Fermi upper limits, we rule out the leptophilic models in their present form in 28 clusters, and limit the boost from SFE in M49 and Fornax to be . This corresponds to a limit on SFE in the Milky Way of which is too small to account for the increasing positron fraction with energy as seen by PAMELA and challenges the DM interpretation. Alternatively, if SFE is realized in Nature, this would imply a limiting substructure mass of —a problem for structure formation in most particle physics models. Using individual cluster observations, it will be challenging for Fermi to constrain our selection of DM benchmark models without SFE. The Fermi upper limits are, however, closing in on our predictions for the CR flux using an analytic model based on cosmological hydrodynamical cluster simulations. We limit the CR-to-thermal pressure in nearby bright galaxy clusters of the Fermi sample to and in Norma and Coma to . Thus we will soon start to constrain the underlying CR physics such as shock acceleration efficiencies or CR transport properties.
pacs:
95.35.+d, 95.85.Pw, 98.62.Gq, 98.65.-r, 98.70.SaI Introduction
Dark matter (DM) has been searched for in direct detection experiments Pato et al. (2011), at accelerators Ellis et al. (2002); Baer et al. (2007); Khachatryan et al. (2011) and also in indirect detection experiments looking for signals in the cosmic-ray (CR) spectra of antiprotons, positrons, neutrinos and all of the electromagnetic spectrum from radio waves to gamma-rays Bergstrom (2009). So far, the improvements in direct detection sensitivity have put this method into focus, but the situation may change considerably the coming few years as the CERN LHC experiments collect data, and new gamma-ray detectors are being planned, such as the CTA CTA (2010). In fact, it has recently been pointed out Bergstrom et al. (2011) that a dedicated ground-based gamma-ray detector would have potential that goes far beyond that of the other methods, depending on presently unknown parameters in the particle physics models for DM.
Among the astrophysical systems which will be very interesting to detect, and study, with gamma-ray detectors (Fermi, H.E.S.S., MAGIC, VERITAS, and eventually large detectors like CTA)111High Energy Stereoscopic System, Major Atmospheric Gamma Imaging Cerenkov Telescope, Very Energetic Radiation Imaging Telescope Array System, Cerenkov Telescope Array. belong galaxy clusters. The most promising directions in which to search for a gamma-ray annihilation signal (from the annihilation process itself, and also the accompanying bremsstrahlung and inverse Compton (IC) components coming from charged particles produced in the annihilations) are basically three:
1. The galactic center (g.c.). This is where all numerical simulations of cold dark matter (CDM) predict the highest density. However, the detailed DM density in the very central part is difficult to predict, due a to a possibly very complicated interplay between baryons, DM, and the central galactic black hole. Also, it is a very crowded region with many gamma-ray sources like pulsars, CR-illuminated molecular clouds, and other supernova remnants, which have to be subtracted from the data to extract the DM induced signal. In fact, there is a recent claim of an indication of a relatively light DM particle contribution to the gamma-ray flux from the g.c. Hooper and Goodenough (2011), but other hypotheses seem to work at least as well Boyarsky et al. (2010).
2. The dwarf spheroidal galaxies orbiting the Milky Way (MW), like Segue-1, Ursa Minor, Draco, Sagittarius, Sculptor, Carina or Willman-1 Bringmann et al. (2009); Acciari et al. (2010); Scott et al. (2010, 2010); Aleksić et al. (2011); Abramowski et al. (2011). The problem here is that the nature of many of these small, dark matter-dominated galaxies is not entirely clear, and the velocity dispersion estimates are based on rather small numbers of stars. Confusion with star clusters and tidal disruption are other complications. Once a satellite dwarf galaxy is accreted by the MW, the outer regions are severely affected by tidal stripping. The longer a satellite has been part of our Galaxy, and the closer it comes to the center during its pericentral passage, the more material is removed Gao et al. (2004). Thus the DM density profile is very uncertain for most of them, especially for radii larger than those probed by the stars. Nonetheless, by stacking the data together from many dwarf spheroidals these uncertainties can be made less severe, and preliminary results from Fermi-LAT shows this method to give quite promising results Garde .
3. Galaxy clusters. This possibility has been less studied theoretically, however currently there is an ongoing observational campaign to detect gamma-ray emission from galaxy clusters Reimer et al. (2003); Perkins et al. (2006); Perkins (2008); Aharonian et al. (2009a); Galante and for the VERITAS Collaboration (2009); Domainko et al. (2009); Aharonian et al. (2009a, b); Kiuchi et al. (2009); Acciari et al. (2009); Aleksić et al. (2010a); Ackermann et al. (2010, 2010). In fact, we noted in a previous Letter Pinzke et al. (2009) that there are certain advantages that work in favour of this possible target for gamma-ray detection of DM annihilation. Galaxy clusters constitute the most massive objects in our Universe that are forming today. This causes their DM subhalo mass function to be less affected by tidal stripping compared to galaxy sized halos that formed long ago. The annihilation luminosities of the DM halo component for e.g. the Virgo cluster and the Draco dwarf scales in a way (see Pinzke et al. (2009)) that the ratio of gamma-ray luminosities from the smooth components is around 4, in favour of Virgo. In addition, there may be a further enhancement due to substructure, which to a large extent should be unaffected by tidal disruption, at least in the outer regions. According to a recent estimate Gao et al. (2011a), more massive haloes tend to have a larger mass fraction in subhalos. For example, cluster size haloes typically have 7.5 per cent of the mass within in substructures of fractional mass larger than , which is 25 per cent higher than for galactic haloes.222All halo masses and length scales in this paper are scaled to the currently favored value of Hubble’s constant, . We define the virial mass and virial radius as the mass and radius of a sphere enclosing a mean density that is 200 times the critical density of the Universe .
In this paper, we will investigate in detail the potential of several of the most promising galaxy clusters to produce an annihilation gamma-ray yield which could be observable with present and planned gamma-ray detectors. Here, we sketch out the main arguments that need to be considered for maximizing the expected signal-to-noise ratio of a promising target cluster. First, we need to maximize the DM annihilation flux of an unresolved cluster, , where depends on the particle physics model of DM, is the smooth DM density profile, is the luminosity distance, and if we assume universality of the DM density profile. The dependence of on the halo formation epoch breaks the universality and slightly modifies the mass dependence, yielding Pinzke et al. (2009). Additionally, the presence of a hierarchy of substructures down to small scales Springel et al. (2008a) and the potential dependence of the particle physics cross section on the relative DM particle velocities Arkani-Hamed et al. (2009) may furthermore modify the scaling parameter and shall be one of the focus points of this work. Second, we need to minimize the expected noise which is a sum of instrumental noise, galactic and cluster-intrinsic foreground. While the galactic foreground varies across the sky, it is typically lower for increasing latitude (away from the galactic plane). It is thought that the gamma-ray foreground from clusters is dominated by CRs which are accelerated at cosmological formation shocks and transported over time although there could be a substantial contribution of CRs from AGNs and supernova-driven galactic winds. In this work we will also study (and constrain) the CR-induced emission from clusters to identify those objects that are expected to be especially dim which would imply a low CR-induced background. Since the CR-induced emission is expected to scale with the thermal X-ray emission of clusters Pfrommer and Enßlin (2004a), we estimate gamma-ray fluxes of a nearby X-ray flux complete sample of galaxy clusters from the Rosat all-sky survey (extended HIghest X-ray FLUx Galaxy Cluster Sample, HIFLUGCS, Reiprich and Böhringer (2002); Chen et al. (2007)).333Note that we have added the Virgo cluster to the sample that we nevertheless refer to as extended HIFLUGCS catalogue in the following. This complements and extends previous work related to DM in clusters Colafrancesco et al. (2006); Jeltema et al. (2009); Sanchez-Conde et al. (2011); Cuesta et al. (2011); Huang et al. (2011) and to CRs in clusters Pinzke and Pfrommer (2010); Brunetti and Lazarian (2011); Pfrommer et al. (2008); Kushnir and Waxman (2009); Donnert et al. (2010a).
In Section 2 we discuss the theory of DM and gamma-rays. In particular, we focus on the leptophilic (LP) and supersymmetric benchmark (BM) DM models in this work, and outline the framework for estimating the gamma-ray emission from various radiative processes. In Section 3 we calculate the gamma-ray fluxes and spectral distributions of four clusters that are identified as prime targets for DM observations (Fornax and Virgo) as well as to have a high CR-induced gamma-ray yield (Perseus and Coma). For the same clusters we derive the gamma-ray surface brightness profiles in Section 4. To extend the analysis to more clusters and increase the list of promising targets we estimate the fluxes from DM and CRs of all clusters in the extended HIFLUGCS sample in Section 5. In Section 6 we conclude and discuss our results.
II Theory
We start the section by discussing two different, but well motivated DM models; LP and supersymmetric DM. We then present the framework that is used to calculate the gamma-ray emission for these DM models using an Einasto DM density profile and the expected enhancement from DM substructures. This is followed by an outline of the framework of IC emission where we take into account photon fields of the cosmic microwave background (CMB), dust, and starlight. We end by summarizing our formalism of calculating the CR-induced pion decay gamma-ray emission which is thought to dominate the astrophysical gamma-ray signal.
II.1 Detecting Particle Dark Matter
Besides the intrinsic interest in the gamma-ray flux from galaxy clusters generated by conventional hadronic and electromagnetic processes - which should be close to observability with the Fermi-LAT data Berezinsky et al. (1997); Enßlin et al. (2007); Pinzke and Pfrommer (2010) - the possible contribution from WIMP DM is of greatest interest. A WIMP (Weakly Interactive Massive Particle) which fulfils the WMAP bounds on the relic density of CDM of Komatsu et al. (2011)
will in many cases naturally give a gamma-yield which may be observable. In addition, there are possible enhancement effects known, such as the astrophysical boost from dense substructure of DM halos, or the particle physics boost from the Sommerfeld effect, which may increase the chances of detection further.
There are three methods for detecting DM candidates which are presently employed: First, at particle physics accelerators such as CERN’s LHC, one is now entering into a new energy regime which may allow the production of the heavy, electrically neutral and long-lived particles which may constitute DM. From these experiments one may get the first glimpse of the mass scale beyond the standard model where DM may reside. However, to really show that any of the hypothetical, new particles created at the LHC is actually the DM, one has to rely on the two other methods available for the DM search, namely direct and indirect detection. Second, direct detection methods, which are presently evolving rapidly, use the feeble interaction between DM particles of the galactic halo and nuclei such as Germanium, Sodium, Iodine, Argon or Xenon to infer the scattering cross section and a rough estimate of the mass of the DM particle (for the currently most sensitive search, see Aprile et al. (2010, 2011)). A characteristic of this method is that it basically only depends on the local DM density (which is rather well determined to be around GeV/cm3) and the basic cross section for DM - nucleus scattering. A disadvantage is that it does not benefit from the two enhancement mechanisms mentioned above, boost from substructure and/or the Sommerfeld effect. Also, it cannot be excluded - although it seems at present improbable - that the local halo structure is such that the solar system happens to be in an underdense region.
Third, in indirect detection, in particular in the photon channel, one searches for products of DM annihilation in the galactic halo and beyond. Particularly interesting targets are the galactic center (for a recent possible indication of a signal, see Hooper and Goodenough (2011), however, see also Boyarsky et al. (2010)), the dwarf galaxies surrounding the MW Strigari et al. (2007); Essig et al. (2009); Scott et al. (2010), galaxy clusters (the focus of this work) Ghigna et al. (1998); Lewis et al. (2003); Boyarsky et al. (2008); Colafrancesco et al. (2006); Pinzke et al. (2009), and even the cosmological large scale structure Bergström et al. (2001); Ullio et al. (2002); Taylor and Silk (2003); Elsaesser and Mannheim (2005); Cuoco et al. (2011); Abazajian et al. (2010); Abdo et al. (2010); Zavala et al. (2011).
II.1.1 Leptophilic models
There is also a possibility to search for DM annihilation in the Milky Way indirectly through annihilation to antimatter channels, which however lacks the important directional signature of gamma-rays. Recently, it has however been much in focus due to the surprising findings of PAMELA Adriani et al. (2009) and Fermi Abdo et al. (2009). Viable particle physics models are rather constrained by other observations, however. For example, the non-observation of an enhanced antiproton flux by PAMELA Adriani et al. (2010) means that quark-antiquark final states have to be suppressed. This has led to the postulate of a whole class of leptophilic models with mainly or exclusively annihilation to leptons and antileptons. In addition, one has to have a sizeable fraction of final states containing muons or tau leptons as the shape of the spectrum disfavors direct annihilation to electrons and positrons only. A large enhancement, of the order of at least several hundred, of the annihilation rate is also needed, something that may be given by the Sommerfeld effect (for a pedagogical review of viable scenarios, see Arkani-Hamed et al. (2009)). As still another difficulty for these models, the lack of an IC signature from the Galactic center means that the DM density distribution must be cored rather than cuspy Bertone et al. (2009); Cirelli et al. (2009); Bergström et al. (2009a). (For a review of the DM modeling of these effects, see Bergstrom (2009). For a recent treatment, showing still viable models, see Finkbeiner et al. (2011).)
A more standard explanation of the PAMELA/Fermi excess would be pulsars or other supernova remnants (e.g., Atoyan et al. (1995); Hooper et al. (2009); Ahlers et al. (2009)). In that case, DM would more likely be explained by the conventional scenario of a WIMP, for example the thoroughly studied lightest supersymmetric neutralino (for reviews, see Jungman et al. (1996); Bergström (2000); Bertone et al. (2005)). We note that AMS-02 experiment on the International Space Station Ting et al. (2011) may give interesting clues to the origin of the antimatter excess.
In the scenario with leptophilic DM, one has to rely on some enhancement of the annihilation rate from the effects of DM halo substructure, a possibility which was realized long ago Silk and Stebbins (1993); Bergström et al. (1998); Moore et al. (1999). However, a boost factor as large as several hundred is difficult to achieve in the solar neighborhood, due to tidal stripping of subhalos in the inner part of the Galaxy. Sommerfeld enhancement is thus important for leptophilic models that claim to explain the PAMELA/Fermi result. This effect was computed for electromagnetism by Arnold Sommerfeld many years ago Sommerfeld (1931) and recently rediscovered in the quantum field theory of DM Hisano et al. (2005); Cirelli et al. (2007); Arkani-Hamed et al. (2009). In quantum mechanics describing electron scattering and electron positron annihilation, it is caused by the distortion of the plane wave describing the relative motion of the annihilating particle pair, due to the near formation of a bound state caused by photon exchange. In the ladder approximation for QED, one reproduces the Sommerfeld effect, and the square of the relative wave function at the origin (which enters into the probability for the short-distance process of annihilation) is increased by the factor Arkani-Hamed et al. (2009)
| (1) |
with the fine-structure constant, and the relative velocity. This amounts to for small velocities. For a Yukawa-like particle of mass , mediating a weak attractive force with coupling constant between DM particles with mass , the small-velocity limit of the enhancement becomes instead
| (2) |
In the general case, with mediators that may also excite virtual charged particles in the DM sector, one has to solve numerically a coupled system of differential equations using appropriate boundary conditions Hisano et al. (2005); Cirelli et al. (2007); Arkani-Hamed et al. (2009). In some cases, the enhancement factor can be as high as several hundred to a few thousand, depending however on the exact parameters of the theory. The effect is usually strongly velocity-dependent, depending on velocity as or, in the fine-tuning case of being very near resonance, as . This means that in a virialised system (such as a galaxy cluster) with large velocity dispersion the SFE will be smaller than the one expected in a single galaxy such as the MW, roughly by a factor . Note that the -scaling is valid only for ; at smaller velocities and outside resonances, the -enhancement saturates at Kamionkowski and Profumo (2008).
As LP models, apart from being slightly contrived from the particle physics point of view, are also rather limited by several sets of astrophysical data. We take advantage of the recent reanalysis Finkbeiner et al. (2011) to define a benchmark LP model that is still viable. It is found that the bounds from WMAP5 approximately imply a Sommerfeld boost factor which has to satisfy GeV, where is the fraction of energy from DM annihilation that ionizes the intergalactic medium, for annihilation to electrons and a factor of a few smaller for all other standard model final states.
Taking into account the whole cosmic history of LP models, also utilizing limit on spectral and polarization distortions of the CMB, the maximal value for the boost factor for a 1 to 2 TeV particle and sub-GeV force carriers is found to be Finkbeiner et al. (2011) between 400 and 800. Although lower than the first estimates (e.g., Bergström et al. (2009b); Meade et al. (2010)) this is still enough to explain the PAMELA and Fermi excess, given other astrophysical uncertainties.
We adopt our benchmark LP model from Finkbeiner et al. (2011) where we use a DM mass TeV and a branching ratio of () into (). Furthermore, since most of the gamma-ray flux is expected to come from dense subhalos within clusters which have a velocity dispersion close to the velocity limit where the SFE saturates, we use for the cluster halos.444Note that is strictly speaking the Sommerfeld enhanced annihilation cross section, but here we have additionally included the order unity constraint that ensures that the relic density is not over-depleted at freeze-out. However, for figures where we neglect the substructure boost, we adopt a velocity dependent SFE that is normalized to fit the electron and positron excess observed at Earth,
| (3) |
where the local boost factor required to explain the data is . The velocity dispersion for the MW, , and the mass dependent velocity dispersion for clusters is derived in Voit (2005).
II.1.2 Supersymmetric dark matter
The most studied models for DM are supersymmetric ones, especially models where the lightest supersymmetric particle, in most models the lightest neutralino, is stable. The stability is assured in viable supersymmetric models due to a discrete symmetry, -parity. This symmetry is needed from the particle physics point of view to avoid fast proton decay, and automatically makes the lightest supersymmetric particle stable, and therefore a good candidate for DM. In addition, as the coupling to ordinary matter is given by gauge couplings, the neutralino is automatically a WIMP candidate. Unfortunately, the breaking of supersymmetry (which has to be there since otherwise, e.g., there would exist a scalar electron with the same mass as the electron) means that a large number of essentially free parameters enter actual calculations. The neutralino is then a linear combination of the supersymmetric partners of the U(1) gauge boson, , one of the SU(2) gauge bosons, , and the two Higgs doublets in the Minimal Supersymmetric extension of the Standard Model (the MSSM), and , with mixing coefficients which depend on the supersymmetric breaking parameters Ellis et al. (1984). The parameter space is very large, too large in general to scan efficiently even with the most powerful computers. Therefore, often simplifying assumptions are made to limit the number of free parameters. Even then, a large number of viable models is found which give a relic density consistent with the WMAP data. This means that they are indeed very good templates for WIMP DM, something that explains their popularity besides the subjective statement that few more well-motivated models for DM have been put forward so far.
The wave function of the lightest neutralino can be written
| (4) |
with
| (5) |
where the gaugino fraction of a given neutralino is whereas is the higgsino fraction.
We use the DarkSUSYpackage Gondolo et al. (2004) to compute the mass, couplings and relic density for a given set of parameters. Actually, we take advantage of so-called benchmark (BM) models, which have been proposed in different contexts (in particular in Bringmann et al. (2009) giving predictions for imaging air Cherenkov telescopes, like MAGIC II and CTA). They give a good representation of models with high enough gamma-ray rates to become the first candidates for DM indirect detection in imaging air Cherenkov telescopes. We use the following supersymmetric BM models:
-
•
: This model was introduced in Battaglia et al. (2004), where its phenomenology at colliders was studied. Annihilation directly into lepton pairs is suppressed for neutralinos due to their Majorana nature and therefore helicity suppression for annihilation in the galactic halo Goldberg (1983). The higher order process (inner bremsstrahlung, IB) , which does not suffer from helicity suppression Bergström (1989); Bringmann et al. (2008), gives a considerable contribution due to light sleptons in this model.
-
•
: This model, also from Battaglia et al. (2004) is in the so-called coannihilation tail. The sleptons are nearly degenerate with the neutralino, which causes the large IB from the leptonic final states to give a high enhancement of the flux.
-
•
: A representative model for the funnel region, where the annihilation dominantly occurs in the -channel through exchange of the pseudoscalar Higgs boson Battaglia et al. (2004). Here IB contributions are not important.
-
•
: Annihilation in the so-called coannihilation region, introduced in Bringmann et al. (2008) as BM3, with a particularly large IB contribution.
The details for the DM BM models are summarized in Table 1.
| BM | |||
|---|---|---|---|
| 140 | 0.09 | ||
| 315 | 0.12 | ||
| 570 | 0.10 | ||
| 234 | 0.09 |
II.1.3 Final state radiation
There are two types of radiative processes which are important for our BM models, first the usual QED final state radiation for both the LP model and for supersymmetric models with charged final states. In addition, there may be direct emission from a virtual, charged, exchanged particle (such as a spin-0 slepton or squark), internal bremsstrahlung, IB. The latter is essentially only important when there is a helicity suppression for the lowest order annihilation process, which is the case for neutralinos, whose Majorana nature make the annihilation rate in the wave proportional to , for final state fermion . Interestingly, both the gamma-ray and fermion energy spectra are peaked at the highest energy for this process, which can in some models cause a rather spectacular bump in the spectra for these models.
The photon spectrum resulting from final state radiation is universal with only a weak dependence of the underlying particle physics model. The photon yield from this process is given by (see e.g. Bringmann et al. (2008))
| (6) |
Here, the normalized photon energy , is the fine-structure constant, and the charge and mass of the final state particle , respectively. The function depends on the spin of the final state and is given by
| (7) |
for fermions.
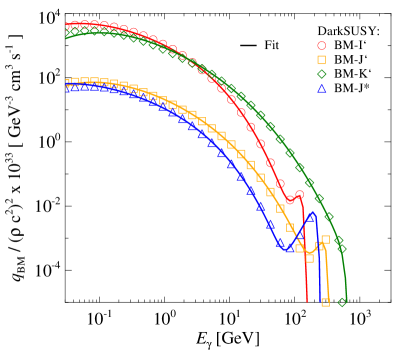
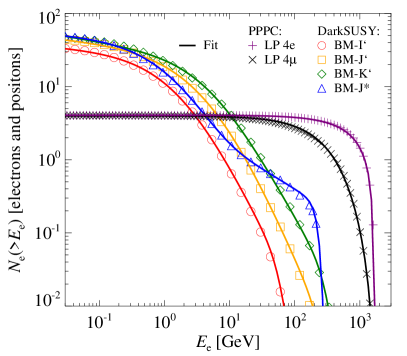
The differential energy spectrum for the IB process is more complicated (see Bergström (1989); Bringmann et al. (2008)), but can be computed using DarkSUSY. The differential photon energy spectra for all our BM models are shown in Fig. 1. The peaking at high photon energy and the resulting bump caused by inner bremsstrahlung is clearly seen for BM models , , and . Despite the different particle masses and cross sections, the spectrum of the continuum emission shows a remarkably similar shape which suggests that a simple rescaling of particle masses (responsible for the exponential cutoff in the spectrum) and cross sections (spectral amplitude) should yield a roughly scale-invariant continuum emission spectrum except for the presence of the final state emission feature which depends on the details of the specific decay channels. The right panel of Fig. 1 shows the cumulative number of leptons (electrons and positrons) above a given energy for our different DM models which is of interested for the high-energy IC emission of those leptons. Only LP models have energetic enough electrons such that the IC emission is powerful enough to either be constrained or detected at GeV energies and higher.
II.2 Astrophysical modeling of DM induced emission
We now turn to the detailed modeling of the surface brightness profiles of DM annihilation emission and discuss the DM profiles for the smooth distribution and substructures.
II.2.1 General equations
The differential photon flux within a given solid angle along a line-of-sight (los) is given by
| (8) |
where
| (9) |
and denotes the surface brightness above the photon energy . The integration along the line-of-sight , in the direction that the detector is pointing, is parametrized such that the radius of the source , where is the distance from the Earth to the center of the cluster halo and . The angular integration is performed over a cone centered around and the opening angle is typically taken to be a few times the point spread function (PSF) . The limited angular resolution results in a probability that a photon coming from a direction ’ is instead reconstructed to a direction , where the underlying probability distribution follow a Gaussian:
| (10) |
We denote the total differential source function by , where we include contributions from five main processes; leptophilic DM annihilating through (neglecting the produced neutrinos) where the pairs IC upscatter background photons (LP-IC), leptophilic DM emitting final state radiation (LP-FSR), supersymmetric DM BM models where annihilating neutralinos generate pairs that upscatter background photons (BM-IC) and emit a continuum as well as final state radiation (BM-Cont), and CR proton induced that decays into gamma-rays (CR-). The source function is given by
| (11) |
where the differential CR to gamma-ray source function is denoted by (see Sec. II.4 and Pinzke and Pfrommer (2010) for further details). The subscript runs over the gamma-ray producing DM channels and the total differential boost factor for DM is given by:
| (14) |
It is the product of enhancement factors from SFE (see Eq. 3 and Sec. II.1.1) and from substructure enhancement over the smooth halo contribution 555Note that if the boost from substructures is , then the Sommerfeld enhancement approaches the constant saturated boost of 530. (see Eqs. 28-31 and Sec. II.2.3). The DM source function from the smooth halo for each process is written in the form:
| (15) |
where the annihilation rate density is given by
| (16) |
Here, the subscript runs over all kinematically allowed gamma-ray producing channels, each with the spectrum and annihilation cross section . We denote the DM mass with and the smooth DM density profile with .
II.2.2 The smooth DM density profile
Typically the universal Navarro-Frenk-White (NFW) density profile provides a good fit to both the observed and simulated clusters. It can be considered as a special case of the more general 5-parameter profile:
| (17) |
Here, denotes the inner slope, is the outer slope, and is the shape parameter that determines the profile shape at the scaling radius that characterizes the transition between the different power-law slopes. A cuspy NFW profile is given by . The characteristic overdensity for an NFW profile is given by
| (18) |
where the halo mass dependent concentration parameter is derived from a power-law fit to cosmological simulations with Macciò et al. (2008),
| (19) |
This mass scaling agrees well with Zhao et al. (2009) for cluster-mass halos after converting the concentration definitions according to Hu and Kravtsov (2003). In this work we choose to model the DM density by an Einasto density profile
| (20) |
that is slightly shallower in the center than the conventional Navarro-Frenk-White (NFW) profile, but provides a better fit to recent simulated high resolution DM halos Merritt et al. (2006); Navarro et al. (2010). It should also be noted that recent observations of the Abell 383 galaxy cluster find a density profile with a shallower inner slope of compared to an NFW profile, and can be ruled out with % confidence Newman et al. (2011). These observations are based on lensing and X-ray measurements as well as the stellar velocity dispersion of the central galaxy. In Eq. (20) we denote the density where the profile has a slope of by , and the radius by . We use that the density and determine through :
| (21) |
Here for and since is a slowly increasing function with concentration , we fix it for simplicity to .
In the recent dark matter simulation literature, it has become standard to characterize halos by the value, , where the circular velocity attains its maximum:
Especially for subhalos, this quantity seems to be more stable compared to the virial mass that is subject to tidal stripping. For comparison, we quote typical values for a large galaxy cluster and a galaxy group:
| (23) | |||||
| (24) | |||||
II.2.3 Substructures
High-resolution dissipationless DM simulations of MW type halos find substantial amount of substructures in the periphery of DM halos, while the substructures in the center suffer from dynamical friction and tidal effects depleting their central number densities. Since the DM annihilation rate depends on the density squared, the resulting flux from substructures is boosted compared to the smooth density distribution. While there is still a discrepancy in the literature of the exact value of the predicted boost factor of the DM annihilation luminosity from substructures in DM halos, this inconsistency starts to become resolved, apparently converging toward predictions at the high end Springel et al. (2008b, a); Anderson et al. (2010). Following recent high-resolution simulations of Galaxy-sized halos, we adopt a boost factor due to substructures of 230 for such a halo Springel et al. (2008b) (which needs to be scaled to cluster halos as we will discuss below).
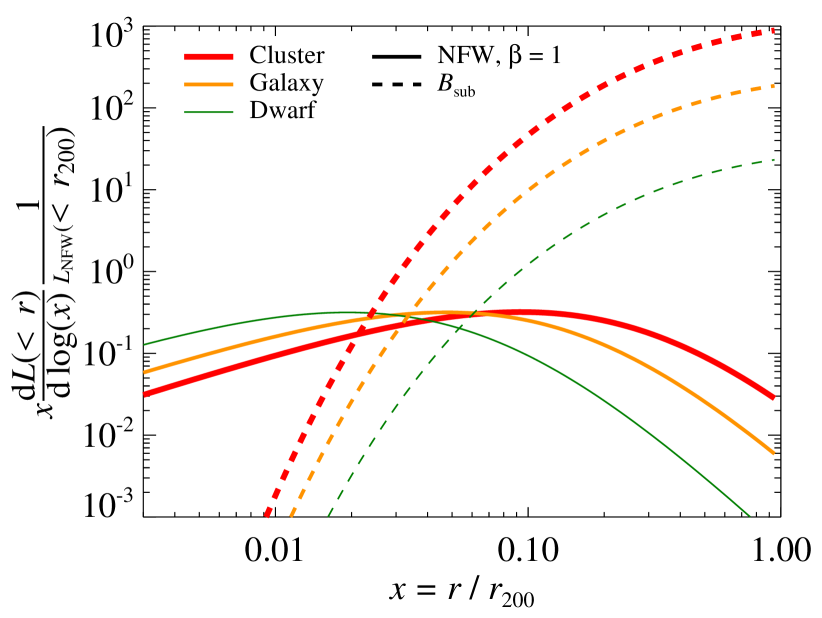
The initial suggestions of a small total boost () of order unity by the Via Lactea simulations Kuhlen et al. (2008) made assumptions of computing the boost assuming that the substructure luminosity follows that of the smooth DM distribution. Physically, this would imply substructure to follow the smooth DM distribution and a radially independent concentration parameter of substructures. Both assumptions are in conflict with tidal mass loss of satellites which is at work in simulations and cause the radial number density to be anti-biased with respect to the host’s mass density profile yielding a significantly flatter subhalo distribution compared to the smooth DM distribution Anderson et al. (2010). This increases the substructure boost preferentially in the outer parts of DM halos with a factor that ranges between 20 and 1000 (for dwarfs and galaxy clusters), hence depending sensitively on the host halo mass (see Figure 2). Recent Phoenix simulations by Gao et al. Gao et al. (2011b) confirm the large enhancement due to substructures in clusters. In fact they find a boost of 1125 for a Coma like cluster which agrees within 10% with our estimated boost (see e.g. Table 2).
We use a double power-law function to fit the luminosity from the smooth component of substructures (i.e. substructures within substructures are not included) inside radius which is determined for the Aquarius simulations Springel et al. (2008b, a).666Our approach of fitting the scaling behavior of directly from numerical simulations self-consistently accounts for the radial dependence of the substructure concentration due to tidal mass losses Springel et al. (2008b). Our best fit is given by
| (25) | |||||
Here, , denote our fit variables, is the luminosity from the smooth halo without substructures within and . We derive the normalization function in Eq. (LABEL:eq:Csub) from the simulations in reference Springel et al. (2008a) using a value of for the mass of the MW halo in the simulation and for the mass of the smallest resolved subhalos in the MW simulation. The smallest mass of subhalos in reality, , is determined from the free streaming length of DM at decoupling—an effect that erases structure on scales smaller than the free streaming length. In applying Eq. (LABEL:eq:Csub), we implicitly assume that the mass power-law scaling relation is valid down to the free streaming mass of DM halos. In the CDM universe, this is conventionally taken to be Hofmann et al. (2001); Green et al. (2005) (see Bringmann (2009) for a discussion of the range expected in various DM models). Note that potentially the power-law could flatten towards smaller mass scales although current simulations show no hints of such a behavior and since Einstein’s gravity is a scale-free theory, we do not expect such a behavior on theoretical grounds either. For DM halos more (less) massive than the MW we expect a larger (smaller) boost from substructures, simply because of the larger (smaller) mass range down to the minimum mass .
To motivate the scaling of the substructure luminosity boost with limiting substructure mass in Eqs. (25-LABEL:eq:Csub), we show how it derives from the substructure mass function, Springel et al. (2008b, a) and substructure luminosity scaling with the limiting mass of satellites, . The total luminosity of substructures scales as
Tidal truncation is responsible in shaping the substructure luminosity scaling parameter . Here we only sketch out qualitative arguments and leave details and comparison to numerical simulations to future work. First, tidal effects truncate the subhalo profile primarily in the outer regions. As a result of this, the subhalo acquires a steeper logarithmic slope than the canonical 3 from the NFW-profile. Second, tidal stripping imposes a mass-dependency and should be stronger for smaller substructure. The stripping efficiency (for an effective cross section ) only depends on the ambient DM density of the host halo, , which implies a scaling of the mean free path of a subhalo of . Since there is less mass at any given density for smaller substructures, modest density inhomogeneities within the host halo seen by the orbiting substructures cause a stronger mass loss of these smaller satellites. Third, the tidal truncation radius should be a function of host halo radius due to the increasing smooth density profile for smaller radii. If we pick an effective host halo radius which dominates the luminosity contribution of the substructures and were to fit the tidally truncated subhalo density profile with an NFW-profile, the resulting would be biased toward lower values implying a higher concentration compared to an isolated halo. In order to reproduce our value of , we would need a concentration mass relation of (employing the formula derived by reference Pinzke et al. (2009)). As expected, this is steeper than the concentration-mass relation found for isolated halos on dwarf galaxy scales, Ishiyama et al. (2011), as well as galaxy and cluster scales, Macciò et al. (2008).
We now derive the squared density profile for the substructures using
| (28) | |||||
| (29) | |||||
| (31) |
Here, represents the particle physics factor, where is defined by Eq. (15). The different density profiles have some impact on the luminosity from annihilating DM, although the details of the density profile can be neglected compared to the dominating boost from substructures (assuming DM to be cold). In Fig. 2 we compare the radial dependence of the accumulative luminosity from different smooth cluster density profiles to the boosted luminosity due to substructure for different mass scales. We recalculate the overdensity, , for the shallower density profile with and rescale the concentration parameter in Eq. (19) with Newman et al. (2011) to account for the more centralized scale radius in cluster with a shallow inner slope. The emission of this profile with is about 30% larger within compared to a cuspy NFW (). This difference is built up within (i.e. close to ). Hence the slope of the central part of a cluster has little influence for the DM luminosity within as long as the degeneracy in the lensing mass measurements with (which decreases for decreasing inner slope) has been taken into account. The emission from an Einasto density profile is about 50% larger than the cuspy NFW profile in the periphery of the cluster, where the difference is mainly built up at a few percent of . The increase in luminosity due to substructures is negligible in the center of halos, but integrated out to the boost relative to the smooth emission profile amounts to approximately 20 for dwarf galaxies, for galaxies, and for galaxy clusters. We stress that these boost factors are only realized in the region around the virial radius of each respective halo which is mostly tidally stripped for dwarfs in the MW. Hence a more realistic boost from substructures is probably much smaller in satellite dwarf galaxies. In addition, these boost factors are only realized for direct annihilation emission (continuum emission or final state radiation) or IC scattering off homogeneous seed photon fields (CMB). For IC scattering of SD photons, the overlap of final state leptons and SD photons is smaller which causes the substructure boost over the smooth emission to be reduced by roughly two orders of magnitudes. It should also be noted that the substructure boosted fluxes from clusters are much more extended than for dwarf galaxies, hence more difficult to detect with Cherenkov telescopes. In fact, it was shown in Sanchez-Conde et al. Sanchez-Conde et al. (2011) that inside , where the sensitivity of Cherenkov telescopes is maximized, the expected DM flux including substructures from the brightest dwarf galaxy is about an order magnitude higher than the brightest cluster. However, that work assumed a substructure boost of about 50 in the most massive cluster halos which is more than an order magnitude smaller than what we use in this work, hence in projection we expect this difference to be a factor few smaller.

In Fig. 3 we show the radial regions that dominate the DM annihilation luminosity, in particular we show the differential contribution to the DM luminosity per logarithmic interval in radius for three different mass scales. Solving for the maximum of this curve, in combination with Eq. (29), we find that the luminosity from the smooth NFW profile peaks at . Despite the cuspy nature of the density profile, the luminosity is not dominated by the central region but by the transition region where the profile steepens because of the larger volume available there. For large clusters with typical concentrations of , the luminosity from the smooth profile is focused to the regime around 10% of . In contrast, emission from substructures is mainly contributed by the outer parts of DM halos. As shown in Fig. 3, the product of annihilation emissivity and emission volume increases towards and only starts to drop outside this radius. Note that, even though most of the substructure mass density has been erased in the central regions of DM halos, a cluster in projection has a significant enhancement due to substructures at a radius of just a few percent of .
II.3 Inverse Compton emission
In this section we outline the basics of inverse Compton (IC) emission. As target radiation fields we consider cosmic microwave background (CMB) photons, and the light from stars and dust (SD). We derive an analytic model from which we can estimate the spectral and spatial distributions of SD as a simple function of cluster mass.
The standard IC source function is given by Rybicki and Lightman (1979):
where is the energy of the upscattering electrons and is the energy of the background photon field. We represent the Thomson cross section with and the full differential Klein-Nishina (KN) cross section is captured by Blumenthal and Gould (1970):
| (33) |
where
| (34) |
The full KN cross section accounts for the less efficient energy transfer between the photon and electron once the energy of the Lorentz-boosted photon in the electron rest frame comes close to such that the scattering electron experiences a significant recoil. This results in a steepening of the IC gamma-ray spectrum. In the low energy Thomson regime the IC spectrum , however when the IC spectrum steepens due to the KN suppression to . Here we denote the steady state electron spectrum by .
We account for two major contributions to the number density of radiative background fields ; the CMB photons and the infra-red (IR) to ultra-violet (UV) light emitted by SD. The number density for the SD is given by where the specific SD energy density is given in the Appendix, Eq. (52). We model the CMB photon spectrum as a photon gas that is isotropically distributed and follows a black body spectrum with the temperature K:
| (35) |
Note that the typical energy of a black body photon before scattering is given by , where and are the number- and energy-density derived by integrating and over the photon energy , respectively.
The electrons injected from annihilating DM also suffer from diffusive and radiative losses. Hence we have to calculate the equilibrium spectrum of the electrons plus positrons denoted by in Eq. (LABEL:eq:ICemiss). We derive this stationary solution using the cosmic ray transport equation (neglecting convection and re-acceleration effects):
| (36) | |||||
where denotes the diffusion coefficient and the energy loss term. The source function yields the number of electrons and positrons produced per unit time, energy and volume element at the position :
| (37) |
where the annihilation rate density is defined in Eq. (16). The sum runs over the kinematically allowed annihilation final states , each with a branching ratio and a differential spectrum that represents the number of electrons plus positrons resulting from an annihilation event. We use the differential spectra derived from high-statistics simulations in Ciafaloni et al. (2011); Cirelli et al. (2011) to compute the cumulative number of electrons and positrons resulting from neutralinos annihilate indirectly into pairs as well as pairs in the LP model. We use DarkSUSYto compute the spectra from our four BM models where only a fraction of the annihilating neutralinos is converted into electrons and positrons (see Sec. II.1 and Fig. 1 for further details).
The electrons and positrons loose their energy on a timescale that is shorter than the diffusive timescale in the ICM of galaxy clusters for cosmic ray electrons which is larger than the Hubble time in our energy range Berezinsky et al. (1997); Enßlin et al. (2011). Hence, we neglect the first term of the r.h.s. in Eq. (36), and derive an expression for the equilibrium number density:
| (38) | |||||
| (39) | |||||
| (40) |
Here we include the three main radiative loss processes for the cosmic ray electrons and positrons: (1) IC losses on CMB photons with the equivalent field strength of the CMB of , where is the cosmological redshift. (2) Synchrotron losses on ambient magnetic fields where we parametrize the magnetic field in the galaxy cluster by . We adopt a magnetic decline of in this work which follows from flux frozen magnetic fields. (3) IC losses on starlight and dust with an energy density given by Eq. (A.2), where we outline the derivation in the following.
The emission of galaxy clusters at infra-red (IR) and ultra-violet (UV) wavelengths emerges from dust and starlight in both the galaxies and the ICM (e.g. Porter et al. (2006) and Gilmore et al. (2009)). Three distinctive components dominate these wavelengths: a central galaxy, the intra-cluster light (ICL), and individual cluster galaxies. We decided to use the accurately measured spectral shape of dust and starlight in the interstellar medium of our Galaxy to model the emission from clusters. We then normalize the two spectral components – far IR dust and starlight at wavelengths ranging from the near IR to UV – individually by using stacked cluster data and employ a measured mass-to-starlight luminosity scaling relation derived from observations of the brightest cluster galaxy (BCG) Haarsma et al. (2010).
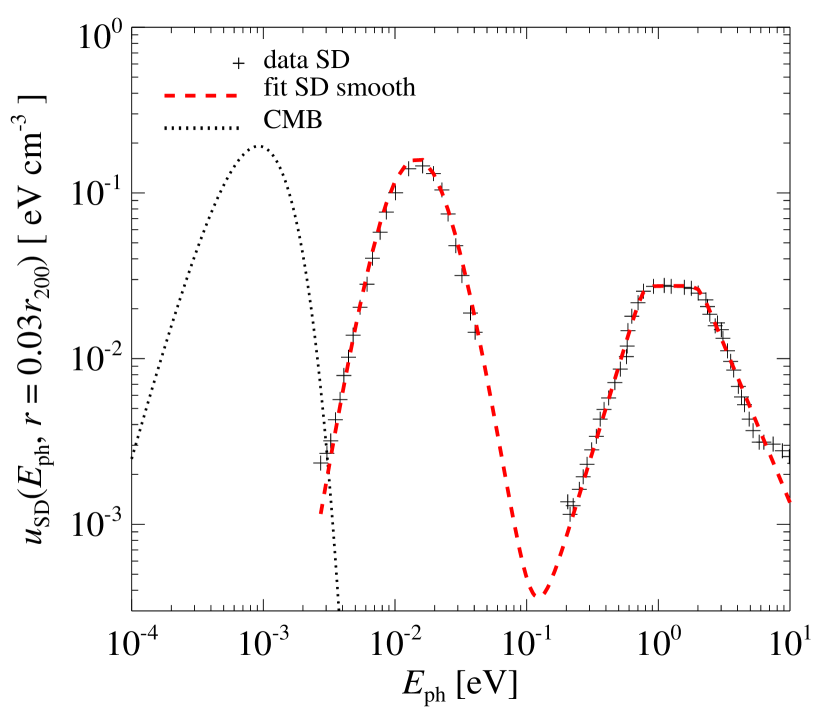
In Fig. 4 we characterize the spectral shape through a fit to the galactic spectra presented in Porter et al. (2006). The figure is showing the spectra at , which is the radius there the SD energy density of a galaxy cluster equals the energy density of the CMB black-body distribution. Inside this central radius the SD component is dominating, which is shown in Fig. 5 where we compare the energy densities from different radiation fields in a galaxy cluster with the mass . For this figure we use two different profiles for the SD energy density, where the total profile includes the contribution from the ICL, the BCG and all the galaxies, while the galaxies are excluded in the smooth profile. To compute the IC emission from SD, we require a non-negligible overlap of the relativistic lepton distribution resulting from DM annihilation and SD. In fact, one can show with a simple order of magnitude calculation that the overlap, , of the photon field of individual galaxies (starlight and dust emission) and the smooth DM density is very small so that we can neglect the starlight contribution from galaxies to the IC emission for the reminder of this work,
| (41) |
Here we assume that the exponential scale height of the stellar light is less than the scale radius of the galaxy halo, and . We denote the number of galaxies within with and the concentration of a galaxy DM halo with .
We find that even for a cluster with a relative small mass the energy density of the SD components dominates over the CMB and the magnetic fields (with a central B field of 3 ) within about 10% of . Outside this radius the CMB is dominating the energy density of the cluster. Note that while the magnetic field is always subdominant in the cluster for our assumptions, we keep its contribution to the total energy density for consistency. Also note that we extract the spatial distribution of the SD light in clusters from a stacked emission analysis of Sloan Digital Sky Survey (SDSS) data at the redshift Zibetti et al. (2005) and do not attempt to correct for a potential evolution in this component (c.f. Fig. 22).
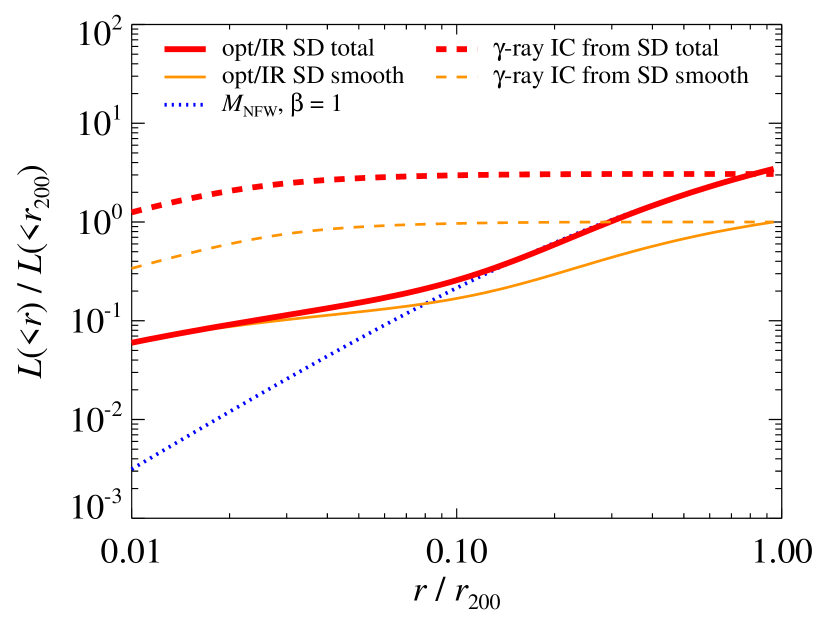
The spatial distribution of far-IR to UV light emitted by SD is quite different from what is expected for the IC upscattered SD photons. We illustrate this in Fig. 6, where the accumulative luminosity from SD is compared to the IC SD photons for a cluster where the boost from substructures is excluded. The gamma-ray luminosity from IC upscattered SD photons is dominated from the inner parts where there is the largest overlap of the cuspy DM profile and the peaked SD distribution. This is in marked contrast to the accumulative SD luminosity in the optical that is dominated by the outer parts of the cluster. Interestingly, it rises as a function of radius and follows the distribution of an NFW mass profile outside . In the center, the electrons and positrons mainly cool by IC upscattering SD photons, hence the spatial dependence of the cooling cancels the distribution of the SD source function, which results in a distribution that approaches a density square profile in the center. We also find that the luminosity within from the total SD model is a factor three larger compared to the more realistic smooth SD model.

II.4 Cosmic-ray induced gamma-ray emission
In supernovae remnants and on scales of galaxies, there are convincing evidences of non-thermal populations. Especially, in the MW, the cosmic rays are observed directly as well as indirectly through radio, X-ray, and gamma-ray emission. On larger scales of the order of few 100 kpc up to Mpc, there are currently a vast number of observations of radio emission coming from radio mini halos in the centers of cooling flow clusters, radio relics in the periphery of clusters Kempner et al. (2004), as well as giant radio halos amounting to a total number of more than 50 diffuse radio sources in clusters Feretti (2003); Ferrari et al. (2008). This type of emission is expected in clusters since the formation process of a galaxy cluster is a very energetic processes that induces both turbulence as well as frequently occurring merging and accretion shocks which both are thought to accelerate relativistic non-thermal protons and radio emitting electrons to high energies. The precise origin of these electrons, in especially relics and giant radio halos, is still not settled. One possible scenario for the production of these electrons are hadronic CR interactions with ambient gas protons which results in charged and neutral pions that decay into electrons, neutrinos, and gamma-rays (see Dennison (1980); Vestrand (1982); Blasi and Colafrancesco (1999); Dolag and Enßlin (2000); Miniati et al. (2001); Miniati (2003); Pfrommer and Enßlin (2004a, b); Pfrommer et al. (2008); Pfrommer (2008); Kushnir et al. (2009); Donnert et al. (2010b, a); Keshet and Loeb (2010); Enßlin et al. (2011) ).777An alternative scenario is the second order turbulent re-acceleration through the interaction of a previously injected relativistic population of electrons by supernova driven winds or active galactic nuclei with plasma waves and magneto-turbulence. Schlickeiser et al. (1987); Giovannini et al. (1993); Brunetti et al. (2004); Brunetti and Blasi (2005); Brunetti and Lazarian (2007, 2011); Brunetti et al. (2009) Supporting evidence comes from the smoothness of the extended radio emission that often resembles that observed in thermal X-rays. This can be easily explained in the hadronic model since the long cooling time of cosmic ray protons (CRs) of order the Hubble time allows for a cluster-filling population of CRs to build up over the formation history Völk et al. (1996); Ensslin et al. (1997); Berezinsky et al. (1997). The production of these secondaries depend both on the gas and CR densities in the cluster, where the CR density roughly traces the gas outside the core regime and is slightly enhanced in the center. This density scaling implies that clusters are great targets for Cherenkov telescopes with a high sensitivity for the central parts of nearby clusters. Detecting the cluster gamma-ray emission is crucial in this respect as it potentially provides the unique and unambiguous evidence of CR populations in clusters through observing the bump at about 100 MeV in the spectra.
We adopt the universal spectral and spatial gamma-ray model developed by Pinzke & Pfrommer Pinzke and Pfrommer (2010) to estimate the emission from decaying :s that dominates over the IC emission from primary and secondary electrons above 100 MeV in clusters. The gamma-ray formalism was derived from high-resolution simulations of clusters of galaxies that included radiative hydrodynamics, star formation, supernova feedback, and followed CR physics using a novel formulation that trace the most important injection and loss processes self-consistently while accounting for the CR pressure in the equation of motion Jubelgas et al. (2008); Enßlin et al. (2007); Pfrommer et al. (2006). We highlight two main uncertainties of the models, namely the acceleration efficiency at formation shocks and CR transport parameters. First, we note that the overall normalization of the CR and gamma-ray distribution scales with the maximum acceleration efficiency at structure formation shock waves. Following recent observations at supernova remnants Helder et al. (2009) as well as theoretical studies Kang and Jones (2005), we assume the maximally allowed acceleration efficiency for strong shocks that transfers 50% of the shock-dissipated energy (kinetic energy corrected for adiabatic compressional heating at the shock) to CRs. These efficiencies drop quickly for weaker shocks Enßlin et al. (2007) which dominate the gravitational energy dissipation inside galaxy clusters Pfrommer et al. (2006). These efficiencies will have to be corrected down if this value is not realized at strong structure formation shocks. Second, these simulations (and by extension the analytic model) neglect active CR transport such as streaming and diffusion relative to the gas, i.e., we assume that advective transport dominates and CRs are tightly coupled to the gas via magnetic fields tangled on sufficiently small scales which produces centrally enhanced profiles. However, CR diffusion and streaming tends to drive the CR radial profiles towards being flat, with equal CR number density everywhere. While the CR streaming velocity is usually larger than typical advection velocities and becomes comparable or lower than this only for periods with trans- and supersonic cluster turbulence during a cluster merger. As a consequence a bimodality of the CR spatial distribution may result with merging (relaxed) clusters showing a centrally concentrated (flat) CR energy density profile Enßlin et al. (2011). This translates into a bimodality of the expected diffuse radio and gamma-ray emission of clusters, since more centrally concentrated CR will find higher target densities for hadronic CR proton interactions Enßlin et al. (2011). As a result of this, relaxed clusters could have a reduced gamma-ray luminosity by up to a factor of five.
III Gamma-ray spectra
Spectrally resolved indirect DM searches have the advantage of probing different DM models through their characteristic spectral distributions. To make current and future DM searches more effective it is important to know in which energy band to focus the efforts in order to maximize potential DM signals over the expected background.
We focus in this section on the spectral distribution of gamma-rays from clusters. In the LP model, DM annihilation radiation includes final state radiation and gives rise to substantial amounts of electrons and positrons that IC upscatter background radiation fields to high energies. We also consider four supersymmetric DM models with a high gamma-ray yield in the form of continuum emission and IC induced emission. In addition to the annihilating DM, we estimate the gamma-ray flux induced by shock-accelerated CRs. Note that all fluxes in this section are derived within an angle corresponding to and are convolved with a PSF of .
We compare the calculated fluxes to gamma-ray upper limits (95% c.l.) set by Fermi-LAT after 18 months of observations Ackermann et al. (2010). In particular, to achieve a more reliable comparison we adopt, if nothing else is stated, the maximal spatially extended limits since the gamma-ray flux from our brightest clusters all have an angular extent on the sky when the boost from substructures is included. In fact, published Fermi upper limits are not derived for the kind of extended emission that we find with our treatment of substructures, hence these Fermi limits may not be adequate for some of these clusters. This and other recent work highlights that the improved substructure models imply that Fermi limits will have to be re-calculated to accommodate for the large source extensions. Note, however, that for most clusters the assumption of a point source is well justified. The flux upper limits, that we compare to, are a function of spectral index . However, in the relevant energy range, GeV, the spectral index varies within . This changes the photon flux upper limits by , with Fermi-LAT being more sensitive to a hard spectrum Ackermann et al. (2010).
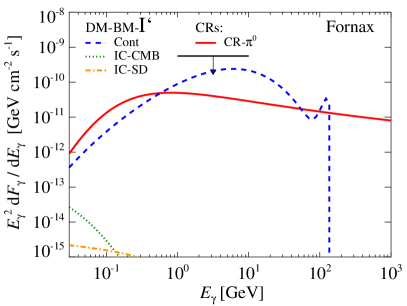
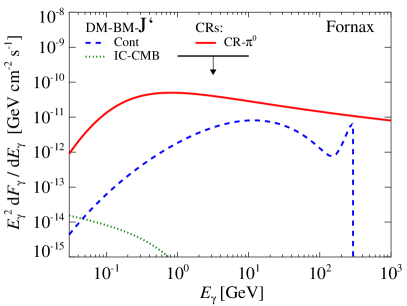
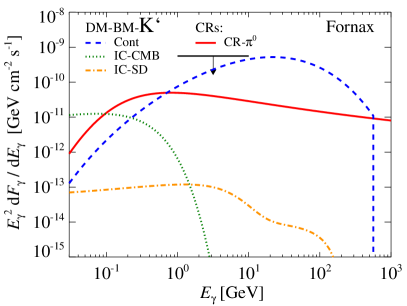
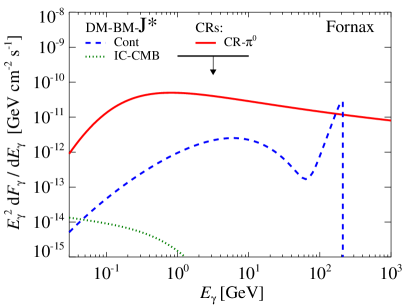
In Fig. 7 we show the differential flux from the Fornax cluster which is one of the best clusters for indirect DM searches due to its high DM annihilation fluxes and low CR induced fluxes. We show the emission of four different supersymmetric BM models and contrast it to the emission induced by CRs. Comparing this emission to the differential gamma-ray upper limits set by Fermi-LAT, we find that the upper limits are not violated. The predicted DM flux that is dominated by the continuum emission from and models (shown in the left panels) are about a factor few below the upper limits, making it hard for Fermi to probe these kind of DM models in the near future without a significant improvement in the analysis from e.g. stacking of clusters and improved methods for analyzing extended sources. Furthermore, the gamma-ray signal induced by CRs is expected to be about a factor 10 below the DM continuum flux from the and BM models at 10 GeV. However, the IC emission from upscattered CMB and SD photons is at least a factor of a few lower for and a factor 1000 lower for , than the expected flux from CRs above 100 MeV, making it very hard to distinguish such a signal from the foreground due to the similar spectral index. For energies below 100 MeV we expect IC emission by primary shock accelerated electrons to be dominating Pinzke and Pfrommer (2010) over the supersymmetric DM induced leptons. Hence in clusters, the IC emission from supersymmetric DM BM models can be neglected compared to the CR pion and DM continuum emission.
For the LP DM models, however, the main contributions to the expected extended gamma-ray flux is coming from the IC upscattered photons on various photon background fields. Depending on the spatial and spectral distribution of electrons and positrons as well as the photon background fields, the resulting spectral distributions of gamma-rays can differ greatly. Hence it is interesting to understand which spectral features and energy regimes are dominating.
If the enhancement due to substructures in clusters is significant, then the distribution of electrons and positrons follows the radial profile of substructures outside the cluster center where the smooth DM density profile is dominating. In addition, the cooling of the steady state electron and positron distribution is dominated by SD photons in the center. Especially since the SD distribution is centrally peaked and the substructure distribution peaks in the outskirts around , the overlap between electrons/positrons and SD photons is small. This results in a suppression of the IC upscattered SD photons relative to the IC upscattered CMB photons, the final state radiation, and the continuum emission. However, if substructures are only marginally dominating over the smooth distribution in a cluster, the SD component becomes relatively more important.
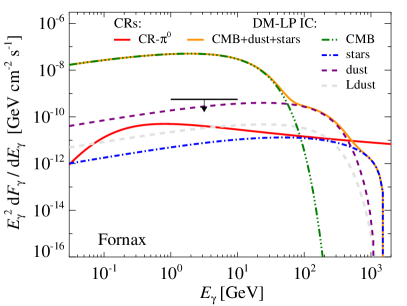
In Fig. 8 we show the total IC emission as well as its individual contributions from different IC upscattered radiation fields. The left panel shows the gamma-ray emission from the LP model and the right panel from the BM model, and for comparison we overplot the emission expected from the CRs. Due to the flat electron and positron spectrum resulting from the LP DM model and the smaller mean energy of the CMB compared to the SD, we find that the upscattered CMB photons dominate the total DM IC emission in the energy regime below 100 GeV, while the SD dominate above this energy. For the BM models, this transition energy is shifted towards smaller energies since the electron and positron spectrum has a steeper spectral distribution (see Fig. 1). At the highest gamma-ray energies of about 100 GeV and above, the IC from starlight steepens because it probes the high energy tail of the electrons and more importantly, it suffers from the Klein-Nishina suppression. When substructures are present, most of their flux resides in the outer parts of clusters. However, if we remove the boost from substructures, the density profile of electrons and positrons is more centrally peaked, and the relative importance of the IC upscattered SD increases by a factor (see Fig. 8)888Note that for the leptophilic DM model this increase is much smaller since Sommerfeld enhancement is no longer dominated by the low velocity DM particles living in the subhalos (see Sec. II.1.1 for more details).. A larger fraction of electrons (in the core) will now also cool by Compton-upscattering SD photons which suppresses the IC-upscattered CMB light. For comparison, we include the contribution of IC upscattered SD photons and to bracket the uncertainty in the SD model, with a smaller amount of dust. In this low-dust model, we have reduced the energy in dust by a factor 10. However, the resulting flux from the IC upscattered dust in this model only decreases with a factor that is slightly smaller than 10 since the IC cooling of the electrons and positrons also decreases.
Because of the large total boost factor for the LP model (), we overproduce the upper gamma-ray limit in the GeV energy interval set by Fermi-LAT by about a factor 100. This strongly constrains the boost from both substructures and the SFE. Additionally, these constraints might improve with future more sensitive Cherenkov telescopes such as CTA. However, considering that an indirect detection of DM in clusters relies on the boost from substructures whose main contribution comes from the periphery, we conclude that the wide angular extent of clusters on the sky in gamma-rays suggest that these sources are not ideal for Cherenkov telescopes since their sensitivity drops linearly with source extension.

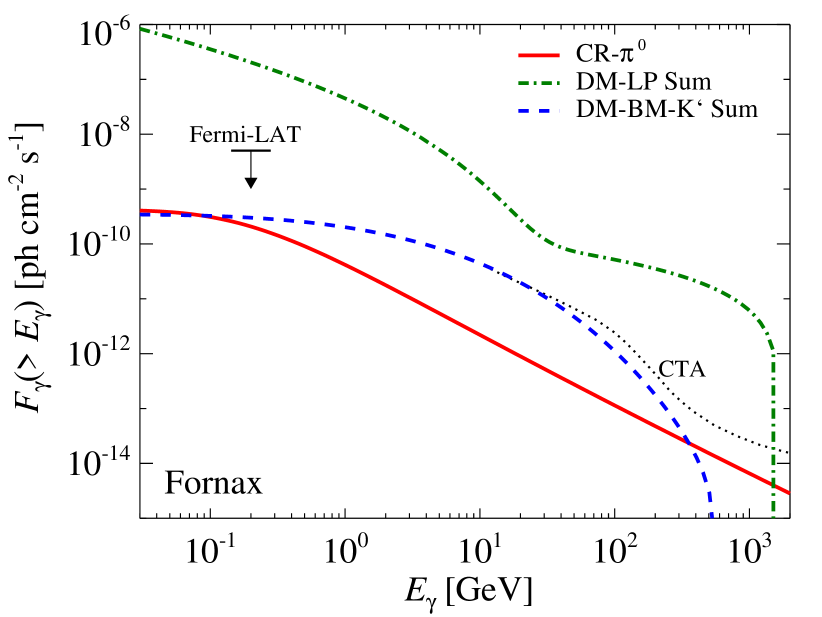
It is also interesting to compare the total contribution from the LP model, the brightest BM model (), and the CR induced emission. In Fig. 9 we show the integrated flux from Fornax for our different gamma-ray models and compare it to the unresolved integrated flux upper limit on Fornax set by Fermi-LAT where they averaged the flux over the energy range assuming a spectral index of 2. Again, the annihilation flux in the LP model is in conflict with the upper limits by Fermi-LAT, although only by a factor of 30 which is a factor few less constraining than the differential flux in the energy range GeV. As shown in this figure, the LP model is dominating the entire gamma-ray energy range up to the DM rest mass energy in this model of about 1 TeV. Finally, we note that the flux the DM BM model is larger than the predicted emission from the CRs in the GeV energy regime. Hence, for an experiment with a high sensitivity even for extended sources, the prospects for detecting the BM model over the expected gamma-ray background induced by CRs looks promising in clusters. Present day Cherenkov telescopes, however, have a trigger region that is smaller than the size of clusters, hence it has to be increased to several degrees to overcome problems with background estimation. In addition, even though the projected CTA point source sensitivity (, 50h) shows the potential of this experiment in constraining leptophilic models as well as BM models with a very large neutralino mass TeV, we find that analysis techniques have to be developed that enable the detection of extended sources without too much degradation of sensitivity.
We continue by comparing the estimated differential flux from Fornax to three other clusters in Fig. 10; the close-by and well studied Virgo cluster, the X-ray bright Perseus clusters, and the massive merging Coma cluster. We summarize in Table 2 the expected gamma-ray flux in our DM and CR models and the corresponding boost factors. We find high DM induced gamma-ray fluxes from the Fornax and Virgo clusters, which confirms them as promising targets for indirect DM searches. Especially in the GeV energy range it is quite striking how constraining the upper limits are for some of the clusters. At these energies, Fermi-LAT has its peak sensitivity due to a combination of increasing effective area and decreasing source spectra as a function of energy. The upper limits for Virgo and Perseus are unfortunately background contaminated by AGN activity from M87 and NGC 1275, respectively, and do not gain much from the increased sensitivity. In addition, the angular radius of Virgo is about , while the extended upper limit from Fermi-LAT is calculated assuming a radius. In fact, the ratio of the virial radius to the assumed extension for the upper limits for Fornax, Coma, Virgo are , respectively. Similarly, it is interesting to compare the radius that contains 68% of the flux to the assumed extension, , which is given by for Fornax, Coma, Virgo, respectively. This further motivates a re-calculation of the Fermi upper limits to account for the full extension of the galaxy clusters. We also find that the theoretical expectation of a high CR-induced flux in Coma and Perseus may significantly complicate indirect DM searches in those clusters if the boost factors are much lower than assumed in this work. The Fornax cluster, however, is a great target for indirect DM studies because the relative low gamma-ray flux from CRs, absents of an active AGN, and high DM gamma-ray flux.
What is the figure of merit for selecting the most promising cluster targets for indirect DM searches? To this end, we employ the luminosity-to-mass scaling relations. The gamma-ray luminosity from the smooth density profile is given by Pinzke et al. (2009)
| (42) |
and the total DM luminosity that includes boost factors for the LP and the BM models is given by
| (43) | |||||
| (44) |
We note that the IC from upscattered SD photons scales slightly softer with mass, hence gives rise to a larger fraction of gamma-rays in low mass clusters compared to the total gamma-ray flux. Also note that we have not included the SFE for the LP model in Eq. (43) since it saturates to a constant value in the substructures. However, if only a small fraction of the DM resides in the subhalos, i.e. the scaling of the LP DM becomes shallower due to the mass dependence inferred from the velocity dispersion:
| (45) | |||||
| (46) |
| Cluster | : | : | (1) | (1) | (2) | (3) | |||||
|---|---|---|---|---|---|---|---|---|---|---|---|
| DM-LP(4) | DM-BM-(5) | CR-(6) | DM-LP(4) | DM-BM-(5) | CR-(6) | [Mpc] | |||||
| Coma | |||||||||||
| Perseus | |||||||||||
| Virgo | |||||||||||
| Fornax | |||||||||||
Notes:
(1) The mass of Fornax, Coma, and Perseus are derived from Chen et al. (2007), while the mass of Virgo is derived from Tully and Shaya (1984). The luminosity distance to Fornax, Coma, and Perseus are derived from Chen et al. (2007), while the distance to Virgo is derived from Mei et al. (2007). All distances and masses assume .
(2) The boost due to Sommerfeld enhancement. The first value shows the saturated Sommerfeld boost realized when substructures are present, the latter is the Sommerfeld boost without substructures (see Sec. II A 1).
(3) The boost due to substructures relative a the smooth DM distribution. We integrate the emission in a cylinder with a radial extent of along the line-of-sight and an angular size corresponding to (both measured from the cluster center).
(4) The total gamma-ray flux from leptophilic (LP) DM where both the boost from substructures and Sommerfeld enhancement are included. Note that all these values are in conflict with upper limits from Fermi (see the following sections for detail).
(5) The total gamma-ray flux from the supersymmetric benchmark (BM) model where the boost from substructures is included. See Secs. II A 2 and II B 3.
(6) Gamma-ray flux induced by CR protons. See Sec. V C.
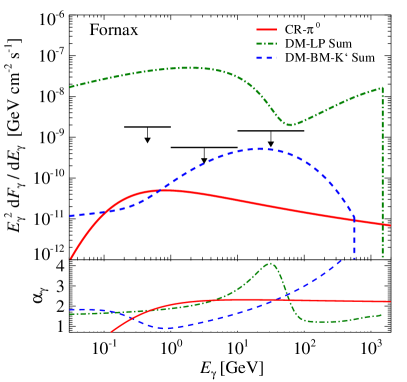
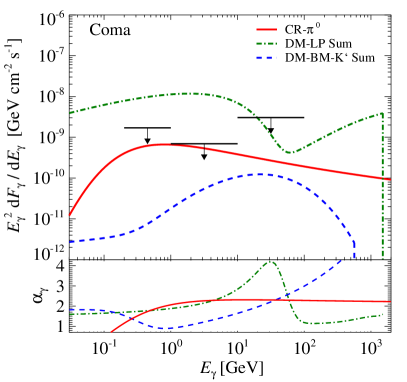
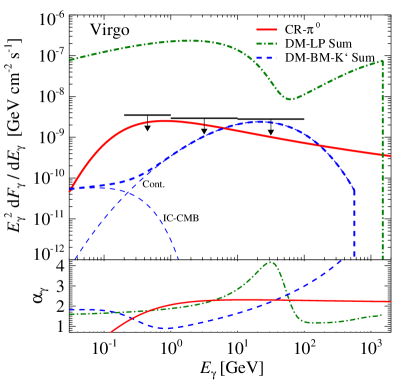
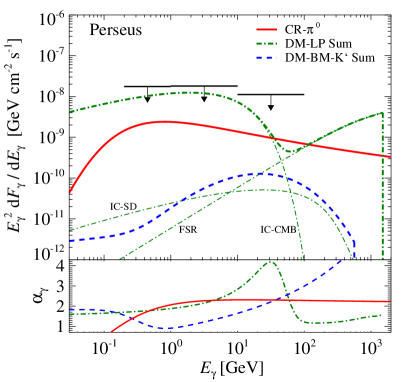
In the lower panels of Fig. 10, we also provide the differential spectral index, , for the different emission models. We find very similar spectral indices for different clusters assuming a substantial boost from substructures, while for models without substructures the relative contribution from the upscattered dust and starlight breaks the spectral universality for the DM models. In the energy regime the CR spectral index is approximately constant , while the spectral index for the LP model varies substantially between , hence implying that gamma-ray upper limits are more sensitive to the specific energy regime for these models. Similarly, the index for the BM model is about 1.0 at 1 GeV and increases monotonically toward higher energies. To maximize photon count statistics, experiments calculate band-integrated fluxes which implies a fixed spectral index over that energy range. Hence, we show in Table 3 for our emission models in four different energy bands. We find smaller variations for the banded -values, hence reducing the importance of the specific energy regimes.
| Model | ||||
|---|---|---|---|---|
| CR- | 1.44 | 2.24 | 2.30 | 2.26 |
| DM-LP Sum | 1.74 | 2.20 | 3.06 | 1.30 |
| DM-BM- Sum | 1.28 | 1.22 | 2.23 | - |
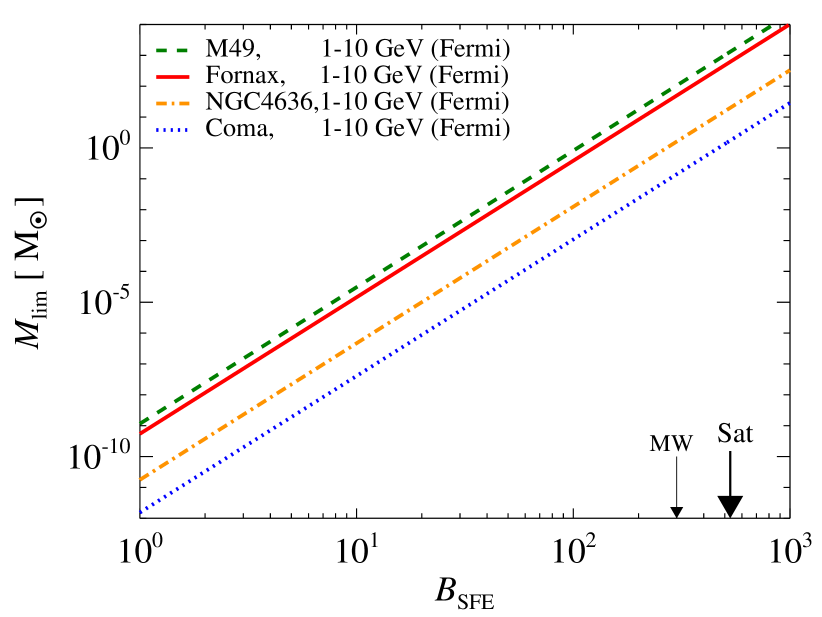
In this section, we have found that the LP DM models overproduces both the spatially extended differential and integrated gamma-ray flux upper limits set by the Fermi-LAT 18 month data for several clusters. We can use these upper limits to constrain the boosts due to SFE and substructures. Furthermore, as more sensitive experiments and better upper limits emerge, we can start ruling out models that give rise to boost factors that are manifested in the gamma-ray flux. It is especially interesting to constrain the SFE, where a boost of the particle physics cross section of 300 is required to explain the excess of electrons and positrons observed in the vicinity of Earth by PAMELA/Fermi/H.E.S.S. In Fig. 11 we use the estimated flux within of four bright and maximal constraining clusters (Fornax, M49, NGC4636, and Coma, where we have excluded Virgo due to its large angular extent) to limit the SFE as well as the minimum mass of substructures where . We find that M49 and the Fornax cluster are the most constraining clusters, although the current upper limits are not good enough to rule out the boost from substructures or SFE. Assuming that measured excess is due to SFE DM, then in order not to overproduce the differential gamma-ray upper limits set by Fermi-LAT in the energy range999We average the LP DM flux in the energy range GeV before we compare it to the upper limits. GeV, we can constrain the smallest mass of substructures to . Instead, assuming the standard mass of the smallest substructures of , we can constrain the saturated boost from SFE to in M49 and Fornax, which corresponds to a maximum SFE in the MW of . Hence, we conclude that without substantial improvement in the modelling of these extended sources, Fermi-LAT will not be able to rule out LP models in their current form using clusters but can put impressive constraints on them.
IV Surface brightness profiles
The large angular extent of clusters on the sky in combination with the small PSF of most gamma-ray probes () suggest that we would be able to probe the different spatial regimes of a cluster. Especially important is the spatial distribution of the gamma-ray emission as it biases upper limits derived for spatially extended clusters where a simple profile is often assumed. In fact, we will show that if DM substructures are present with the discussed abundances, the gamma-ray brightness profile is almost flat and very different from the gamma-ray distribution following a smooth density profile with a steep outer surface brightness slope of .
In this section we investigate the gamma-ray surface brightness profiles induced by both CRs and different models of DM in more detail. We start by comparing the intrinsic surface brightness that includes substructures from different clusters in Fig. 12. As expected, we find that the DM flux in all clusters follows the same universal shape imposed by the substructures. Already at , we are dominated by the substructures due to the projection of their peaked distribution the outer cluster regions (see Sec. II.2.3 for a longer discussion). This implies that the spatial distribution of annihilating DM is independent of the type of DM model, and can not be used to separate different models. The surface brightness, , of the DM scales as , which explains the factor two difference in normalization between the most massive cluster Coma and the least massive cluster Fornax with a mass ratio of about 10. The surface brightness induced by CRs is proportional to the projected squared gas profile with an additional enhancement in the center of cool core clusters due to the adiabatic compression of CRs during the formation of the cool core. Hence, we see a much larger variation in these profiles driven by the large variation of the gas mass fraction. It is noticeable that Fornax shows a small surface brightness. This is explained by the low gas density outside the BCG and the expected small abundance of CRs in a small cluster in comparison to a massive cluster Pinzke and Pfrommer (2010). This is the reason why Fornax is a good target for indirect DM searches, and superior to DM searches in dwarf galaxies.

To quantify the impact of substructures on the spatial profiles in more detail we again turn to the Fornax cluster and show in Fig. 13 a comparison of surface brightness profiles with and without substructures. It is quite remarkable how flat the profiles become when substructures are present compared to the case without. This implies that the relative flux within the PSF in the center is comparable to the outer parts, which should increase the signal-to-noise significantly. If we assume that – for some reason – substructures are suppressed in the Fornax cluster, then the expected signal from DM is swamped by astrophysical backgrounds over the entire extent of the cluster, even though Fornax has one of the highest ratios of DM to CR induced gamma-ray brightness.

In order to learn about the spatial distribution of the DM flux in various clusters for different DM models and the associated gamma-ray components, we show in the left panel of Fig. 14 the brightness profiles for the smooth DM distribution for the same four representative clusters that were shown previously in Fig. 12. We find that the surface brightness, of the DM emission above 1 GeV in the outer parts of all clusters have the same shape. In addition, we show the spatial dependence of the individual gamma-ray components for the Fornax cluster in the right panel. We see that in the BM model, the emission is dominated by the continuum emission. In the LP model, the emission at intermediate and large radii is dominated by IC-upscattered CMB photons while at small radii, IC-upscattered SD photons dominate the emission. The fact that the sum of both IC components resembles the profile of the BM model is not surprising: in this energy range, all the energy of the annihilation is imparted on leptons which radiate all their energy away through IC emission and the sum of the IC components represents a calorimeter for these radiating leptons. We note that the surface brightness due to SD upscattered photons dominates over larger central regions for energies GeV (cf. Fig. 8). Furthermore, since there is no enhancement from substructures, the overall mass normalization of the LP DM model has a marginally negative trend . Hence, we only see a very small difference in outer parts of the different clusters from these type of models. The DM BM models scale as , hence more massive clusters show a slightly higher surface brightness. Finally, we note that the flux from DM without substructures is dominated by the CR induced emission for all clusters.
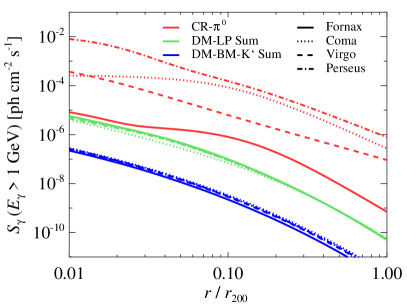

In Sec. III we saw that the spectral distribution of gamma-ray flux from the LP model was dominated at high energies of GeV by final state radiation and IC upscattered starlight and dust, while the BM models were mainly dominated by the continuum emission. These high energies are observationally important for both Fermi-LAT and Cherenkov telescopes. In Fig. 15, we thus show the surface brightness above GeV for a realistic PSF of where we include the boost from substructures. We investigate two clusters with an expected high DM signal; the Fornax and Virgo cluster. Both clusters show a very flat brightness profile , due to both the effect from substructures and the convolution with the PSF. The CR induced emission also show a smoothing of the central parts due to the PSF. In the outer part of the Fornax cluster the CR flux is suppressed compared to the DM flux boosted by substructures, where the LP model gives rise to a gamma-ray flux that is more than three orders of magnitude larger. However, it should be noted that there are large uncertainties in the gas density profile which we use to estimate the CR induced gamma-ray surface brightness (see Fig. 23 for more details).

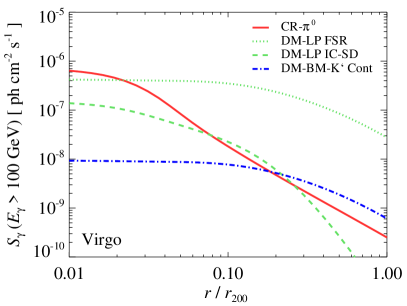
V Population studies: flux predictions and observational limits
In this section, we compute the expected gamma-ray fluxes from DM annihilation and CR interactions of the brightest clusters of the X-ray flux-complete sample in the local universe. All fluxes in this section are derived within an angle corresponding to ; in addition we neglect the convolution with the PSF if nothing else is stated. We confront these predictions to upper limits obtained by Fermi 1.5-year data and conclude on the viability of the underlying models and perspectives for the next years of Fermi observations.
V.1 Scaling relations
First we focus on gamma-ray flux-cluster mass scaling relations for DM annihilation and CR induced emission in Fig. 16.
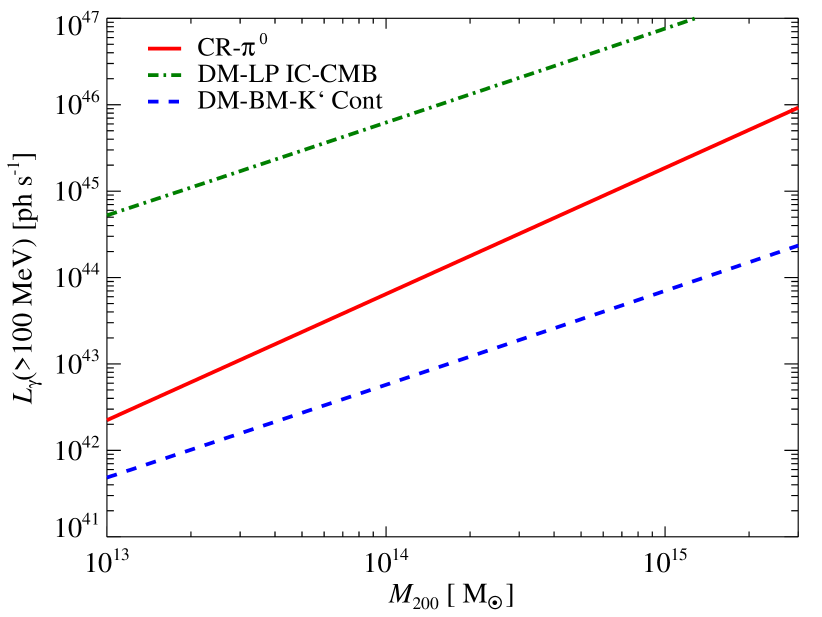

The mass scaling of the substructure boost steepens the intrinsically shallower DM annihilation relation in Eq. (43) to . However, the CR scaling relation is still considerably steeper as shown by reference Pinzke and Pfrommer (2010):
The CR luminosity scaling relations101010The scaling relations show the flux inside and do not include the contribution from galaxies. Also note that in this paper the scaling relations are normalized at . In contrast, the corresponding scaling relations in Table 5 in Pinzke and Pfrommer (2010) are normalized at instead of the mentioned in the caption. However, all figures/tables/equations including the scaling relation figures in Pinzke and Pfrommer (2010) are derived for masses in units of . include the IC gamma-ray contribution from shock-accelerated primary electrons as well as secondary electrons created in CR-proton interactions. However, the gamma-ray flux is dominated by the decaying neutral pions. The difference in the mass scaling arises from the larger contribution of primary IC emission for higher-mass clusters at 100 MeV that have a larger fraction of radio relics due to their greater mass accretion rates in comparison to galaxy groups—a direct consequence of hierarchical growth of structure Zhao et al. (2009); Pfrommer et al. (2011). The steeper mass scaling of CR emission compared to DM annihilation already implies a general strategy to minimize the CR-induced foreground for DM annihilation and argues for very nearby groups. We note that these simulations do not include AGN feedback that is thought to furthermore reduce the baryon fraction in groups relative to that in clusters Puchwein et al. (2008). The resulting smaller target density for hadronic CR interactions steepens the relation of CR induced emission, making the case for groups even stronger.
V.2 DM annihilation
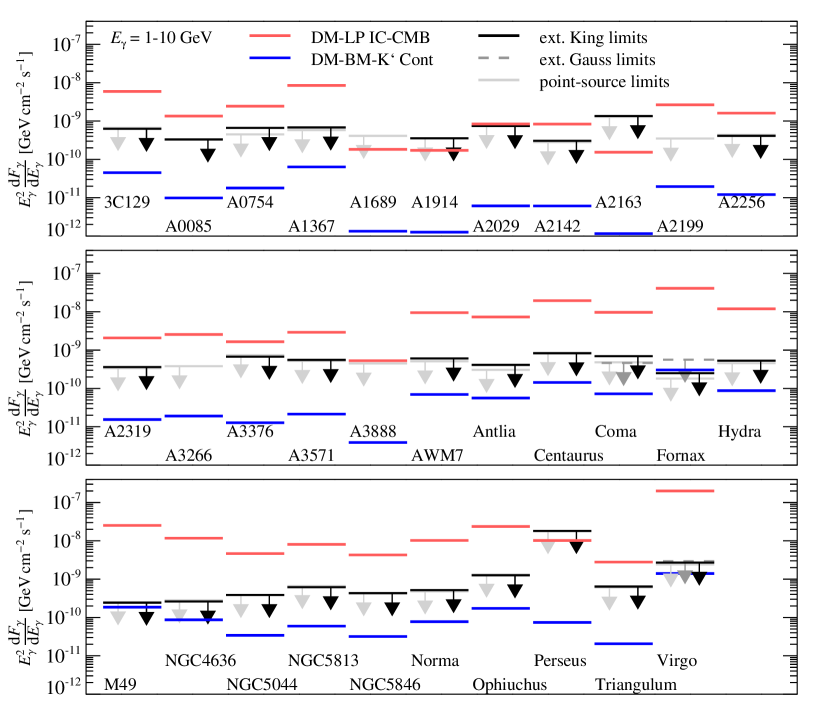
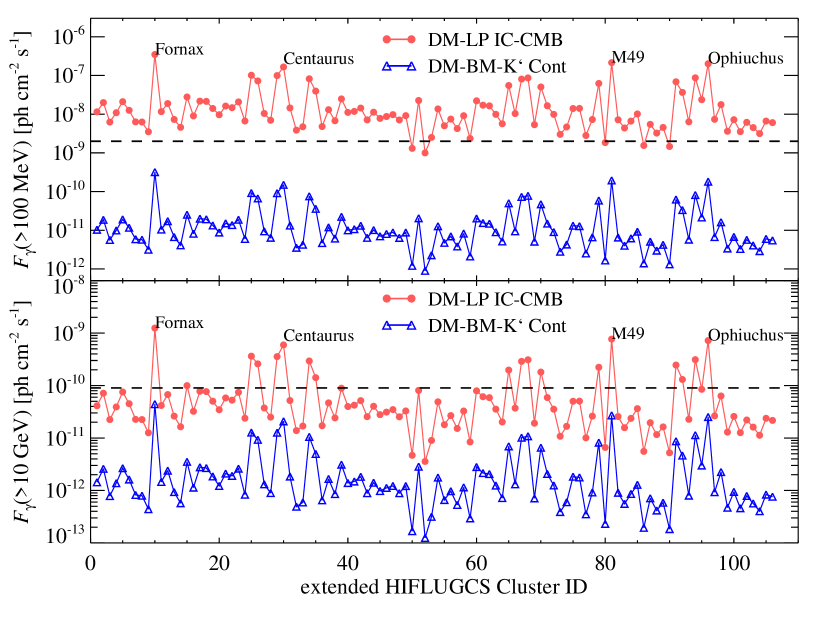
Figure 17 compares Fermi upper limits on the gamma-ray flux with predictions of DM annihilation fluxes in the LP and BM models. We assume a boost factor due to substructures that has a constant contribution per decade in substructure mass and has a mass spectrum extending down to Earth masses for our LP and BM DM annihilation models. The gamma-ray fluxes are calculated for those clusters where 18 months Fermi-LAT upper limits are derived (see Ackermann et al. (2010)). These limits rule out the LP models in their present form with the mentioned assumptions in 28 clusters, and limit the boost from SFE to less than 5 in M49 and Fornax. Assuming universality, this limits the Sommerfeld boost in the MW to less than 3 (see Fig. 11). The flux level of the Fermi limits are an indirect measure of the ambient background flux in the gamma-ray sky and/or the presence of strong point sources such as AGN in the immediate vicinity of the cluster position. Hence, the ratio of the Fermi upper limits to the predicted annihilation fluxes, , is a good indication of the best cluster candidates for indirect DM experiments. We identify Fornax, M49, NGC4636, and Virgo to be prime candidates. Note however, that Virgo extends over the sky which implies a lower surface brightness and lower signal-to-noise. Fermi limits on individual clusters are expected to improve as , where is the total elapsed time of the Fermi mission. We emphasize that the very inhomogeneous distribution of makes it unlikely to dramatically improve the limits through a likelihood stacking analysis as there are only a few clusters with comparably good flux ratios.
In Figure 18, we show the DM annihilation flux predictions of all the clusters in the extended HIFLUGCS catalogue Chen et al. (2007). We find M49 and Fornax to be that brightest clusters in the entire sample. While the LP model predicts that almost all clusters in the sample should be observed by Fermi after two years of data taking, the fluxes from the BM models are too low to be detected in the near future without improved modelling. Assuming the projected point source sensitivity (, 50h) of the future Cherenkov telescope array (CTA) of at energies of Doro et al. (2011), we note that it will be very challenging to detect the DM annihilation signal from clusters without a Sommerfeld boost by Cherenkov telescopes. This is because the boost from substructures is extended while the sensitivity of Cherenkov telescopes scales approximately linearly with source extension. Hence the fluxes quoted in Fig. 18 will have to be compared to a sensitivity that is scaled down by the ratio of cluster radius to angular resolution of assuming current background subtraction techniques of Cherenkov telescopes. This important finding should encourage the development of new methods to overcome the degradation of sensitivity for diffuse and very extended sources. Such a break-through would be needed to probe and potentially detect the presented class of BM models with a large investment of observational time.
V.3 CR-induced emission
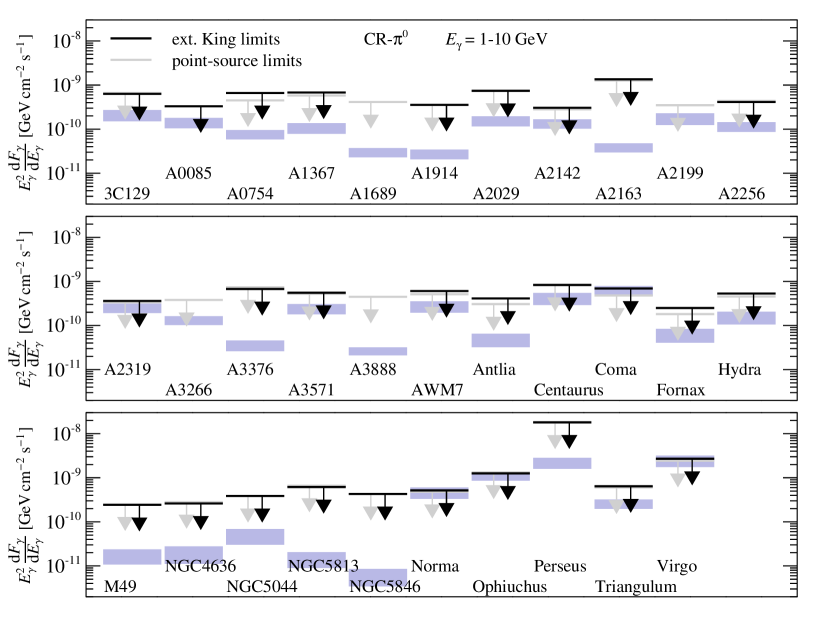


Figure 19 shows flux predictions by an analytical CR model Pinzke and Pfrommer (2010) for CR induced gamma-rays and compare those to the extended Fermi-LAT flux upper limits that assume King profiles which trace the X-ray emitting gas. For consistency, we use single- and double-beta model fits to ROSAT data of X-ray bright clusters for our gamma-ray flux estimates as an input Chen et al. (2007). The deprojection is performed following the formalism developed in e.g. Pfrommer and Enßlin (2004a). These gamma-ray flux predictions are superior to those that use luminosity-mass scaling relation (a method used by reference Ackermann et al. (2010) to compare to Fermi limits) which do not account for the substantial scatter in the scaling relation. The analytic CR model that we employ here follows CR-acceleration at structure formation shocks and their advective transport over cosmic time. This leads to a CR distribution with a universal spectral form and an almost universal spatial distribution. Depending on whether or not we account for the bias of “artificial galaxies” in cosmological simulations, we derive an optimistic or conservative limit of the expected gamma-ray emission from decaying pions (bracketing our ignorance of the contribution of cluster galaxies and ram-pressure stripped gas parcels from infalling galaxies to the overall gamma-ray flux from a cluster). As discussed in Sec. II.4, the model predictions are subject to two main uncertainties, the acceleration efficiency at formation shocks and CR transport parameters and hence may be scaled down depending on specific values realized in clusters.
The tightest Fermi limits are obtained in the 1-10 GeV regime due to the highest sensitivity of Fermi-LAT there. While the effective area of LAT increases up to these energies, the typical photon spectra decrease as a function of energy: combining those effects selects this energy range to be most sensitive. In this energy band, the Fermi limits close in on the conservative flux predictions of Virgo, Coma and Norma. Using integrated flux limits from Fermi, we arrive at very similar results. The insensitive limit on Perseus is due to the bright central source NGC1275 with an AGN in the center Mariotti et al. (2010) making it hard to determine a comparable limit as obtained for the other clusters. Additionally, recent gamma-ray observations of the head-tail radio galaxy IC310 complicate matters furthermore Aleksić et al. (2010b); Neronov et al. (2010).
A quantity that is of great scientific interest is the CR pressure () relative to the thermal pressure () as it may bias galaxy cluster observables, e.g., the Sunyaev-Zel’dovich signal or hydrostatic mass estimates, and the resulting cosmological constraints if the analysis does not marginalize over a potential pressure contribution from CRs. Before we turn to the newly derived constraints on the relative CR pressure, , we study the Bayesian prior that different models (a simulation based and a simple analytic model) impose on the scaling of with cluster mass.
In the simulation based analytic CR model Pinzke and Pfrommer (2010), the CR pressure derives from the CR distribution function, , where is the normalization, is the normalized CR proton momentum, and is the CR spectral index. The pressure is given by , where the volume weighted, dimensionless normalization scales as for clusters with a mass Pinzke and Pfrommer (2010). The thermal pressure and is derived from the temperature in virial equilibrium that scales as . Hence, the volume weighted relative CR pressure scales as
| (48) |
which depends only weakly on cluster virial mass. This suggests that CRs, which end up in a cluster, are accelerated at the strongest formation shocks, i.e. during proto-cluster formation at high or in between voids and pre-collapsed IGM. These CRs experience a similar transport history in the form of adiabatic compression or encounter shocks of similarly (weak) strength so that their distribution becomes only weakly dependent upon cluster mass.
In contrast, the analytic (isobaric) CR model Pfrommer and Enßlin (2004a), that was used by the Fermi collaboration to derive CR pressure constraints Ackermann et al. (2010), assumes and constrains by assuming no intrinsic cluster mass dependence of the CR pressure. While apparently very natural, this implies a strong cluster mass dependence of as the following estimate shows:
| (49) |
Here, we determine the mass scaling of the average gas density through its relation to the enclosed gas fraction, , and find that Sun et al. (2009).
Figure 20 shows the volume weighted relative CR pressure for 32 clusters, for which extended Fermi-LAT upper limits are derived (that assume King profiles). We adopt a constant derived from the average of the large clusters in our simulation sample Pfrommer et al. (2008); Pinzke and Pfrommer (2010). Using the extended gamma-ray upper limits on most of the clusters in the Fermi sample, we can constrain . The most constraining clusters are Norma, Ophiuchus, and Coma with . Most of the 32 clusters have limits on within a factor few from the best constraining clusters suggesting that stacking of clusters will be able to improve these limits (provided these analysis adopt the simulation-based analytic model Pinzke and Pfrommer (2010) as a prior).
In a recent work by the Fermi collaboration Ackermann et al. (2010), where the 1.5 year Fermi data was used to derive limits on , they found that the most massive clusters are on average more constraining yielding the best constraints of the order of 5% (by adopting, however, point-like upper limits). In this work we find that medium-sized clusters provide similarly strong constraints. This difference is explained by the different priors on . We adopt a prior inferred from cosmological simulations that dynamically trace the CRs during cluster assembly suggesting that adiabatic transport is dominant in shaping the CR population in clusters and implying a weak mass dependence of . Their analysis assumes a CR pressure that is independent of cluster mass, i.e., constraints on inherit the inverse mass dependence of the thermal pressure, . While it is not clear which mass scaling of is realized in Nature, these considerations suggest that it will be critical for future work to account for the Bayesian prior in deriving limits on their pressure.
To complete this section, we present our analytical model predictions for the CR-induced gamma-ray flux for all clusters in the extended HIFLUGCS sample in Fig. 21. In the lower panel of this figure, we show the relative difference between the gamma-ray flux computed using the analytical CR model to the flux predicted by the mass-luminosity scaling relation. Statistically, one can view the analytical modeling as explicitly accounting for the scatter of the expected gamma-ray flux at a given mass. Cool core clusters have a denser core which increases the target density of gas protons for the hadronic reaction which in turn leads to a systematic increase of the expected gamma-ray fluxes. We confirm this effect since all clusters with increased flux ratio of our analytical CR model relative to the scaling relation expectation are in fact cool core clusters. This suggests that the X-ray emission should be a good proxy for the expected gamma-ray emission. Note however that there could be the counter-acting effect of CR streaming in relaxed clusters which would tend to decrease the gamma-ray luminosity Enßlin et al. (2011). Future careful modelling is needed to quantify this effect.
VI Conclusions
In this paper, we study the possibility for detecting gamma-ray emission in galaxy clusters. We consider benchmark (BM) and leptophilic (LP) models of supersymmetric dark matter (DM) as well as cosmic ray (CR) induced pion decay which is thought to dominate the astrophysical signal from clusters.
Dark matter annihilation. Once supersymmetric cold DM decouples from the expanding universe it streams and erases any potentially present smaller scales. When gravitational instability causes halos to collapse, this free-streaming scale imprints as a characteristic minimum halo mass into the hierarchy of structure formation and should still survive until the present time as a mass cutoff in the substructure mass function within larger halos. We show that the boost due to substructures dominates over the smooth component for halo masses and contributes a constant luminosity for each decade in subhalo mass. The ratio of halo-to-minimum subhalo mass is maximized for the largest virialized systems in the Universe—galaxy clusters. The corresponding substructure boost can reach values exceeding which should make nearby clusters the brightest DM annihilation sources after the MW center and hypothetical very close-by DM substructures. We stress that this conclusion relies on two hypotheses that are still open problems in particle physics and numerical cosmology. We assume (i) the existence of cold DM, i.e., the density fluctuation power spectrum extends down to the DM free streaming scale of about an Earth mass, and (ii) assume that structure formation at scales smaller than currently resolved ones () proceeds scale-invariant, i.e., there is no non-linear mode coupling between different scales. This could potentially erase structures smaller than a characteristic one as the linear power spectrum approaches , implying that structure on different scales may not form any more hierarchically, but may collapse at the same time.
Since the mass density of substructures peaks at radii close to , the contribution to the annihilation emission from substructures is also dominated from these outer cluster regions. This implies an almost flat surface brightness profile of the annihilation emission which makes it necessary to have the entire cluster in the field-of-view to take advantage of the total substructure boost. This property makes it difficult to detect DM annihilation emission without an enhancement of the particle physics cross section over its standard value of with imaging air Cherenkov telescopes due to the spatially extended boost from substructures over an angular extent of (as independently found by reference Sanchez-Conde et al. (2011)). This large angular extent is not well matched with the sensitivity of Cherenkov telescopes which drops approximately linearly with radius outside the point spread function (with a characteristic scale of ), unless new background subtraction schemes can be found, e.g., for the survey mode of CTA.
In this work, we thoroughly study the spectral emission characteristics of the DM emission. In general there are different radiation mechanism that emit in the gamma-ray regime, namely (i) continuum emission following the hadronization of the annihilating neutralinos in BM models which leads to the production of charged and neutral mesons which decay finally into electrons, neutrinos, and gammas, (ii) inverse Compton (IC) emission by the leptons in the final state which up-scatter radiation fields from the cosmic microwave background (CMB), dust, and starlight, and (iii) final state radiation or internal bremsstrahlung which dominates the highest energy emission close to the rest mass of the self-annihilating neutralinos (if present in the model under consideration).111111While this final state radiation is sometimes not distinguished from the continuum emission contribution, we keep it separate as it dominates the very high-energy tail of the gamma-ray spectrum in LP models while there the continuum emission is negligibly low.
For the first time, we compute the IC emission component not only from the upscattered CMB photons but also from a realistically modeled photon field due to dust and starlight extending from infra-red to optical wavelengths. To this end, we construct a rather simple analytic model for the spatial and spectral distribution of dust and starlight in clusters (which can also be used for the annihilation emission in galaxies after adopting a different spatial profile). We find that in BM models, the continuum emission dominates over the IC emission of any available radiation field. In the LP models, where the continuum emission is low, the IC up-scattering of the CMB dominates below 60 GeV. For larger energies, the final state radiation dominates the emission up to the cutoff at TeV. The IC up-scattering of the dust and starlight is always subdominant compared to the upscattered CMB (below 60 GeV) and the final state radiation (above 60 GeV). We stress, that the inclusion of the dust and starlight radiation fields are negligible in the cooling function for the leptons. The main reason why the IC emission from starlight and dust remains subdominant is the small overlap of this component with the peripherally peaked substructure mass density profiles. If for some reason, DM has less substructure, the relative importance of this IC component increases considerably.
We identify Virgo, Fornax and M49 to be the best cluster/group candidates for indirect DM studies as they are expected to emit the brightest annihilation flux.121212We excluded Virgo from our further analysis due to its large angular extent that needs a separate treatment. More importantly, Fornax has a comparably low CR-induced gamma-ray flux which may enable an indirect DM detection or a particularly tight limit on DM properties. Other nearby bright sources of the extended HIFLUGCS sample are Ophiuchus, and Centaurus.
The non-detection of gamma-ray emission by Fermi in a total of 28 clusters/groups considerably constrains LP models for DM annihilation which were introduced to explain the increasing positron-to-lepton ratio beyond 10 GeV. Assuming that the minimum DM substructure mass extends down to an Earth mass and that the DM annihilation flux is dominated by small scale substructure, we limit the saturated Sommerfeld enhancement factor in M49 and Fornax to . This corresponds to a value in the Milky Way (MW) of , due to the larger Sommerfeld boost factor in smaller mass halos which have a lower velocity dispersion that enhances the particle cross section (while assuming universality of the DM model). This would rule out LP models in their current form based on the non-observation of gamma-rays in any of the fore-mentioned clusters/groups and hence strongly challenge the DM interpretation of the increasing positron fraction with energy as seen by PAMELA. Alternatively, assuming the LP models to be correct, this would limit the minimum substructure mass to in M49 and Fornax which presents a problem for structure formation in most particle physics models Bringmann (2009).
Cosmic ray-induced emission. We substantially improve the modelling of the expected gamma-ray signal from pion-decay resulting from hadronic CR interactions with gas protons over previous work Ackermann et al. (2010). We employ the analytic model of the CR spectrum and spatial distribution that is based on cosmological hydrodynamical simulations of galaxy clusters that self-consistently follow the evolution of CRs in cosmic structure formation Pinzke and Pfrommer (2010). Adopting the model for all clusters in the HIFLUGCS sample of flux-limited X-ray clusters, we compare the expected gamma-ray emission to that inferred from using an scaling relation. We note that the predictions of the “optimistic” model in Pinzke and Pfrommer (2010) are in tension with Fermi upper limits for Norma, Coma, and Ophiuchus. In the next 2-3 years Fermi will be able to probe the predictions of their “conservative” CR model. This will enable us to put realistic limits on a combination of the acceleration efficiency of CRs in structure formation shocks and CR transport coefficients in clusters.
As expected, the analytical CR model accounts for the “scatter” in the scaling relation and biases the gamma-ray flux high for prominent cool core clusters by up to a factor of 10 relative to the expectation from the scaling relation. This is due to the high target gas densities and associated CR densities in those cool cores that shape the spatial emission characteristic to be very similar to that observed in thermal X-rays. We caution that these predictions only apply for the case of negligible active CR transport such as CR streaming and diffusion relative to the gas. Gamma-ray fluxes might be considerably smaller in those cluster that do not show an extended diffuse radio(-mini) halo that might point to a centrally concentrated CR distribution Enßlin et al. (2011). The CR spectrum shows the characteristic pion bump at energies around 1 GeV. It is expected to dominate the DM annihilation signal of BM models for clusters/groups, although we find that the gamma-ray flux induced by the BM is higher for about 1/5 of the clusters in the HIFLUGCS catalogue, where Fornax and M49 have the highest signal-to-noise ratio. (Note that we only include the cluster-intrinsic CR foreground and do not consider the dominant galactic and instrumental noise sources here.)
Combining extended Fermi upper limits and our model flux predictions, we limit the relative CR pressure, , in 32 nearby bright galaxy clusters of the Fermi sample. The best limits are found in Norma and Coma of the order of 3%, with typical limits around 10%. This is comparable to those inferred by the Fermi collaboration Ackermann et al. (2010) and mainly due to the differently assumed Bayesian prior on the CR pressure which implies a different cluster mass dependence of the resulting limits on .
We would like to thank Volker Springel, Megan Donahue, Stefano Profumo, Tesla Jeltema and Fabio Zandanel for helpful discussions. We express our thanks to Neal Weiner and Tracy Slayter for many comments and suggestions that improved an earlier version of this manuscript. A.P. acknowledges NSF grant AST 0908480 for support. We would furthermore like to thank KITP for their hospitality during the galaxy cluster workshop. This research was supported in part by the National Science Foundation under Grant No. NSF PHY05-51164. C.P. gratefully acknowledges financial support of the Klaus Tschira Foundation. The work of L.B. was supported by the Swedish Research Council (VR), under contracts no. 621-2009-3915 and 349-2007-8709 (the Oskar Klein Centre).
References
- Pato et al. (2011) M. Pato, L. Baudis, G. Bertone, R. Ruiz de Austri, L. E. Strigari, et al., Phys.Rev. D83, 083505 (2011), arXiv:1012.3458 [astro-ph.CO] .
- Ellis et al. (2002) J. R. Ellis, J. L. Feng, A. Ferstl, K. T. Matchev, and K. A. Olive, Eur.Phys.J. C24, 311 (2002), arXiv:astro-ph/0110225 [astro-ph] .
- Baer et al. (2007) H. Baer, A. Mustafayev, S. Profumo, and X. Tata, Phys.Rev. D75, 035004 (2007), arXiv:hep-ph/0610154 [hep-ph] .
- Khachatryan et al. (2011) V. Khachatryan et al. (CMS Collaboration), Phys.Lett. B698, 196 (2011), arXiv:1101.1628 [hep-ex] .
- Bergstrom (2009) L. Bergstrom, New J.Phys. 11, 105006 (2009), arXiv:0903.4849 [hep-ph] .
- CTA (2010) CTA, (2010), The CTA Consortium: Design Concepts for the Cherenkov Telescope Array, arXiv:1008.3703 [astro-ph.IM] .
- Bergstrom et al. (2011) L. Bergstrom, T. Bringmann, and J. Edsjo, Phys.Rev. D83, 045024 (2011), arXiv:1011.4514 [hep-ph] .
- Hooper and Goodenough (2011) D. Hooper and L. Goodenough, Physics Letters B 697, 412 (2011), arXiv:1010.2752 [hep-ph] .
- Boyarsky et al. (2010) A. Boyarsky, D. Malyshev, and O. Ruchayskiy, ArXiv e-prints (2010), arXiv:1012.5839 [hep-ph] .
- Bringmann et al. (2009) T. Bringmann, M. Doro, and M. Fornasa, JCAP 1, 16 (2009), arXiv:0809.2269 .
- Acciari et al. (2010) V. A. Acciari et al. (VERITAS Collaboration), Astrophys. J. 720, 1174 (2010), arXiv:1006.5955 [astro-ph.CO] .
- Scott et al. (2010) P. Scott, J. Conrad, J. Edsjö, L. Bergström, C. Farnier, and Y. Akrami, JCAP 1, 31 (2010), arXiv:0909.3300 [astro-ph.CO] .
- Aleksić et al. (2011) J. Aleksić et al. (MAGIC Collaboration), ArXiv e-prints (2011), arXiv:1103.0477 [astro-ph.HE] .
- Abramowski et al. (2011) A. Abramowski et al. (HESS Collaboration), Astroparticle Physics 34, 608 (2011).
- Gao et al. (2004) L. Gao, S. D. M. White, A. Jenkins, F. Stoehr, and V. Springel, MNRAS 355, 819 (2004), arXiv:astro-ph/0404589 .
- (16) M.-L. Garde, Talk at IDM10, Montpellier, France, July 2010, to appear in the Proceedings.
- Reimer et al. (2003) O. Reimer, M. Pohl, P. Sreekumar, and J. R. Mattox, Astrophys. J. 588, 155 (2003).
- Perkins et al. (2006) J. S. Perkins et al., Astrophys. J. 644, 148 (2006), arXiv:astro-ph/0602258 .
- Perkins (2008) J. S. Perkins, in American Institute of Physics Conference Series, American Institute of Physics Conference Series, Vol. 1085, edited by F. A. Aharonian, W. Hofmann, and F. Rieger (2008) pp. 569–572.
- Aharonian et al. (2009a) F. Aharonian et al. (HESS Collaboration), A&A 495, 27 (2009a), arXiv:0812.1638 .
- Galante and for the VERITAS Collaboration (2009) N. Galante and for the VERITAS Collaboration, ArXiv e-prints (2009), arXiv:0907.5000 [astro-ph.HE] .
- Domainko et al. (2009) W. Domainko, D. Nedbal, J. A. Hinton, and O. Martineau-Huynh, International Journal of Modern Physics D 18, 1627 (2009), arXiv:0907.3001 [astro-ph.CO] .
- Aharonian et al. (2009b) F. Aharonian et al. (HESS Collaboration), A&A 502, 437 (2009b), arXiv:0907.0727 [astro-ph.CO] .
- Kiuchi et al. (2009) R. Kiuchi et al. (CANGAROO Collaboration), Astrophys. J. 704, 240 (2009), arXiv:0908.3301 [astro-ph.HE] .
- Acciari et al. (2009) V. A. Acciari et al. (VERITAS Collaboration), ApJL 706, L275 (2009), arXiv:0911.0740 [astro-ph.HE] .
- Aleksić et al. (2010a) J. Aleksić et al. (MAGIC Collaboration), Astrophys. J. 710, 634 (2010a), arXiv:0909.3267 [astro-ph.HE] .
- Ackermann et al. (2010) M. Ackermann et al. (FERMI Collaboration), JCAP 5, 25 (2010), arXiv:1002.2239 [astro-ph.CO] .
- Ackermann et al. (2010) M. Ackermann et al., ApJL 717, L71 (2010), arXiv:1006.0748 [astro-ph.HE] .
- Pinzke et al. (2009) A. Pinzke, C. Pfrommer, and L. Bergström, Physical Review Letters 103, 181302 (2009), arXiv:0905.1948 [astro-ph.HE] .
- Gao et al. (2011a) L. Gao, C. S. Frenk, M. Boylan-Kolchin, A. Jenkins, V. Springel, and S. D. M. White, MNRAS 410, 2309 (2011a), arXiv:1006.2882 [astro-ph.CO] .
- Springel et al. (2008a) V. Springel, S. D. M. White, C. S. Frenk, J. F. Navarro, A. Jenkins, M. Vogelsberger, J. Wang, A. Ludlow, and A. Helmi, Nature (London) 456, 73 (2008a), arXiv:0809.0894 .
- Arkani-Hamed et al. (2009) N. Arkani-Hamed, D. P. Finkbeiner, T. R. Slatyer, and N. Weiner, Phys.Rev. D79, 015014 (2009), arXiv:0810.0713 [hep-ph] .
- Pfrommer and Enßlin (2004a) C. Pfrommer and T. A. Enßlin, A&A 413, 17 (2004a).
- Reiprich and Böhringer (2002) T. H. Reiprich and H. Böhringer, Astrophys. J. 567, 716 (2002), arXiv:astro-ph/0111285 .
- Chen et al. (2007) Y. Chen, T. H. Reiprich, H. Böhringer, Y. Ikebe, and Y.-Y. Zhang, A&A 466, 805 (2007), arXiv:astro-ph/0702482 .
- Colafrancesco et al. (2006) S. Colafrancesco, S. Profumo, and P. Ullio, A&A 455, 21 (2006), arXiv:astro-ph/0507575 .
- Jeltema et al. (2009) T. E. Jeltema, J. Kehayias, and S. Profumo, Phys. Rev. D 80, 023005 (2009), arXiv:0812.0597 .
- Sanchez-Conde et al. (2011) M. A. Sanchez-Conde, M. Cannoni, F. Zandanel, M. E. Gomez, and F. Prada, ArXiv e-prints (2011), arXiv:1104.3530 [astro-ph.HE] .
- Cuesta et al. (2011) A. J. Cuesta, T. E. Jeltema, F. Zandanel, S. Profumo, F. Prada, G. Yepes, A. Klypin, Y. Hoffman, S. Gottlöber, J. Primack, M. A. Sánchez-Conde, and C. Pfrommer, ApJL 726, L6+ (2011), arXiv:1007.3469 [astro-ph.HE] .
- Huang et al. (2011) X. Huang, G. Vertongen, and C. Weniger, ArXiv e-prints (2011), arXiv:1110.1529 [hep-ph] .
- Pinzke and Pfrommer (2010) A. Pinzke and C. Pfrommer, MNRAS 409, 449 (2010), arXiv:1001.5023 [astro-ph.CO] .
- Brunetti and Lazarian (2011) G. Brunetti and A. Lazarian, MNRAS 410, 127 (2011), arXiv:1008.0184 [astro-ph.CO] .
- Pfrommer et al. (2008) C. Pfrommer, T. A. Enßlin, and V. Springel, MNRAS 385, 1211 (2008), arXiv:0707.1707 .
- Kushnir and Waxman (2009) D. Kushnir and E. Waxman, JCAP 8, 2 (2009), arXiv:0903.2271 [astro-ph.HE] .
- Donnert et al. (2010a) J. Donnert, K. Dolag, R. Cassano, and G. Brunetti, MNRAS 407, 1565 (2010a), arXiv:1003.0336 [astro-ph.CO] .
- Berezinsky et al. (1997) V. S. Berezinsky, P. Blasi, and V. S. Ptuskin, Astrophys. J. 487, 529 (1997).
- Enßlin et al. (2007) T. A. Enßlin, C. Pfrommer, V. Springel, and M. Jubelgas, A&A 473, 41 (2007), arXiv:astro-ph/0603484 .
- Komatsu et al. (2011) E. Komatsu et al. (WMAP Collaboration), Astrophys.J.Suppl. 192, 18 (2011), arXiv:1001.4538 [astro-ph.CO] .
- Aprile et al. (2010) E. Aprile et al. (XENON100 Collaboration), Phys.Rev.Lett. 105, 131302 (2010), arXiv:1005.0380 [astro-ph.CO] .
- Aprile et al. (2011) E. Aprile et al. (XENON100 Collaboration), Phys.Rev.Lett. (2011), long author list - awaiting processing, arXiv:1104.2549 [astro-ph.CO] .
- Strigari et al. (2007) L. E. Strigari, S. M. Koushiappas, J. S. Bullock, and M. Kaplinghat, Phys.Rev. D75, 083526 (2007), arXiv:astro-ph/0611925 [astro-ph] .
- Essig et al. (2009) R. Essig, N. Sehgal, and L. E. Strigari, Phys.Rev. D80, 023506 (2009), arXiv:0902.4750 [hep-ph] .
- Ghigna et al. (1998) S. Ghigna, B. Moore, F. Governato, G. Lake, T. R. Quinn, et al., Mon.Not.Roy.Astron.Soc. 300, 146 (1998), arXiv:astro-ph/9801192 [astro-ph] .
- Lewis et al. (2003) A. D. Lewis, D. A. Buote, and J. T. Stocke, Astrophys.J. 586, 135 (2003), arXiv:astro-ph/0209205 [astro-ph] .
- Boyarsky et al. (2008) A. Boyarsky, O. Ruchayskiy, and M. Markevitch, Astrophys.J. 673, 752 (2008), arXiv:astro-ph/0611168 [astro-ph] .
- Bergström et al. (2001) L. Bergström, J. Edsjö, and P. Ullio, Phys.Rev.Lett. 87, 251301 (2001), arXiv:astro-ph/0105048 [astro-ph] .
- Ullio et al. (2002) P. Ullio, L. Bergström, J. Edsjö, and C. G. Lacey, Phys.Rev. D66, 123502 (2002), arXiv:astro-ph/0207125 [astro-ph] .
- Taylor and Silk (2003) J. E. Taylor and J. Silk, Mon.Not.Roy.Astron.Soc. 339, 505 (2003), arXiv:astro-ph/0207299 [astro-ph] .
- Elsaesser and Mannheim (2005) D. Elsaesser and K. Mannheim, Phys.Rev.Lett. 94, 171302 (2005), arXiv:astro-ph/0405235 [astro-ph] .
- Cuoco et al. (2011) A. Cuoco, A. Sellerholm, J. Conrad, and S. Hannestad, MNRAS , 503 (2011), arXiv:1005.0843 [astro-ph.HE] .
- Abazajian et al. (2010) K. N. Abazajian, P. Agrawal, Z. Chacko, and C. Kilic, JCAP 1011, 041 (2010), arXiv:1002.3820 [astro-ph.HE] .
- Abdo et al. (2010) A. Abdo et al. (Fermi-LAT Collaboration), JCAP 1004, 014 (2010), arXiv:1002.4415 [astro-ph.CO] .
- Zavala et al. (2011) J. Zavala, M. Vogelsberger, T. R. Slatyer, A. Loeb, and V. Springel, (2011), arXiv:1103.0776 [astro-ph.CO] .
- Adriani et al. (2009) O. Adriani et al. (PAMELA Collaboration), Nature 458, 607 (2009), arXiv:0810.4995 [astro-ph] .
- Abdo et al. (2009) A. A. Abdo et al. (The Fermi LAT Collaboration), Phys.Rev.Lett. 102, 181101 (2009), arXiv:0905.0025 [astro-ph.HE] .
- Adriani et al. (2010) O. Adriani et al. (PAMELA Collaboration), Phys.Rev.Lett. 105, 121101 (2010), arXiv:1007.0821 [astro-ph.HE] .
- Bertone et al. (2009) G. Bertone, M. Cirelli, A. Strumia, and M. Taoso, JCAP 0903, 009 (2009), arXiv:0811.3744 [astro-ph] .
- Cirelli et al. (2009) M. Cirelli, M. Kadastik, M. Raidal, and A. Strumia, Nucl.Phys. B813, 1 (2009), arXiv:0809.2409 [hep-ph] .
- Bergström et al. (2009a) L. Bergström, G. Bertone, T. Bringmann, J. Edsjö, and M. Taoso, Phys.Rev. D79, 081303 (2009a), arXiv:0812.3895 [astro-ph] .
- Finkbeiner et al. (2011) D. P. Finkbeiner, L. Goodenough, T. R. Slatyer, M. Vogelsberger, and N. Weiner, JCAP 1105, 002 (2011), arXiv:1011.3082 [hep-ph] .
- Atoyan et al. (1995) A. M. Atoyan, F. A. Aharonian, and H. J. Völk, Phys. Rev. D 52, 3265 (1995).
- Hooper et al. (2009) D. Hooper, P. Blasi, and P. D. Serpico, JCAP 0901, 025 (2009), arXiv:0810.1527 [astro-ph] .
- Ahlers et al. (2009) M. Ahlers, P. Mertsch, and S. Sarkar, Phys.Rev. D80, 123017 (2009), arXiv:0909.4060 [astro-ph.HE] .
- Jungman et al. (1996) G. Jungman, M. Kamionkowski, and K. Griest, Phys.Rept. 267, 195 (1996), arXiv:hep-ph/9506380 [hep-ph] .
- Bergström (2000) L. Bergström, Rept.Prog.Phys. 63, 793 (2000), arXiv:hep-ph/0002126 [hep-ph] .
- Bertone et al. (2005) G. Bertone, D. Hooper, and J. Silk, Phys.Rept. 405, 279 (2005), arXiv:hep-ph/0404175 [hep-ph] .
- Ting et al. (2011) S. Ting et al. (The AMS02 Collaboration), Home page www.ams02.org (2011).
- Silk and Stebbins (1993) J. Silk and A. Stebbins, Astrophys. J. 411, 439 (1993).
- Bergström et al. (1998) L. Bergström, J. Edsjö, and P. Ullio, Phys.Rev. D58, 083507 (1998), arXiv:astro-ph/9804050 [astro-ph] .
- Moore et al. (1999) B. Moore, S. Ghigna, F. Governato, G. Lake, T. R. Quinn, et al., Astrophys.J. 524, L19 (1999).
- Sommerfeld (1931) A. Sommerfeld, Annalen der Physik 403, 257 (1931).
- Hisano et al. (2005) J. Hisano, S. Matsumoto, M. M. Nojiri, and O. Saito, Phys. Rev. D 71, 063528 (2005), arXiv:hep-ph/0412403 .
- Cirelli et al. (2007) M. Cirelli, A. Strumia, and M. Tamburini, Nuclear Physics B 787, 152 (2007), arXiv:0706.4071 [hep-ph] .
- Arkani-Hamed et al. (2009) N. Arkani-Hamed, D. P. Finkbeiner, T. R. Slatyer, and N. Weiner, Phys. Rev. D 79, 015014 (2009), arXiv:0810.0713 [hep-ph] .
- Kamionkowski and Profumo (2008) M. Kamionkowski and S. Profumo, Physical Review Letters 101, 261301 (2008), arXiv:0810.3233 .
- Bergström et al. (2009b) L. Bergström, J. Edsjö, and G. Zaharijas, Phys.Rev.Lett. 103, 031103 (2009b), arXiv:0905.0333 [astro-ph.HE] .
- Meade et al. (2010) P. Meade, M. Papucci, A. Strumia, and T. Volansky, Nucl.Phys. B831, 178 (2010), arXiv:0905.0480 [hep-ph] .
- Voit (2005) G. M. Voit, Reviews of Modern Physics 77, 207 (2005), arXiv:astro-ph/0410173 .
- Ellis et al. (1984) J. Ellis, J. S. Hagelin, D. V. Nanopoulos, K. Olive, and M. Srednicki, Nuclear Physics B 238, 453 (1984).
- Gondolo et al. (2004) P. Gondolo, J. Edsjö, P. Ullio, L. Bergström, M. Schelke, and E. A. Baltz, JCAP 7, 8 (2004), arXiv:astro-ph/0406204 .
- Battaglia et al. (2004) M. Battaglia, A. D. Roeck, J. Ellis, F. Gianotti, K. A. Olive, and L. Pape, European Physical Journal C 33, 273 (2004), arXiv:hep-ph/0306219 .
- Goldberg (1983) H. Goldberg, Physical Review Letters 50, 1419 (1983).
- Bergström (1989) L. Bergström, Physics Letters B 225, 372 (1989).
- Bringmann et al. (2008) T. Bringmann, L. Bergström, and J. Edsjö, Journal of High Energy Physics 1, 49 (2008), arXiv:0710.3169 [hep-ph] .
- Ciafaloni et al. (2011) P. Ciafaloni, D. Comelli, A. Riotto, F. Sala, A. Strumia, and A. Urbano, JCAP 3, 19 (2011), arXiv:1009.0224 [hep-ph] .
- Cirelli et al. (2011) M. Cirelli, G. Corcella, A. Hektor, G. Hütsi, M. Kadastik, P. Panci, M. Raidal, F. Sala, and A. Strumia, JCAP 3, 51 (2011), arXiv:1012.4515 [hep-ph] .
- Macciò et al. (2008) A. V. Macciò, A. A. Dutton, and F. C. van den Bosch, MNRAS 391, 1940 (2008), arXiv:0805.1926 .
- Zhao et al. (2009) D. H. Zhao, Y. P. Jing, H. J. Mo, and G. Börner, Astrophys. J. 707, 354 (2009), arXiv:0811.0828 .
- Hu and Kravtsov (2003) W. Hu and A. V. Kravtsov, Astrophys. J. 584, 702 (2003), arXiv:astro-ph/0203169 .
- Merritt et al. (2006) D. Merritt, A. W. Graham, B. Moore, J. Diemand, and B. Terzić, AJ 132, 2685 (2006), arXiv:astro-ph/0509417 .
- Navarro et al. (2010) J. F. Navarro, A. Ludlow, V. Springel, J. Wang, M. Vogelsberger, S. D. M. White, A. Jenkins, C. S. Frenk, and A. Helmi, MNRAS 402, 21 (2010), arXiv:0810.1522 .
- Newman et al. (2011) A. B. Newman, T. Treu, R. S. Ellis, and D. J. Sand, ApJL 728, L39+ (2011), arXiv:1101.3553 [astro-ph.CO] .
- Springel et al. (2008b) V. Springel, J. Wang, M. Vogelsberger, A. Ludlow, A. Jenkins, A. Helmi, J. F. Navarro, C. S. Frenk, and S. D. M. White, MNRAS 391, 1685 (2008b), arXiv:0809.0898 .
- Anderson et al. (2010) B. Anderson, M. Kuhlen, J. Diemand, R. P. Johnson, and P. Madau, Astrophys. J. 718, 899 (2010), arXiv:1006.1628 [astro-ph.HE] .
- Kuhlen et al. (2008) M. Kuhlen, J. Diemand, P. Madau, and M. Zemp, Journal of Physics Conference Series 125, 012008 (2008), arXiv:0810.3614 .
- Gao et al. (2011b) L. Gao, C. S. Frenk, A. Jenkins, V. Springel, and S. D. M. White, ArXiv e-prints (2011b), arXiv:1107.1916 [astro-ph.CO] .
- Hofmann et al. (2001) S. Hofmann, D. J. Schwarz, and H. Stöcker, Phys. Rev. D 64, 083507 (2001), arXiv:astro-ph/0104173 .
- Green et al. (2005) A. M. Green, S. Hofmann, and D. J. Schwarz, JCAP 8, 3 (2005), arXiv:astro-ph/0503387 .
- Bringmann (2009) T. Bringmann, New Journal of Physics 11, 105027 (2009), arXiv:0903.0189 [astro-ph.CO] .
- Ishiyama et al. (2011) T. Ishiyama, J. Makino, S. Portegies Zwart, D. Groen, K. Nitadori, S. Rieder, C. de Laat, S. McMillan, K. Hiraki, and S. Harfst, ArXiv e-prints (2011), arXiv:1101.2020 [astro-ph.CO] .
- Rybicki and Lightman (1979) G. B. Rybicki and A. P. Lightman, Radiative processes in astrophysics (New York, Wiley-Interscience, 1979., 1979).
- Blumenthal and Gould (1970) G. R. Blumenthal and R. J. Gould, Reviews of Modern Physics 42, 237 (1970).
- Enßlin et al. (2011) T. Enßlin, C. Pfrommer, F. Miniati, and K. Subramanian, A&A 527, A99+ (2011), arXiv:1008.4717 [astro-ph.CO] .
- Porter et al. (2006) T. A. Porter, I. V. Moskalenko, and A. W. Strong, ApJL 648, L29 (2006), arXiv:astro-ph/0607344 .
- Gilmore et al. (2009) R. C. Gilmore, P. Madau, J. R. Primack, R. S. Somerville, and F. Haardt, MNRAS 399, 1694 (2009), arXiv:0905.1144 [astro-ph.CO] .
- Haarsma et al. (2010) D. B. Haarsma, L. Leisman, M. Donahue, S. Bruch, H. Böhringer, J. H. Croston, G. W. Pratt, G. M. Voit, M. Arnaud, and D. Pierini, Astrophys. J. 713, 1037 (2010), arXiv:0911.2798 [astro-ph.CO] .
- Zibetti et al. (2005) S. Zibetti, S. D. M. White, D. P. Schneider, and J. Brinkmann, MNRAS 358, 949 (2005), arXiv:astro-ph/0501194 .
- Kempner et al. (2004) J. C. Kempner, E. L. Blanton, T. E. Clarke, T. A. Enßlin, M. Johnston-Hollitt, and L. Rudnick, in The Riddle of Cooling Flows in Galaxies and Clusters of galaxies, edited by T. Reiprich, J. Kempner, N. Soker (2004) pp. 335–+, arXiv:astro-ph/0310263 .
- Feretti (2003) L. Feretti, in Astronomical Society of the Pacific Conference Series, Astronomical Society of the Pacific Conference Series, Vol. 301, edited by S. Bowyer and C.-Y. Hwang (2003) pp. 143–+.
- Ferrari et al. (2008) C. Ferrari, F. Govoni, S. Schindler, A. M. Bykov, and Y. Rephaeli, Space Science Reviews 134, 93 (2008), arXiv:0801.0985 .
- Dennison (1980) B. Dennison, ApJL 239, L93 (1980).
- Vestrand (1982) W. T. Vestrand, AJ 87, 1266 (1982).
- Blasi and Colafrancesco (1999) P. Blasi and S. Colafrancesco, Astroparticle Physics 12, 169 (1999), arXiv:astro-ph/9905122 .
- Dolag and Enßlin (2000) K. Dolag and T. A. Enßlin, A&A 362, 151 (2000), arXiv:astro-ph/0008333 .
- Miniati et al. (2001) F. Miniati, D. Ryu, H. Kang, and T. W. Jones, Astrophys. J. 559, 59 (2001), arXiv:astro-ph/0105465 .
- Miniati (2003) F. Miniati, MNRAS 342, 1009 (2003), arXiv:astro-ph/0303593 .
- Pfrommer and Enßlin (2004b) C. Pfrommer and T. A. Enßlin, MNRAS 352, 76 (2004b), arXiv:astro-ph/0404119 .
- Pfrommer (2008) C. Pfrommer, MNRAS 385, 1242 (2008), arXiv:0707.1693 .
- Kushnir et al. (2009) D. Kushnir, B. Katz, and E. Waxman, JCAP 9, 24 (2009), arXiv:0903.2275 [astro-ph.HE] .
- Donnert et al. (2010b) J. Donnert, K. Dolag, G. Brunetti, R. Cassano, and A. Bonafede, MNRAS 401, 47 (2010b), arXiv:0905.2418 [astro-ph.CO] .
- Keshet and Loeb (2010) U. Keshet and A. Loeb, Astrophys. J. 722, 737 (2010), arXiv:1003.1133 [astro-ph.CO] .
- Schlickeiser et al. (1987) R. Schlickeiser, A. Sievers, and H. Thiemann, A&A 182, 21 (1987).
- Giovannini et al. (1993) G. Giovannini, L. Feretti, T. Venturi, K.-T. Kim, and P. P. Kronberg, Astrophys. J. 406, 399 (1993).
- Brunetti et al. (2004) G. Brunetti, P. Blasi, R. Cassano, and S. Gabici, MNRAS 350, 1174 (2004), arXiv:astro-ph/0312482 .
- Brunetti and Blasi (2005) G. Brunetti and P. Blasi, MNRAS 363, 1173 (2005), arXiv:astro-ph/0508100 .
- Brunetti and Lazarian (2007) G. Brunetti and A. Lazarian, MNRAS 378, 245 (2007), arXiv:astro-ph/0703591 .
- Brunetti et al. (2009) G. Brunetti, R. Cassano, K. Dolag, and G. Setti, A&A 507, 661 (2009), arXiv:0909.2343 [astro-ph.CO] .
- Völk et al. (1996) H. J. Völk, F. A. Aharonian, and D. Breitschwerdt, SSRv 75, 279 (1996).
- Ensslin et al. (1997) T. A. Ensslin, P. L. Biermann, P. P. Kronberg, and X.-P. Wu, Astrophys. J. 477, 560 (1997), arXiv:astro-ph/9609190 .
- Jubelgas et al. (2008) M. Jubelgas, V. Springel, T. Enßlin, and C. Pfrommer, A&A 481, 33 (2008), arXiv:astro-ph/0603485 .
- Pfrommer et al. (2006) C. Pfrommer, V. Springel, T. A. Enßlin, and M. Jubelgas, MNRAS 367, 113 (2006), arXiv:astro-ph/0603483 .
- Helder et al. (2009) E. A. Helder, J. Vink, C. G. Bassa, A. Bamba, J. A. M. Bleeker, S. Funk, P. Ghavamian, K. J. van der Heyden, F. Verbunt, and R. Yamazaki, Science 325, 719 (2009), arXiv:0906.4553 [astro-ph.GA] .
- Kang and Jones (2005) H. Kang and T. W. Jones, Astrophys. J. 620, 44 (2005).
- Tully and Shaya (1984) R. B. Tully and E. J. Shaya, Astrophys. J. 281, 31 (1984).
- Mei et al. (2007) S. Mei, J. P. Blakeslee, P. Côté, J. L. Tonry, M. J. West, L. Ferrarese, A. Jordán, E. W. Peng, A. Anthony, and D. Merritt, Astrophys. J. 655, 144 (2007), arXiv:astro-ph/0702510 .
- Pfrommer et al. (2011) C. Pfrommer, P. Chang, and A. E. Broderick, ArXiv e-prints (2011), arXiv:1106.5505 [astro-ph.CO] .
- Puchwein et al. (2008) E. Puchwein, D. Sijacki, and V. Springel, ApJL 687, L53 (2008), arXiv:0808.0494 .
- Doro et al. (2011) M. Doro et al. (consortium for the CTA), Nucl.Instrum.Meth. A630, 285 (2011), arXiv:0908.1410 [astro-ph.IM] .
- Mariotti et al. (2010) M. Mariotti et al. (MAGIC Collaboration), The Astronomer’s Telegram 2916, 1 (2010).
- Aleksić et al. (2010b) J. Aleksić et al. (MAGIC Collaboration), ApJL 723, L207 (2010b), arXiv:1009.2155 [astro-ph.HE] .
- Neronov et al. (2010) A. Neronov, D. Semikoz, and I. Vovk, A&A 519, L6+ (2010), arXiv:1003.4615 [astro-ph.HE] .
- Sun et al. (2009) M. Sun, G. M. Voit, M. Donahue, C. Jones, W. Forman, and A. Vikhlinin, Astrophys. J. 693, 1142 (2009), arXiv:0805.2320 .
- Giard et al. (2008) M. Giard, L. Montier, E. Pointecouteau, and E. Simmat, A&A 490, 547 (2008), arXiv:0808.2404 .
- Mo et al. (2010) H. Mo, F. Bosch, and S. White, Galaxy Formation and Evolution, ISBN: 9780521857932 (2010).
- Binney and Merrifield (1998) J. Binney and M. Merrifield, Galactic astronomy / James Binney and Michael Merrifield. Princeton, NJ : Princeton University Press, 1998. (Princeton series in astrophysics) QB857 .B522 1998, edited by Binney, J. & Merrifield, M. (1998).
- Abramowitz and Stegun (1965) M. Abramowitz and I. A. Stegun, Handbook of mathematical functions (Dover, New York, 1965).
- Paolillo et al. (2002) M. Paolillo, G. Fabbiano, G. Peres, and D.-W. Kim, Astrophys. J. 565, 883 (2002), arXiv:astro-ph/0109342 .
- Matsushita et al. (2002) K. Matsushita, E. Belsole, A. Finoguenov, and H. Böhringer, A&A 386, 77 (2002), arXiv:astro-ph/0201242 .
- Churazov et al. (2003) E. Churazov, W. Forman, C. Jones, and H. Böhringer, Astrophys. J. 590, 225 (2003), arXiv:astro-ph/0301482 .
Appendix A Detailed modelling of starlight and dust in clusters
In this section, we present the details of our model of stars and dust (SD) in clusters of galaxies. In the first part, we use the measured spectral distribution of light from SD in a typical galaxy to derive a simple spectral model for SD in galaxy clusters. This is done by renormalizing the galactic SD distribution to match the observed luminosity from a cluster in the far infra-red (IR) and ultra-violet (UV) bands separately. In the second part, we derive the spatial distribution of the SD light from a stacked sample of clusters.
A.1 Energy spectrum
The cluster emission from far-IR to optical/UV is due to dust emission and stellar light, respectively. We distinguish three components: the brightest cluster galaxy (BCG), the intra-cluster light (ICL) and individual galaxies. While the latter distribution is highly clumped, the first two components are smoothly distributed. We use the far-IR to UV spectrum derived in reference Porter et al. (2006) for a Milky Way (MW)-type galaxy to characterize the spectral distribution of SD in a cluster. Note that we only keep the spectral shape, and renormalize the amplitude of the spectral distribution using the luminosity from SD in clusters.
In Fig. 4, we show the cosmic microwave background (CMB) black-body distribution together with the spectral distribution of SD light of a galaxy cluster. We fit the spectral shape of SD individually; the dust that peaks at about is fitted using a double power-law, while the broader spectral distribution of the stars that peaks at about is fitted using a triple power-law. The best fit to the galactic spectrum is given by:
| (50) | |||||
| (51) | |||||
The specific energy density of the light from SD in a cluster can now be derived from
| (52) |
where the spectral distribution of SD is given by
| (53) |
Here denotes the energy of the SD photons, describes the unitless spatial distribution of SD (derived in Sec. A.2), and denotes the mass dependent normalization for the SD. This function is determined using the total energy of the light from SD within , which is represented by . We relate this energy to the luminosity in each respective wavelength band (far-IR light for the dust, and optical/UV light for the stars) using
| (54) |
Here we approximate the total energy of the photons within with the SD luminosity multiplied with the typical timescale that it takes for a photon to propagate through the cluster (we assume that the cluster is optically thin).
The luminosity from starlight is given by
| (55) | |||||
where the average apparent magnitude of a cluster at in the -band is given by Zibetti et al. (2005). This magnitude is derived from stacked clusters observed by the SDSS with the average mass . We also use an apparent magnitude of the sun , distance to the sun , luminosity of the sun , and distance to the cluster average of . Furthermore, to account for different cluster masses, we employ a simple mass scaling for the luminosity from stars in Eq. (55). Here we assume that the total starlight has the same halo mass scaling as the brightest cluster galaxy (BCG) Haarsma et al. (2010), which is a reasonable assumption since a large contribution of the smoothly distributed starlight in a cluster comes from the BCG. The starlight luminosity as a function of mass is given by
| (56) |
We can now fix the unitless normalization constant for the stars in Eq. (54) by integrating over the cluster volume and spectral distribution of the stars:
| (57) |
The luminosity from dust is derived from the luminosity-richness scaling relation found in Giard et al. (2008) . We pick a high richness cluster with to normalize the luminosity since these clusters are less likely biased by chance coincidences. This richness corresponds to a virial mass of approximately Haarsma et al. (2010). We assume that the dust scales with halo mass in the same way as the stars, and determine the normalization constant for the dust in Eq. (54) to
| (58) |
A.2 Radial profiles
Our goal in this section is to derive a simple spatial model for the distribution of the light from SD in galaxy clusters. For this reason we use stacked cluster observations from the Sloan Digital Sky Survey (SDSS) in the and -band that trace the starlight. For simplicity we assume that the dust traces the stars in the clusters. This is justified for sufficiently young stellar populations (blue BCG and spiral galaxies) or, in the case of the ICL, if the dust got stripped alongside the stars without having been destroyed by spallation processes thereafter. The stacked surface brightness profiles in Zibetti et al. (2005) are measured at redshift with an average mass of the clusters of . As already mentioned, three components contribute to the SD: diffuse ICL, galaxies, and the BCG in the center of clusters. However, the overlapping volume of the galactic light with the DM distribution of a cluster is very small compared to the overlapping volume of ICL- and BCG-light with the DM distribution; thus, the relative contribution of the galaxies to the IC emission is suppressed (c.f. Eq. 41). In our benchmark model for SD, we remove the contribution from galaxies which corresponds to roughly percent of the total SD light. In Fig. 22 we show the SDSS stacked brightness profiles as well as the fitted profiles131313The measured brightness is converted into units of using Mo et al. (2010) , where the sun’s absolute magnitude in the -band is given by Binney and Merrifield (1998) and the luminosity of the sun by ., where both the data and fits are normalized with the central surface brightness of the total SD component, . Our spatial benchmark model is shown with the solid black line.

Instead of modelling the surface brightness with a de Vaucouleur profile and a power-law, we use a double beta profile model to simplify deprojection. It is given by
| (59) |
Our fit parameters for the normalized central brightness, , the core radius, , and slope are given for the total model by
| (60) | |||||
For the smooth model (our benchmark SD model), we find:
| (61) | |||||
The three dimensional spatial profile is derived by deprojecting the surface brightness in Eq. (59) (see e.g. Pfrommer and Enßlin (2004a) for details about the deprojection):
where denotes the beta-function Abramowitz and Stegun (1965).
The radial distribution of the energy density of SD governs the seed photon distribution for IC emission (together with the CMB). The energy density from starlight and dust in a galaxy cluster is given by
where we have used the specific energy density of the light from SD given by Eq. (52). We compare the energy density to other radiation background fields in Fig. 5 for a galaxy cluster with the mass . We find that inside a few percent of of , the total energy density is dominated by the light from SD while the CMB is dominating elsewhere. This implies that if the boost from dark matter (DM) substructures is significant, then the overlap of light from SD with the electron and positron distribution that trace the substructures is small. Hence the resulting flux from inverse Compton (IC) upscattered SD photons is suppressed compared to the IC upscattered CMB photons.
Appendix B Source functions of different DM models
We use DarkSUSY to derive the spectral distribution of the continuum emission from our four DM benchmark (BM) models. These spectra are shown in the left panel of Fig. 1. We choose to fit the source function in the energy regime using the following functional form
| (64) |
where the model specific parameters are given in Table 4.
| BM model | ||||
|---|---|---|---|---|
We also use DarkSUSY to derive the number of electrons and positrons resulting from each annihilation. These spectra are shown in the right panel of Fig. 1. The electron and positron yield resulting from our supersymmetric BM model is fitted in the regime using
| (65) |
Fit parameters are given in Table 5.
| BM model | ||||||||
|---|---|---|---|---|---|---|---|---|
Finally, we use the data from Ciafaloni et al. (2011); Cirelli et al. (2011) to derive the electron and positron yield resulting from leptophilic (LP) DM annihilating indirectly into decaying muons or electrons and positrons. In the energy regime we find the following best fit for the annihilation into muons:
Similarly, for the annihilation into electrons and positrons we find the following best fit:
| (67) |
The LP model, that we are using in this work has a branching factor branching ratio of () into (). The contribution from the electrons from the decaying pions is relative small, hence the resulting electron and positron yield for the LP model is approximately given by
| (68) |
Appendix C Gas density profiles
The production of gamma-rays and secondaries from hadronic CRs in clusters depend both on the gas density and the CR number density, which roughly trace the gas outside the core regime and is slightly enhanced in the center. These gas density profile of galaxy clusters are derived from X-ray observations, where the measurements are mainly sensitive to the central parts of the clusters where there X-ray flux is high, while the core and outer parts are more difficult to measure due to the low signal to noise and often involves extrapolation from the center. The uncertainties in measurements and modelling, in combination with different specifications of active X-ray satellites, give rise to important differences in the gas profiles. Since the gamma-ray flux from a galaxy cluster is sensitive to the details of the gas profile, we choose to model the density profile of four bright clusters (Fornax, Virgo, Coma, Perseus) in more detail where we use the most recent and detailed modelled gas profile available in the literature. We show these profiles in table 6.
The X-ray emitting gas in Fornax does not follow a simple -profile. Instead, based on deep Rosat data and supported by Chandra data, it is best modeled by a multicomponent bidimensional model Paolillo et al. (2002), consisting of: (1) a central component (); (2) a “galactic” component (); and (3) an elliptical ICM component ().
In Fig. 23 we show the data points for the electron number density () in Fornax, derived from the deep Rosat data presented in reference Paolillo et al. (2002), and the best fit density profile together with the individual components. The total profile is derived from their fitted central and galactic surface brightness components while we re-fit the ICM component. The reason for the re-fitted outer component is the large uncertainty in the data points outside which we exclude in our fit. Instead we assume that the outer slop of follows the outer slope of Fornax in the HIFLUGCS catalogue Chen et al. (2007). Deprojecting the fitted surface brightness components yields the following electron number density profile:
| (69) |
where
| (70) | ||||
Note that we remove the contribution of the flat central component of the fit () in the outer parts of the cluster, thus we neglect the central contribution for .
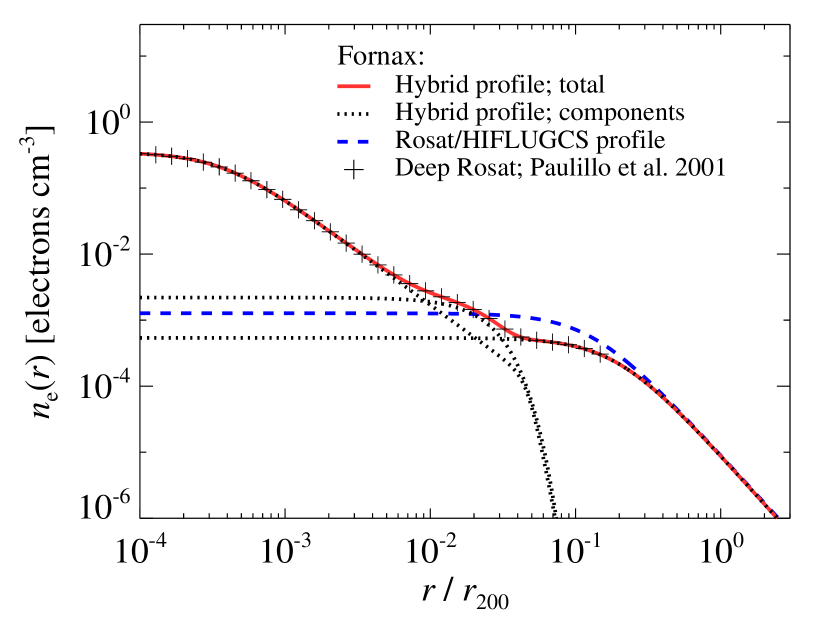
For 106 X-ray bright clusters extended HIFLUGCS catalogue we adopt more general density profiles derived in the recent paper by Chen et al. Chen et al. (2007). They provide single beta-model density fits for all clusters, as well as the double beta-model fits to the surface profiles. We follow the deprojection procedure in Pfrommer and Enßlin (2004a), and only choose the fitted double beta profiles with a that is smaller compared to the single beta profile. 141414We adopt the single beta density profile for A2255 since it harbors a giant radio halo and most likely has a disturbed morphology that might have given the fit the impression of a cool core. Furthermore, the difference in between the single- and double-beta profiles is marginal for this cluster.
Appendix D Flux tables for the HIFLUGCS catalogue
In this section we present the gamma-ray flux predictions using the clusters in the extended HIFLUGCS catalogue. We show the brightest 50 clusters in descending order; CR proton induced that decays into gamma-rays in Table 7, the supersymmetric DM BM- model where the Neutralino emit a continuum as well as final state radiation in Table 8, and LP DM that emit final state radiation and annihilate either indirectly to or through to that IC upscatter CMB photons in Table 9. The flux from DM has been boosted by the substructures, where we in addition include the Sommerfeld enhancement for the LP model. For completeness, we show in Table 10 the parameters that we use to derive the fluxes for the clusters in the HIFLUGCS sample.
| Cluster | ID(1) | (2) | (3) | (4) | (5) | (5,6) | (5,7) |
|---|---|---|---|---|---|---|---|
| PERSEUS | 68 | 14.28 | 19.15 | 52.49 | 16.26 | 16.25 | 10.06 |
| OPHIUCHU | 96 | 7.71 | 10.34 | 28.33 | 8.78 | 8.78 | 6.01 |
| COMA | 34 | 4.15 | 5.56 | 15.24 | 4.72 | 4.72 | 2.55 |
| NORMA | 94 | 2.98 | 3.99 | 10.94 | 3.39 | 3.38 | 2.19 |
| CENTAURU | 30 | 2.61 | 3.50 | 9.58 | 2.97 | 2.97 | 2.62 |
| TRIANGUL | 95 | 1.77 | 2.37 | 6.50 | 2.01 | 2.01 | 0.37 |
| AWM7 | 67 | 1.75 | 2.35 | 6.43 | 1.99 | 1.99 | 1.24 |
| A2319 | 98 | 1.71 | 2.30 | 6.30 | 1.95 | 1.94 | 0.28 |
| A3571 | 39 | 1.61 | 2.15 | 5.90 | 1.83 | 1.82 | 0.41 |
| 3C129 | 70 | 1.35 | 1.82 | 4.98 | 1.54 | 1.54 | 0.71 |
| A2199 | 51 | 1.11 | 1.49 | 4.10 | 1.27 | 1.27 | 0.33 |
| 2A0335 | 11 | 1.04 | 1.40 | 3.83 | 1.19 | 1.19 | 0.19 |
| A2029 | 43 | 1.04 | 1.39 | 3.81 | 1.18 | 1.17 | 0.08 |
| A0496 | 18 | 1.02 | 1.36 | 3.73 | 1.16 | 1.15 | 0.27 |
| HYDRA | 25 | 0.95 | 1.27 | 3.48 | 1.08 | 1.08 | 0.84 |
| A0085 | 1 | 0.93 | 1.25 | 3.44 | 1.06 | 1.06 | 0.12 |
| A2142 | 48 | 0.92 | 1.24 | 3.39 | 1.05 | 1.04 | 0.06 |
| A3266 | 17 | 0.92 | 1.23 | 3.37 | 1.05 | 1.04 | 0.16 |
| A1795 | 40 | 0.91 | 1.22 | 3.35 | 1.04 | 1.04 | 0.11 |
| PKS0745 | 77 | 0.82 | 1.10 | 3.02 | 0.94 | 0.88 | 0.03 |
| A2256 | 54 | 0.78 | 1.04 | 2.86 | 0.89 | 0.88 | 0.11 |
| A3558 | 37 | 0.75 | 1.01 | 2.77 | 0.86 | 0.86 | 0.12 |
| A3667 | 56 | 0.71 | 0.96 | 2.62 | 0.81 | 0.80 | 0.07 |
| A1367 | 26 | 0.70 | 0.94 | 2.59 | 0.80 | 0.80 | 0.43 |
| A0478 | 14 | 0.68 | 0.91 | 2.48 | 0.77 | 0.75 | 0.03 |
| A0401 | 8 | 0.61 | 0.82 | 2.25 | 0.70 | 0.68 | 0.05 |
| A0262 | 5 | 0.57 | 0.77 | 2.10 | 0.65 | 0.65 | 0.26 |
| HYDRA-A | 24 | 0.56 | 0.75 | 2.05 | 0.63 | 0.63 | 0.05 |
| A0754 | 23 | 0.52 | 0.70 | 1.92 | 0.59 | 0.59 | 0.10 |
| A4038 | 62 | 0.52 | 0.69 | 1.90 | 0.59 | 0.59 | 0.13 |
| A2052 | 44 | 0.51 | 0.68 | 1.87 | 0.58 | 0.58 | 0.09 |
| A2147 | 49 | 0.50 | 0.66 | 1.82 | 0.56 | 0.55 | 0.11 |
| A0119 | 2 | 0.48 | 0.64 | 1.76 | 0.54 | 0.54 | 0.10 |
| A0644 | 78 | 0.47 | 0.63 | 1.73 | 0.54 | 0.53 | 0.04 |
| A1644 | 31 | 0.43 | 0.58 | 1.60 | 0.49 | 0.49 | 0.07 |
| A3158 | 13 | 0.39 | 0.53 | 1.45 | 0.45 | 0.44 | 0.04 |
| FORNAX | 10 | 0.36 | 0.49 | 1.34 | 0.42 | 0.42 | 0.41 |
| A2063 | 47 | 0.36 | 0.48 | 1.33 | 0.41 | 0.41 | 0.06 |
| MKW3S | 45 | 0.35 | 0.47 | 1.29 | 0.40 | 0.40 | 0.04 |
| A3112 | 9 | 0.34 | 0.46 | 1.26 | 0.39 | 0.38 | 0.02 |
| ZwCl1742 | 97 | 0.34 | 0.46 | 1.25 | 0.39 | 0.38 | 0.03 |
| A4059 | 63 | 0.33 | 0.45 | 1.23 | 0.38 | 0.38 | 0.05 |
| A1651 | 33 | 0.31 | 0.41 | 1.13 | 0.35 | 0.34 | 0.02 |
| A0399 | 7 | 0.31 | 0.41 | 1.13 | 0.35 | 0.34 | 0.02 |
| NGC1550 | 15 | 0.30 | 0.40 | 1.09 | 0.34 | 0.34 | 0.16 |
| ANTLIA | 79 | 0.29 | 0.39 | 1.06 | 0.33 | 0.33 | 0.22 |
| A2657 | 61 | 0.29 | 0.38 | 1.05 | 0.32 | 0.32 | 0.06 |
| A0539 | 71 | 0.28 | 0.38 | 1.03 | 0.32 | 0.32 | 0.07 |
| A3581 | 41 | 0.28 | 0.37 | 1.03 | 0.32 | 0.32 | 0.07 |
| A2204 | 52 | 0.28 | 0.37 | 1.02 | 0.32 | 0.21 | 0.01 |
Notes: (1) The HIFLUGCS cluster ID. (2) In units of . (3) In units of . (4) In units of . (5) In units of . (6) The flux within , smoothed with a point spread function of . (7) The flux within , smoothed with a point spread function of .
| Cluster | ID(1) | (2) | (2) | (3) | (4) | (4,5) | (4,6) | S/N(7) |
|---|---|---|---|---|---|---|---|---|
| FORNAX | 10 | 31.88 | 20.21 | 11.15 | 32.00 | 31.98 | 30.27 | 9.93 |
| M49 | 81 | 19.48 | 12.35 | 6.81 | 19.55 | 19.54 | 18.13 | 9.29 |
| OPHIUCHU | 96 | 18.13 | 11.49 | 6.34 | 18.19 | 18.14 | 12.31 | 1.66 |
| CENTAURU | 30 | 14.99 | 9.50 | 5.24 | 15.05 | 15.02 | 12.40 | 2.32 |
| HYDRA | 25 | 9.19 | 5.82 | 3.21 | 9.22 | 9.20 | 6.89 | 2.32 |
| NGC4636 | 29 | 9.12 | 5.78 | 3.19 | 9.15 | 9.14 | 8.19 | 5.38 |
| NORMA | 94 | 8.15 | 5.17 | 2.85 | 8.18 | 8.16 | 5.42 | 1.20 |
| PERSEUS | 68 | 7.80 | 4.95 | 2.73 | 7.83 | 7.80 | 4.95 | 0.53 |
| COMA | 34 | 7.58 | 4.81 | 2.65 | 7.61 | 7.58 | 4.41 | 0.95 |
| AWM7 | 67 | 7.31 | 4.64 | 2.56 | 7.34 | 7.31 | 4.66 | 1.39 |
| A1367 | 26 | 6.67 | 4.23 | 2.33 | 6.69 | 6.66 | 3.84 | 1.95 |
| NGC5813 | 91 | 6.25 | 3.96 | 2.19 | 6.28 | 6.27 | 4.97 | 4.26 |
| ANTLIA | 79 | 5.90 | 3.74 | 2.06 | 5.92 | 5.90 | 4.02 | 2.58 |
| A2877 | 65 | 5.00 | 3.17 | 1.75 | 5.02 | 4.99 | 2.54 | 2.66 |
| 3C129 | 70 | 4.71 | 2.99 | 1.65 | 4.73 | 4.70 | 2.42 | 1.02 |
| NGC5044 | 35 | 3.59 | 2.28 | 1.26 | 3.61 | 3.59 | 2.35 | 1.67 |
| NGC5846 | 92 | 3.34 | 2.12 | 1.17 | 3.36 | 3.35 | 2.40 | 3.40 |
| NGC1550 | 15 | 2.53 | 1.61 | 0.89 | 2.54 | 2.53 | 1.36 | 1.15 |
| A3571 | 39 | 2.24 | 1.42 | 0.78 | 2.25 | 2.22 | 0.67 | 0.45 |
| TRIANGUL | 95 | 2.16 | 1.37 | 0.76 | 2.17 | 2.13 | 0.56 | 0.42 |
| A2199 | 51 | 2.05 | 1.30 | 0.72 | 2.06 | 2.03 | 0.68 | 0.50 |
| A2634 | 60 | 2.02 | 1.28 | 0.71 | 2.03 | 2.01 | 0.66 | 1.03 |
| A3266 | 17 | 2.00 | 1.27 | 0.70 | 2.01 | 1.97 | 0.46 | 0.53 |
| A0496 | 18 | 1.93 | 1.22 | 0.67 | 1.94 | 1.91 | 0.60 | 0.49 |
| A0262 | 5 | 1.92 | 1.21 | 0.67 | 1.92 | 1.91 | 0.84 | 0.64 |
| A0754 | 23 | 1.88 | 1.19 | 0.66 | 1.89 | 1.85 | 0.45 | 0.66 |
| A0119 | 2 | 1.87 | 1.19 | 0.65 | 1.88 | 1.84 | 0.49 | 0.68 |
| IIIZw54 | 12 | 1.72 | 1.09 | 0.60 | 1.73 | 1.71 | 0.53 | 1.03 |
| A2319 | 98 | 1.62 | 1.03 | 0.57 | 1.62 | 1.59 | 0.35 | 0.32 |
| A2657 | 61 | 1.55 | 0.98 | 0.54 | 1.55 | 1.53 | 0.40 | 0.73 |
| A3395s | 21 | 1.51 | 0.96 | 0.53 | 1.52 | 1.49 | 0.34 | 0.76 |
| A0539 | 71 | 1.50 | 0.95 | 0.52 | 1.50 | 1.48 | 0.45 | 0.71 |
| A4038 | 62 | 1.48 | 0.94 | 0.52 | 1.49 | 1.47 | 0.45 | 0.52 |
| A0576 | 22 | 1.37 | 0.87 | 0.48 | 1.37 | 1.35 | 0.34 | 0.72 |
| A3376 | 19 | 1.34 | 0.85 | 0.47 | 1.34 | 1.31 | 0.30 | 0.69 |
| A1644 | 31 | 1.33 | 0.84 | 0.47 | 1.34 | 1.31 | 0.29 | 0.51 |
| A3395n | 75 | 1.32 | 0.84 | 0.46 | 1.32 | 1.29 | 0.28 | 0.78 |
| MKW8 | 42 | 1.32 | 0.83 | 0.46 | 1.32 | 1.30 | 0.39 | 0.87 |
| UGC03957 | 76 | 1.28 | 0.81 | 0.45 | 1.28 | 1.26 | 0.33 | 0.74 |
| A2256 | 54 | 1.27 | 0.81 | 0.44 | 1.28 | 1.24 | 0.24 | 0.37 |
| A3558 | 37 | 1.20 | 0.76 | 0.42 | 1.20 | 1.17 | 0.25 | 0.35 |
| A0400 | 6 | 1.17 | 0.74 | 0.41 | 1.17 | 1.16 | 0.35 | 0.66 |
| A3581 | 41 | 1.07 | 0.68 | 0.37 | 1.07 | 1.06 | 0.33 | 0.51 |
| 2A0335 | 11 | 1.05 | 0.67 | 0.37 | 1.05 | 1.03 | 0.25 | 0.26 |
| A0085 | 1 | 1.04 | 0.66 | 0.36 | 1.04 | 1.01 | 0.18 | 0.27 |
| A2052 | 44 | 1.01 | 0.64 | 0.35 | 1.02 | 1.00 | 0.24 | 0.36 |
| A1795 | 40 | 1.00 | 0.64 | 0.35 | 1.01 | 0.97 | 0.16 | 0.27 |
| NGC507 | 4 | 0.99 | 0.63 | 0.35 | 1.00 | 0.99 | 0.34 | 1.28 |
| MKW4 | 27 | 0.95 | 0.60 | 0.33 | 0.95 | 0.94 | 0.29 | 0.65 |
| NGC499 | 66 | 0.95 | 0.60 | 0.33 | 0.95 | 0.94 | 0.33 | 1.53 |
Notes: (1) The HIFLUGCS cluster ID. (2) In units of . (3) In units of . (4) In units of . (5) The flux within , smoothed with a point spread function of . (6) The flux within , smoothed with a point spread function of . (7) Signal to noise (S/N) within above GeV. We estimate the signal to noise through , where yrs is the observation time and is the effective area of Fermi-Lat at GeV.
| Cluster | ID(1) | (2) | (3) | (4) | (5) | (5,6) | (5,7) | S/N(8) |
|---|---|---|---|---|---|---|---|---|
| FORNAX | 10 | 34.87 | 44.21 | 50.48 | 43.11 | 43.09 | 40.74 | 480.43 |
| M49 | 81 | 21.48 | 27.24 | 30.84 | 26.57 | 26.55 | 24.62 | 377.24 |
| OPHIUCHU | 96 | 20.12 | 25.51 | 28.70 | 24.88 | 24.80 | 16.83 | 358.32 |
| CENTAURU | 30 | 16.64 | 21.10 | 23.74 | 20.58 | 20.54 | 16.94 | 329.49 |
| HYDRA | 25 | 10.14 | 12.86 | 14.54 | 12.54 | 12.52 | 9.37 | 258.08 |
| NGC4636 | 29 | 9.96 | 12.63 | 14.44 | 12.32 | 12.31 | 11.00 | 256.79 |
| NORMA | 94 | 8.72 | 11.05 | 12.91 | 10.78 | 10.75 | 7.15 | 236.35 |
| PERSEUS | 68 | 8.66 | 10.98 | 12.35 | 10.71 | 10.67 | 6.77 | 221.99 |
| COMA | 34 | 8.22 | 10.43 | 12.00 | 10.17 | 10.12 | 5.90 | 227.75 |
| AWM7 | 67 | 8.08 | 10.24 | 11.58 | 9.99 | 9.96 | 6.34 | 228.93 |
| A1367 | 26 | 7.24 | 9.18 | 10.56 | 8.95 | 8.91 | 5.14 | 217.96 |
| NGC5813 | 91 | 6.88 | 8.72 | 9.90 | 8.50 | 8.49 | 6.73 | 213.36 |
| ANTLIA | 79 | 6.23 | 7.90 | 9.34 | 7.71 | 7.68 | 5.24 | 202.74 |
| A2877 | 65 | 5.52 | 7.00 | 7.92 | 6.82 | 6.78 | 3.45 | 190.91 |
| 3C129 | 70 | 5.05 | 6.41 | 7.46 | 6.25 | 6.21 | 3.21 | 180.60 |
| NGC5044 | 35 | 3.95 | 5.01 | 5.69 | 4.89 | 4.87 | 3.19 | 161.33 |
| NGC5846 | 92 | 3.65 | 4.63 | 5.29 | 4.52 | 4.50 | 3.23 | 155.50 |
| NGC1550 | 15 | 2.79 | 3.53 | 4.01 | 3.45 | 3.43 | 1.84 | 135.18 |
| A3571 | 39 | 2.48 | 3.15 | 3.55 | 3.07 | 3.03 | 0.92 | 124.33 |
| TRIANGUL | 95 | 2.37 | 3.01 | 3.42 | 2.93 | 2.88 | 0.76 | 120.94 |
| A2199 | 51 | 2.26 | 2.87 | 3.24 | 2.80 | 2.76 | 0.93 | 119.51 |
| A2634 | 60 | 2.22 | 2.81 | 3.20 | 2.74 | 2.71 | 0.90 | 120.59 |
| A3266 | 17 | 2.18 | 2.76 | 3.17 | 2.69 | 2.63 | 0.62 | 117.65 |
| A0496 | 18 | 2.14 | 2.72 | 3.06 | 2.65 | 2.62 | 0.83 | 116.49 |
| A0262 | 5 | 2.11 | 2.67 | 3.03 | 2.60 | 2.58 | 1.14 | 116.57 |
| A0754 | 23 | 2.08 | 2.63 | 2.98 | 2.57 | 2.52 | 0.61 | 115.87 |
| A0119 | 2 | 2.00 | 2.53 | 2.96 | 2.47 | 2.43 | 0.66 | 113.70 |
| IIIZw54 | 12 | 1.89 | 2.39 | 2.73 | 2.33 | 2.30 | 0.72 | 111.27 |
| A2319 | 98 | 1.77 | 2.24 | 2.56 | 2.19 | 2.13 | 0.47 | 103.33 |
| A2657 | 61 | 1.71 | 2.17 | 2.45 | 2.12 | 2.08 | 0.54 | 105.65 |
| A0539 | 71 | 1.65 | 2.09 | 2.37 | 2.04 | 2.01 | 0.62 | 103.75 |
| A4038 | 62 | 1.64 | 2.08 | 2.35 | 2.03 | 2.01 | 0.62 | 102.79 |
| A3395s | 21 | 1.62 | 2.06 | 2.40 | 2.01 | 1.96 | 0.46 | 102.94 |
| A0576 | 22 | 1.47 | 1.87 | 2.17 | 1.82 | 1.79 | 0.46 | 98.07 |
| A1644 | 31 | 1.45 | 1.84 | 2.11 | 1.79 | 1.75 | 0.39 | 96.55 |
| MKW8 | 42 | 1.44 | 1.83 | 2.08 | 1.78 | 1.76 | 0.53 | 97.25 |
| UGC03957 | 76 | 1.41 | 1.79 | 2.02 | 1.75 | 1.71 | 0.45 | 96.10 |
| A3376 | 19 | 1.41 | 1.78 | 2.12 | 1.74 | 1.70 | 0.40 | 95.76 |
| A3395n | 75 | 1.40 | 1.78 | 2.09 | 1.73 | 1.69 | 0.37 | 95.79 |
| A2256 | 54 | 1.37 | 1.73 | 2.01 | 1.69 | 1.64 | 0.32 | 92.60 |
| A3558 | 37 | 1.31 | 1.66 | 1.89 | 1.62 | 1.58 | 0.34 | 90.53 |
| A0400 | 6 | 1.26 | 1.60 | 1.85 | 1.56 | 1.54 | 0.47 | 90.68 |
| A3581 | 41 | 1.18 | 1.50 | 1.70 | 1.46 | 1.44 | 0.45 | 87.46 |
| 2A0335 | 11 | 1.17 | 1.48 | 1.66 | 1.44 | 1.41 | 0.34 | 84.20 |
| A0085 | 1 | 1.15 | 1.46 | 1.64 | 1.42 | 1.38 | 0.25 | 83.97 |
| A2052 | 44 | 1.13 | 1.43 | 1.61 | 1.39 | 1.36 | 0.32 | 84.47 |
| A1795 | 40 | 1.11 | 1.41 | 1.59 | 1.38 | 1.33 | 0.23 | 82.62 |
| NGC507 | 4 | 1.09 | 1.39 | 1.57 | 1.35 | 1.34 | 0.46 | 85.00 |
| MKW4 | 27 | 1.04 | 1.32 | 1.50 | 1.29 | 1.27 | 0.39 | 82.67 |
| NGC499 | 66 | 1.04 | 1.32 | 1.50 | 1.28 | 1.27 | 0.45 | 82.88 |
Notes: (1) The HIFLUGCS cluster ID. (2) In units of . (3) In units of . (4) In units of . (5) In units of . (6) The flux within , smoothed with a point spread function of . (7) The flux within , smoothed with a point spread function of . (8) Signal to noise (S/N) within above GeV. We estimate the signal to noise through , where yrs is the observation time and is the effective area of Fermi-Lat at GeV.
| Cluster | ID(1) | (1) | (2) | (2) | (3) | (3) | (3) | (3) | (3) | (3) | (4) | (5) | |
|---|---|---|---|---|---|---|---|---|---|---|---|---|---|
| [Mpc] | [Mpc] | [deg] | [] | [] | [kpc] | [] | [kpc] | [deg] | [deg] | ||||
| A0085 | 1 | 248.29 | 2.11 | 0.49 | 10.90 | 3.02 | 41 | 0.60 | 0.32 | 275 | 0.73 | 0.04 | 0.22 |
| A0119 | 2 | 194.82 | 2.18 | 0.64 | 11.90 | 0.17 | 285 | 0.76 | 0.06 | 1079 | 1.46 | 0.12 | 0.29 |
| A0133 | 3 | 254.34 | 1.78 | 0.40 | 6.50 | 3.30 | 30 | 0.65 | 0.24 | 229 | 0.78 | 0.02 | 0.18 |
| NGC507 | 4 | 71.57 | 0.97 | 0.78 | 1.10 | 0.59 | 29 | 0.76 | 1.24 | 52 | 4.29 | 0.01 | 0.35 |
| A0262 | 5 | 69.81 | 1.17 | 0.96 | 1.90 | 0.96 | 29 | 0.44 | 0.00 | 0 | 0.00 | 0.17 | 0.44 |
| A0400 | 6 | 104.69 | 1.29 | 0.71 | 2.50 | 0.24 | 110 | 0.53 | 0.00 | 0 | 0.00 | 0.13 | 0.32 |
| A0399 | 7 | 323.00 | 2.09 | 0.37 | 10.50 | 0.26 | 320 | 0.71 | 0.00 | 0 | 0.00 | 0.07 | 0.17 |
| A0401 | 8 | 338.70 | 2.13 | 0.36 | 11.20 | 0.69 | 170 | 0.69 | 0.17 | 375 | 0.66 | 0.05 | 0.16 |
| A3112 | 9 | 339.66 | 1.78 | 0.30 | 6.50 | 4.12 | 36 | 0.63 | 0.62 | 117 | 0.62 | 0.01 | 0.14 |
| FORNAX | 10 | 19.77 | 1.28 | 3.70 | 2.40 | 0.11 | 123 | 0.80 | 0.00 | 0 | 0.00 | 0.31 | 1.69 |
| 2A0335 | 11 | 153.49 | 1.58 | 0.59 | 4.50 | 6.47 | 23 | 0.57 | 0.00 | 0 | 0.00 | 0.02 | 0.27 |
| IIIZw54 | 12 | 136.39 | 1.71 | 0.72 | 5.80 | 0.24 | 206 | 0.89 | 0.00 | 0 | 0.00 | 0.07 | 0.33 |
| A3158 | 13 | 264.13 | 1.92 | 0.42 | 8.20 | 0.46 | 191 | 0.66 | 0.00 | 0 | 0.00 | 0.05 | 0.19 |
| A0478 | 14 | 411.96 | 2.17 | 0.30 | 11.70 | 4.14 | 51 | 0.68 | 0.73 | 180 | 0.71 | 0.02 | 0.14 |
| NGC1550 | 15 | 53.18 | 1.08 | 1.16 | 1.40 | 0.89 | 32 | 0.55 | 0.00 | 0 | 0.00 | 0.07 | 0.53 |
| EXO0422 | 16 | 172.04 | 1.57 | 0.52 | 4.40 | 0.78 | 101 | 0.72 | 0.00 | 0 | 0.00 | 0.04 | 0.24 |
| A3266 | 17 | 266.00 | 2.69 | 0.58 | 22.40 | 0.30 | 321 | 1.20 | 0.15 | 830 | 1.27 | 0.08 | 0.26 |
| A0496 | 18 | 144.03 | 1.83 | 0.73 | 7.10 | 4.80 | 21 | 0.59 | 0.34 | 183 | 0.69 | 0.04 | 0.33 |
| A3376 | 19 | 201.69 | 2.01 | 0.57 | 9.40 | 0.12 | 538 | 1.05 | 0.00 | 0 | 0.00 | 0.10 | 0.26 |
| A3391 | 20 | 236.69 | 1.95 | 0.47 | 8.50 | 0.46 | 50 | 0.50 | 0.21 | 239 | 0.66 | 0.07 | 0.22 |
| A3395s | 21 | 221.45 | 2.21 | 0.57 | 12.40 | 0.15 | 431 | 0.96 | 0.00 | 0 | 0.00 | 0.08 | 0.26 |
| A0576 | 22 | 167.96 | 1.81 | 0.62 | 6.80 | 0.19 | 281 | 0.82 | 0.00 | 0 | 0.00 | 0.09 | 0.28 |
| A0754 | 23 | 235.31 | 2.45 | 0.60 | 17.00 | 0.52 | 170 | 0.70 | 0.00 | 0 | 0.00 | 0.05 | 0.27 |
| HYDRA-A | 24 | 239.94 | 1.75 | 0.42 | 6.20 | 4.15 | 70 | 1.84 | 0.85 | 130 | 0.73 | 0.02 | 0.19 |
| HYDRA | 25 | 49.25 | 1.53 | 1.78 | 4.10 | 0.56 | 67 | 0.61 | 0.00 | 0 | 0.00 | 0.13 | 0.81 |
| A1367 | 26 | 94.05 | 2.06 | 1.25 | 10.10 | 0.16 | 207 | 0.96 | 0.08 | 697 | 1.51 | 0.17 | 0.57 |
| MKW4 | 27 | 86.98 | 1.08 | 0.71 | 1.40 | 3.45 | 7 | 0.44 | 0.00 | 0 | 0.00 | 0.07 | 0.33 |
| ZwCl1215 | 28 | 339.66 | 2.21 | 0.37 | 12.40 | 0.32 | 307 | 0.82 | 0.00 | 0 | 0.00 | 0.05 | 0.17 |
| NGC4636 | 29 | 15.89 | 0.76 | 2.74 | 0.50 | 1.99 | 4 | 0.49 | 0.00 | 0 | 0.00 | 0.07 | 1.25 |
| CENTAURU | 30 | 44.46 | 1.67 | 2.15 | 5.30 | 2.16 | 23 | 0.57 | 0.16 | 194 | 0.70 | 0.15 | 0.98 |
| A1644 | 31 | 210.40 | 2.06 | 0.56 | 10.00 | 0.33 | 195 | 0.83 | 0.06 | 1549 | 2.38 | 0.10 | 0.26 |
| A1650 | 32 | 385.28 | 1.99 | 0.30 | 9.10 | 0.51 | 200 | 0.70 | 0.00 | 0 | 0.00 | 0.04 | 0.14 |
| A1651 | 33 | 392.54 | 2.13 | 0.31 | 11.10 | 1.24 | 85 | 0.75 | 0.39 | 254 | 0.76 | 0.03 | 0.14 |
| COMA | 34 | 101.14 | 2.24 | 1.27 | 12.90 | 0.36 | 245 | 0.65 | 0.00 | 0 | 0.00 | 0.20 | 0.58 |
| NGC5044 | 35 | 38.81 | 0.99 | 1.46 | 1.10 | 4.08 | 7 | 0.52 | 0.00 | 0 | 0.00 | 0.03 | 0.67 |
| A1736 | 36 | 204.44 | 1.47 | 0.41 | 3.70 | 0.15 | 267 | 0.54 | 0.00 | 0 | 0.00 | 0.12 | 0.19 |
| A3558 | 37 | 213.16 | 2.01 | 0.54 | 9.30 | 0.54 | 165 | 0.68 | 0.07 | 855 | 1.17 | 0.08 | 0.25 |
| A3562 | 38 | 221.91 | 1.68 | 0.43 | 5.50 | 0.69 | 73 | 0.52 | 0.04 | 957 | 1.26 | 0.07 | 0.20 |
| A3571 | 39 | 175.22 | 2.16 | 0.71 | 11.60 | 1.14 | 67 | 0.82 | 0.60 | 182 | 0.68 | 0.07 | 0.32 |
| A1795 | 40 | 276.29 | 2.23 | 0.46 | 12.80 | 3.39 | 56 | 0.72 | 0.32 | 308 | 0.89 | 0.02 | 0.21 |
| A3581 | 41 | 93.17 | 1.17 | 0.72 | 1.80 | 1.91 | 25 | 0.54 | 0.00 | 0 | 0.00 | 0.04 | 0.33 |
| MKW8 | 42 | 118.04 | 1.44 | 0.70 | 3.50 | 0.31 | 75 | 0.51 | 0.00 | 0 | 0.00 | 0.11 | 0.32 |
| A2029 | 43 | 347.78 | 2.24 | 0.37 | 12.90 | 4.54 | 44 | 0.63 | 0.80 | 152 | 0.65 | 0.02 | 0.17 |
| A2052 | 44 | 153.04 | 1.56 | 0.58 | 4.40 | 3.30 | 60 | 2.10 | 0.71 | 100 | 0.66 | 0.03 | 0.27 |
| MKW3S | 45 | 199.40 | 1.64 | 0.47 | 5.10 | 2.12 | 65 | 1.42 | 0.71 | 108 | 0.68 | 0.02 | 0.22 |
| A2065 | 46 | 325.85 | 2.31 | 0.41 | 14.20 | 0.24 | 492 | 1.16 | 0.00 | 0 | 0.00 | 0.05 | 0.19 |
| A2063 | 47 | 155.75 | 1.51 | 0.56 | 4.00 | 1.12 | 39 | 0.49 | 0.18 | 457 | 2.02 | 0.06 | 0.25 |
| A2142 | 48 | 411.47 | 2.48 | 0.35 | 17.50 | 1.90 | 100 | 0.67 | 0.18 | 637 | 1.01 | 0.03 | 0.16 |
| A2147 | 49 | 154.39 | 1.50 | 0.56 | 3.90 | 0.20 | 169 | 0.44 | 0.00 | 0 | 0.00 | 0.16 | 0.25 |
| A2163 | 50 | 990.91 | 2.55 | 0.15 | 19.20 | 0.63 | 370 | 0.80 | 0.00 | 0 | 0.00 | 0.02 | 0.07 |
| A2199 | 51 | 132.35 | 1.77 | 0.77 | 6.40 | 0.98 | 99 | 0.65 | 0.00 | 0 | 0.00 | 0.06 | 0.35 |
| A2204 | 52 | 727.47 | 1.93 | 0.15 | 8.30 | 6.00 | 47 | 0.60 | 0.00 | 0 | 0.00 | 0.01 | 0.07 |
| A2244 | 53 | 446.19 | 1.90 | 0.24 | 7.90 | 1.42 | 89 | 0.61 | 0.00 | 0 | 0.00 | 0.02 | 0.11 |
| A2256 | 54 | 269.27 | 2.36 | 0.50 | 15.20 | 0.31 | 419 | 0.91 | 0.00 | 0 | 0.00 | 0.07 | 0.23 |
| A2255 | 55 | 363.60 | 2.10 | 0.33 | 10.60 | 0.21 | 423 | 0.80 | 0.00 | 0 | 0.00 | 0.06 | 0.15 |
| Cluster | ID(1) | (1) | (2) | (2) | (3) | (3) | (3) | (3) | (3) | (3) | (4) | (5) | |
|---|---|---|---|---|---|---|---|---|---|---|---|---|---|
| [Mpc] | [Mpc] | [deg] | [] | [] | [kpc] | [] | [kpc] | [deg] | [deg] | ||||
| A3667 | 56 | 250.15 | 1.88 | 0.43 | 7.60 | 0.39 | 287 | 0.89 | 0.06 | 1696 | 1.70 | 0.09 | 0.20 |
| S1101 | 57 | 259.46 | 1.60 | 0.35 | 4.70 | 3.43 | 47 | 0.79 | 0.20 | 272 | 0.96 | 0.01 | 0.16 |
| A2589 | 58 | 183.87 | 1.64 | 0.51 | 5.10 | 0.85 | 67 | 0.66 | 0.19 | 222 | 0.74 | 0.04 | 0.23 |
| A2597 | 59 | 388.66 | 1.71 | 0.25 | 5.70 | 4.29 | 40 | 0.63 | 0.00 | 0 | 0.00 | 0.01 | 0.12 |
| A2634 | 60 | 136.84 | 1.80 | 0.75 | 6.70 | 0.28 | 57 | 0.47 | 0.07 | 849 | 1.89 | 0.14 | 0.34 |
| A2657 | 61 | 178.41 | 1.95 | 0.63 | 8.60 | 0.63 | 105 | 0.89 | 0.10 | 568 | 1.27 | 0.05 | 0.29 |
| A4038 | 62 | 123.85 | 1.54 | 0.71 | 4.20 | 1.75 | 37 | 0.58 | 0.19 | 172 | 0.70 | 0.05 | 0.33 |
| A4059 | 63 | 203.98 | 1.79 | 0.50 | 6.60 | 1.39 | 58 | 0.64 | 0.15 | 312 | 0.90 | 0.03 | 0.23 |
| A2734 | 64 | 278.16 | 1.83 | 0.38 | 7.10 | 0.38 | 150 | 0.62 | 0.00 | 0 | 0.00 | 0.05 | 0.17 |
| A2877 | 65 | 105.13 | 2.02 | 1.10 | 9.50 | 0.21 | 230 | 3.58 | 0.08 | 432 | 1.23 | 0.11 | 0.50 |
| NGC499 | 66 | 63.67 | 0.89 | 0.80 | 0.80 | 1.11 | 16 | 0.72 | 0.00 | 0 | 0.00 | 0.01 | 0.37 |
| AWM7 | 67 | 74.64 | 1.84 | 1.41 | 7.20 | 0.69 | 89 | 0.78 | 0.19 | 290 | 0.88 | 0.12 | 0.65 |
| PERSEUS | 68 | 79.48 | 1.95 | 1.41 | 8.60 | 3.84 | 45 | 0.54 | 0.00 | 0 | 0.00 | 0.10 | 0.64 |
| S405 | 69 | 274.88 | 1.81 | 0.38 | 6.80 | 0.14 | 327 | 0.66 | 0.00 | 0 | 0.00 | 0.09 | 0.17 |
| 3C129 | 70 | 97.15 | 1.89 | 1.11 | 7.80 | 0.21 | 227 | 0.60 | 0.00 | 0 | 0.00 | 0.22 | 0.51 |
| A0539 | 71 | 126.08 | 1.56 | 0.71 | 4.40 | 0.83 | 30 | 0.53 | 0.18 | 223 | 0.75 | 0.09 | 0.32 |
| S540 | 72 | 157.55 | 1.53 | 0.56 | 4.20 | 0.47 | 92 | 0.64 | 0.00 | 0 | 0.00 | 0.05 | 0.25 |
| A0548w | 73 | 187.52 | 1.19 | 0.36 | 2.00 | 0.12 | 141 | 0.67 | 0.00 | 0 | 0.00 | 0.05 | 0.17 |
| A0548e | 74 | 181.14 | 1.33 | 0.42 | 2.70 | 0.33 | 84 | 0.48 | 0.00 | 0 | 0.00 | 0.09 | 0.19 |
| A3395n | 75 | 221.45 | 2.12 | 0.55 | 10.90 | 0.12 | 480 | 0.98 | 0.00 | 0 | 0.00 | 0.09 | 0.25 |
| UGC03957 | 76 | 149.43 | 1.65 | 0.63 | 5.20 | 0.57 | 101 | 0.74 | 0.00 | 0 | 0.00 | 0.04 | 0.29 |
| PKS0745 | 77 | 474.79 | 2.04 | 0.25 | 9.80 | 6.71 | 51 | 0.70 | 0.70 | 167 | 0.65 | 0.01 | 0.11 |
| A0644 | 78 | 317.77 | 2.14 | 0.39 | 11.20 | 0.92 | 144 | 0.70 | 0.00 | 0 | 0.00 | 0.03 | 0.18 |
| ANTLIA | 79 | 50.13 | 1.35 | 1.54 | 2.80 | 0.08 | 245 | 0.75 | 0.00 | 0 | 0.00 | 0.28 | 0.71 |
| A1413 | 80 | 677.27 | 2.23 | 0.19 | 12.70 | 1.44 | 110 | 0.80 | 0.26 | 399 | 0.91 | 0.01 | 0.09 |
| M49 | 81 | 18.91 | 1.07 | 3.24 | 1.40 | 1.57 | 7 | 0.59 | 0.00 | 0 | 0.00 | 0.04 | 1.48 |
| A3528n | 82 | 240.86 | 1.80 | 0.43 | 6.70 | 0.40 | 126 | 0.62 | 0.00 | 0 | 0.00 | 0.05 | 0.20 |
| A3528s | 83 | 245.97 | 1.57 | 0.37 | 4.50 | 0.57 | 71 | 0.46 | 0.00 | 0 | 0.00 | 0.08 | 0.17 |
| A3530 | 84 | 242.72 | 1.78 | 0.42 | 6.50 | 0.15 | 300 | 0.77 | 0.00 | 0 | 0.00 | 0.07 | 0.19 |
| A3532 | 85 | 240.40 | 2.00 | 0.48 | 9.20 | 0.34 | 137 | 0.74 | 0.11 | 543 | 1.09 | 0.06 | 0.22 |
| A1689 | 86 | 897.29 | 2.51 | 0.16 | 18.20 | 2.46 | 108 | 0.88 | 0.46 | 336 | 0.91 | 0.01 | 0.07 |
| A3560 | 87 | 220.07 | 1.58 | 0.41 | 4.50 | 0.20 | 182 | 0.57 | 0.00 | 0 | 0.00 | 0.09 | 0.19 |
| A1775 | 88 | 343.00 | 1.76 | 0.29 | 6.30 | 0.35 | 385 | 2.05 | 0.07 | 1030 | 1.70 | 0.04 | 0.13 |
| A1800 | 89 | 338.70 | 1.94 | 0.33 | 8.40 | 0.21 | 279 | 0.77 | 0.00 | 0 | 0.00 | 0.05 | 0.15 |
| A1914 | 90 | 827.98 | 2.35 | 0.16 | 14.90 | 1.32 | 164 | 0.75 | 0.00 | 0 | 0.00 | 0.01 | 0.07 |
| NGC5813 | 91 | 27.55 | 0.95 | 1.98 | 1.00 | 1.06 | 17 | 0.77 | 0.00 | 0 | 0.00 | 0.03 | 0.90 |
| NGC5846 | 92 | 26.25 | 0.76 | 1.66 | 0.50 | 4.15 | 2 | 0.51 | 0.70 | 39 | 4.78 | 0.02 | 0.76 |
| A2151w | 93 | 162.53 | 1.36 | 0.48 | 2.90 | 0.97 | 48 | 0.56 | 0.00 | 0 | 0.00 | 0.04 | 0.22 |
| NORMA | 94 | 70.69 | 1.84 | 1.49 | 7.20 | 0.22 | 213 | 0.56 | 0.00 | 0 | 0.00 | 0.33 | 0.68 |
| TRIANGUL | 95 | 226.98 | 2.50 | 0.63 | 18.00 | 0.63 | 177 | 0.71 | 0.17 | 500 | 0.80 | 0.08 | 0.29 |
| OPHIUCHU | 96 | 122.51 | 3.28 | 1.53 | 40.50 | 0.80 | 234 | 1.04 | 0.12 | 850 | 1.40 | 0.10 | 0.70 |
| ZwCl1742 | 97 | 343.00 | 2.25 | 0.38 | 13.10 | 0.71 | 165 | 0.72 | 0.00 | 0 | 0.00 | 0.03 | 0.17 |
| A2319 | 98 | 252.01 | 2.44 | 0.55 | 16.70 | 0.58 | 273 | 1.06 | 0.16 | 624 | 0.82 | 0.08 | 0.25 |
| A3695 | 99 | 407.09 | 2.03 | 0.29 | 9.70 | 0.24 | 284 | 0.64 | 0.00 | 0 | 0.00 | 0.06 | 0.13 |
| IIZw108 | 100 | 219.60 | 1.72 | 0.45 | 5.90 | 0.17 | 260 | 0.66 | 0.00 | 0 | 0.00 | 0.08 | 0.21 |
| A3822 | 101 | 344.43 | 1.82 | 0.30 | 6.90 | 0.25 | 250 | 0.64 | 0.00 | 0 | 0.00 | 0.06 | 0.14 |
| A3827 | 102 | 451.10 | 2.53 | 0.32 | 18.70 | 0.31 | 423 | 0.99 | 0.00 | 0 | 0.00 | 0.04 | 0.15 |
| A3888 | 103 | 720.64 | 3.04 | 0.24 | 32.40 | 0.61 | 285 | 0.93 | 0.00 | 0 | 0.00 | 0.02 | 0.11 |
| A3921 | 104 | 429.52 | 2.00 | 0.27 | 9.20 | 0.40 | 234 | 0.76 | 0.00 | 0 | 0.00 | 0.03 | 0.12 |
| HCG94 | 105 | 184.32 | 1.49 | 0.46 | 3.80 | 0.80 | 42 | 0.53 | 0.19 | 142 | 0.58 | 0.06 | 0.21 |
| RXJ2344 | 106 | 356.88 | 2.17 | 0.35 | 11.80 | 0.51 | 91 | 0.72 | 0.32 | 285 | 0.92 | 0.03 | 0.16 |
Notes: (1) The HIFLUGCS cluster ID and luminosity distance () are taken from Reiprich and Böhringer (2002). (2) The virial mass () for each cluster is derived from the mass in Chen et al. (2007). We solve for using Voit (2005). The virial radius () is derived from . (3) The electron number density profile of each cluster follows either a single- or double-beta profile; where the central electron density, , core radius, , and slope, , are derived from Chen et al. (2007). (4) Half light radius () of the flux from CR-. (5) Half light radius () of the flux from the BM- continuum and LP-IC-CMB emission. The flux has been boosted by substructures and includes the Sommerfeld enhancement for the LP model.