The Role of Ejecta
in the Small Crater Populations
on the Mid-Sized Saturnian Satellites
Abstract
We find evidence, by both observation and analysis, that crater ejecta play an important role in the small crater (less than a few km) populations on the Saturnian satellites, and more broadly, on cratered surfaces throughout the Solar System. We measure crater populations in Cassini images of Enceladus, Rhea, and Mimas, focusing on image data with scales less than 500 m/pixel. We use recent updates to crater scaling laws and their constants (Housen and Holsapple, 2011) to estimate the amount of mass ejected in three different velocity ranges: (i) greater than escape velocity, (ii) less than escape velocity and faster than the minimum velocity required to make a secondary crater (), and (iii), velocities less than . Although the vast majority of mass on each satellite is ejected at speeds less than , our calculations demonstrate that the differences in mass available in the other two categories should lead to observable differences in the small crater populations; the predictions are borne out by the measurements we have made to date. In particular, Rhea, Tethys, and Dione have sufficient surface gravities to retain ejecta moving fast enough to make secondary crater populations. The smaller satellites, such as Enceladus but especially Mimas, are expected to have little or no traditional secondary populations because their escape velocities are near the threshold velocity necessary to make a secondary crater. Our work clarifies why the Galilean satellites have extensive secondary crater populations relative to the Saturnian satellites. The presence, extent, and sizes of sesquinary craters (craters formed by ejecta that escape into temporary orbits around Saturn before re-impacting the surface (Dobrovolskis and Lissauer, 2004; Alvarellos et al., 2005; Zahnle et al., 2008) is not yet well understood. Finally, our work provides further evidence for a “shallow” size-frequency distribution (slope index of for a differential power-law) for comets a few kilometers diameter and smaller.
keywords:
crater ejecta, secondary craters, sesquinary craters, Saturnian satellites, , , and
Copyright © 2011 Edward B. Bierhaus, Luke Dones, José Alvarellos, and Kevin Zahnle
Proposed Running Head:
Ejecta and small craters in the Saturnian system
Please send Editorial Correspondence to:
Edward B. Bierhaus
Lockheed Martin Space Systems Company
MS S8110
PO Box 179
Denver, CO 80201
1 Introduction
Without access to planetary samples from outer Solar System objects, cataloguing the size-frequency distribution (SFD) and spatial distribution of impact craters is a common means to determine surface ages. Constraining age on an object, and between objects, is critical to establish a coherent and consistent chronology of events within a planetary system, or across the Solar System. Combining the measured crater SFD with known or modeled crater formation rates provides a means to estimate absolute age.
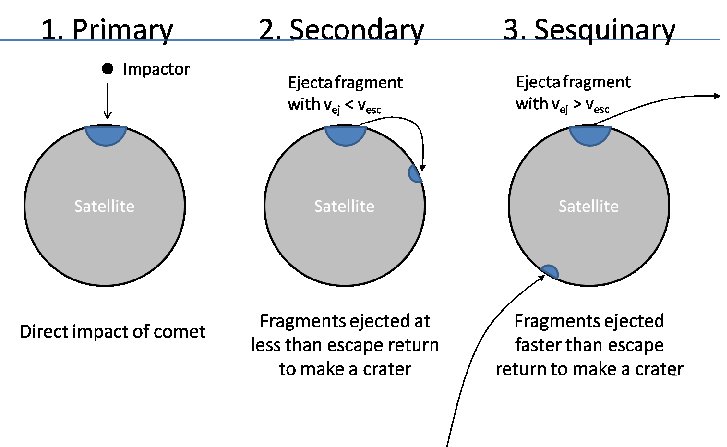
To derive accurate ages using impact craters, in either the relative or absolute sense, one must first determine the sources of impactors that make craters. Impact craters can be primary, secondary or sesquinary; see Figure 1. Primary craters are made by direct impact of comets or asteroids. Secondary craters are the result of essentially ballistic trajectories of ejecta from the primary crater to some distance away. For typical impact speeds of heliocentric comets onto Saturnian satellites of several to 30 km/s (Zahnle et al., 2003; Dones et al., 2009), ejecta can be launched at speeds from a few hundred m/s to several km/s. When an ejectum is launched at a speed faster than the escape velocity of a moon, it can go into orbit about the planet. Most escaped ejecta are eventually swept up by the source moon, but the orbits of some escaped ejecta can be sufficiently perturbed, or the original ejection velocity so high, that the ejecta will impact another satellite (Alvarellos et al., 2005, 2002). In either case, craters formed by ejecta that initially escape their parent object are called sesquinary (“-ary”; formerly “poltorary”) craters (Dobrovolskis and Lissauer, 2004; Zahnle et al., 2008). Because secondary and sesquinary craters are products of primary craters, and because the larger (and therefore generally older) primary craters create the most ejecta, older terrains will have the greatest number of craters of all types. This introduces uncertainty in the number of primary craters, which is the only kind to be trusted chronometrically (McEwen and Bierhaus, 2006).
Most Voyager-era studies of craters on the Saturnian moons identified two basic classes, called Population I and Population II (Smith et al., 1981, 1982). Population II follows a steeper size-frequency distribution than Population I (i.e., in relative terms, Population II has a smaller number of large craters). One hypothesis proposed (e.g., Chapman and McKinnon (1986)) that heliocentric comets are responsible for Population I, while planetocentric debris from cratering or catastrophic disruption of moons is responsible for Population II. A second hypothesis (e.g., Strom and Woronow (1982)) proposed that planetocentric debris largely is responsible for both populations. A third (Plescia and Boyce, 1985) suggested that Population II was created by late-arriving bodies from heliocentric orbit. The existence of two populations was questioned by Lissauer et al. (1988), who argued that the Voyager data on small craters might be consistent with (near-)saturation equilibrium produced by heliocentric impactors (Hartmann, 1984). For our purposes, the key point is that ever since craters were first seen on the Saturnian moons, the question of whether the impactors were heliocentric, planetocentric, or both has been controversial.
Since the Voyager flybys, a number of developments have taken place (see reviews by Chapman and McKinnon (1986); Schenk and Pappalardo (2004); Dones et al. (2009)). First is the confirmation of the Shoemaker and Wolfe (1981) and Shoemaker and Wolfe (1982) prediction that heliocentric “ecliptic” comets should dominate primary impacts on planets and regular satellites in the outer Solar System (Levison and Duncan, 1997; Zahnle et al., 1998, 2003), and the discovery of their putative source region, the Kuiper Belt/Scattered Disk (Barucci et al., 2008). Second is the resurrection of Shoemaker’s (Shoemaker, 1965) observation that secondary craters can be a major component of the small crater population (Bierhaus et al., 2005; McEwen et al., 2005; McEwen and Bierhaus, 2006). Third is the detailed modeling of the dynamical behavior of escaped ejecta in multi-body systems (such as the Saturnian system), leading to the first quantitative estimate of the effect of sesquinary ejecta launched from large craters on the mid-sized moons (Moore et al., 2004) on the cratering population (Alvarellos et al., 2005). Fourth is the ongoing laboratory and analytical work into the physics of crater ejecta (Melosh, 1984; Housen and Holsapple, 2011). Fifth is the possible origin of irregular satellites of the giant planets, and possible consequences of their collisional evolution for the cratering record on inner satellites (Bottke et al., 2010). The capstone, of course, is the presence of the Cassini mission at Saturn, and the imaging (ISS) data that enable a significant improvement of the catalogue of craters. Crater counts on the Saturnian moons using ISS images have been published for the following moons: Phoebe and Iapetus (Porco et al., 2005); Hyperion and Phoebe (Thomas et al., 2007); basins on the leading face of Iapetus (Giese et al., 2008); Enceladus (Porco et al., 2006; Kirchoff and Schenk, 2009); and Mimas, Tethys, Dione, Rhea, Iapetus, and Phoebe (Kirchoff and Schenk, 2010). Counts for Titan, using Cassini’s radar instrument, have been published by Lorenz et al. (2007); Wood et al. (2010), and Neish and Lorenz (2011).
The first development cited above – the prediction that ecliptic comets are the primary impactors on the regular satellites of the giant planets – is based, in large part, on the sheer numbers of comets that seem to wander the outer Solar System (Zahnle et al., 1998, 2003). Estimates of the impactor populations at each planet mostly rely on interpolation between observations of Jupiter-family comets (generally seen well interior to Jupiter’s orbit, and prone to disintegrate for reasons that are not understood) and counts of (large) Centaurs and Kuiper Belt Objects, corrected for discovery biases with the help of dynamical models (Dones et al., 2009). Detailed comparison of crater SFDs and the independently known population of impactors, such as has been carried out for the Moon by Marchi et al. (2009), is not possible for satellites in the outer Solar System.
On synchronously rotating satellites, ecliptic comets are much more likely to strike the moons’ leading hemispheres (Shoemaker and Wolfe, 1982; Horedt and Neukum, 1984a; Zahnle et al., 2001). The expected “apex-antapex asymmetries” do not occur to the extent expected, although craters on bright terrains on Ganymede (Zahnle et al., 2001; Schenk and Pappalardo, 2004) and rayed craters on Saturnian satellites (Schenk and Murphy, 2011) do exhibit smaller asymmetries in the expected sense. (Triton is just weird; see Schenk and Zahnle (2007) if you must know the details.) The absent or muted apex/antapex effect might be due to crater saturation, true polar wander, or some form of nonsynchronous rotation. In addition, moons closer to their parent planets should be more heavily cratered because of gravitational focusing (Smith et al., 1981, 1982; Zahnle et al., 2003). This effect is not observed either, perhaps as a result of saturation, at least for small craters, due to an early era of heavy bombardment (Chapman and McKinnon, 1986; Dones et al., 2009; Richardson, 2009).
Alternatively, one can abandon the hypothesis that the impactors have a heliocentric origin, and posit that the craters are produced by planetocentric (Saturn-orbiting) bodies (Horedt and Neukum, 1984b; Neukum, 1985). The planetocentric model has the advantage that planetocentric cratering only weakly favors a satellite’s leading or trailing side, depending on whether the debris fall from outside or inside the moon’s orbit, respectively (Horedt and Neukum, 1984a; Alvarellos et al., 2005). However, planetocentric bodies on crossing orbits are generally short-lived (Burns and Gladman, 1998; Alvarellos et al., 2005), so they must be resupplied if they are to contribute to latter-day cratering. Ironically, the most plausible source of resupply is impact by heliocentric comets, which might produce copious fragments that rain back onto the moons. This realization motivates our study of the role of ejecta from cometary impacts in producing the observed crater populations.
The outline of our paper is as follows. In Section 2, we apply the cratering ejecta model of Housen and Holsapple (2011) to derive the expected mass available to form sesquinary and secondary craters on Saturn’s mid-sized moons and Jupiter’s three icy Galilean satellites. In Section 3, we describe the image processing we performed on the publicly available Cassini images we used to measure crater populations. In Section 4, we present the size-frequency distributions of craters on terrains on Enceladus, Mimas, and Rhea. In Section 5, we compare the observed and predicted populations of sesquinary craters on the Saturnian moons. Section 6 summarizes our conclusions.
2 Estimating the Role of Ejecta as Impactors
The crater formation and evolution process has been long approximated by a set of scaling laws, anchored to physical reality by laboratory-scale experiments, nuclear explosions, observations of impact craters across the Solar System, and increasing sophistication of numerical modeling. Although the details of any one impact are not captured by the scaling laws, they provide a reasonable description of trends.
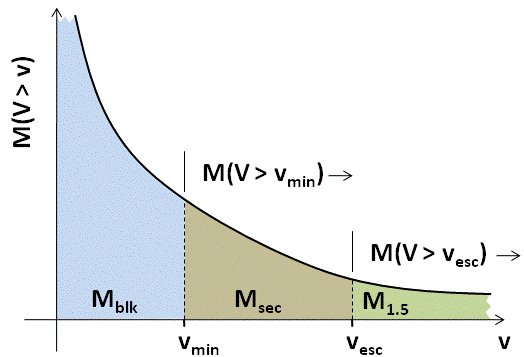
For the current research, we focus on the mass-velocity relationship of crater ejecta. In particular, observations of laboratory-scale cratering experiments (cintala1999) reveal that there is an inverse relationship between ejecta mass and ejection velocity, which is to say that less mass is ejected at higher velocities, see Figure 2. Early stage ejecta from near the point of impact move the fastest, but are the smallest portion of ejected mass. Late-stage ejecta are moving the slowest, but are the bulk of ejecta mass. Drilling at terrestrial craters and observations of craters on other surfaces indicate that the end of the crater excavation phase is a transition to material that isn’t so much ejected as it is an overturned flap of the surface.
Using the most recent summary of laboratory measurements of cratering ejecta from Housen and Holsapple (2011), and impact velocities for ecliptic comets on the satellites from Zahnle et al. (2003), we estimate the total and fractional ejecta masses for a 1 km diameter cometary (density of 600 kg/) impactor on various Saturnian satellites. We use a 1 km comet because it is sufficiently large to generate ejecta masses that contribute to the observable secondary and sesquinary crater populations, but small enough that such impacts should occur on geologically short timescales. Table 1 lists properties of the satellites used in our calculations. To complete the calculations, we must quantitatively determine the appropriate velocity regimes that separate the ejecta blanket, secondaries, and sesquinaries. We discuss these velocities next.
2.1 Making an Impact:
We define as the boundary between the ejecta blanket and secondaries, i.e., it is the minimum velocity at which an ejectum can make a secondary crater.
We use observations of adjacent secondaries on Europa, and the simple planar ballistics equation, to set plausible values of for icy surfaces. The ballistics equation is:
| (1) |
where is range, is ejection velocity, is the ejection angle (measured relative to local horizontal), and is the surface gravity. Measuring enables us to calculate :
| (2) |
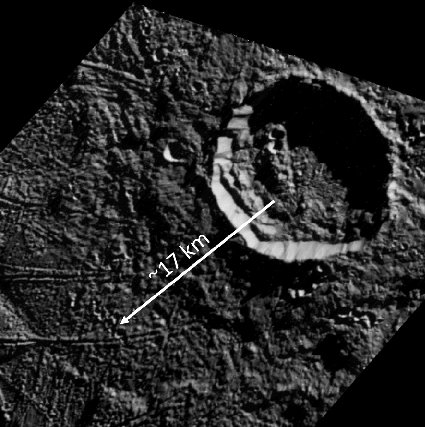
First, we examine Rhiannon, a 15 km diameter crater on Europa; see Figure 3. Rhiannon is the smallest primary on Europa imaged with sufficient resolution to see its adjacent secondary crater field. (Galileo imaged smaller primaries on Europa, but not with sufficient resolution to determine whether or not they have secondaries.) The point from which the fragments that make these secondaries originate is somewhat uncertain. The late ejecta come from the region close to the crater rim. The final crater diameter is larger than the transient diameter due to collapse of the crater after the excavation phase is complete. We use a point roughly halfway between the crater center and the final crater rim as a reasonable location for the origin of the secondary fragments. The distance between our presumed origin point and the first appearance of the adjacent secondary crater population is about 17 km. Substituting km, , and m/ for Europa into Equation 2 gives m/s.
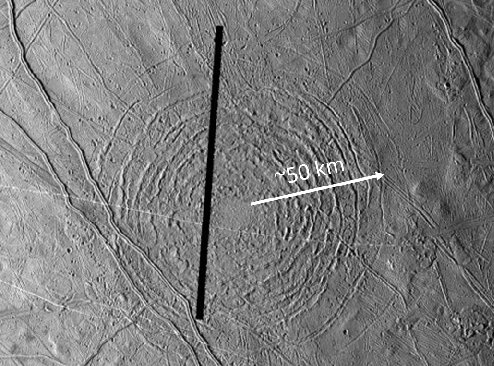
Next, we examine Tyre, the largest known primary impact structure on Europa; see Figure 4. Depending on the location of the crater rim, Tyre is km diameter. Following the procedure for measuring range we defined for Rhiannon, we find that secondaries begin to appear about 50 km from the estimated point of origin. Using 50 km in Equation 2 gives m/s.
Thus, in our subsequent analysis, we examine two different cases for the minimum velocity required to make secondaries, m/s and m/s. Although the actual value could differ for the Saturnian satellites, the general trends described here would not change.
2.2 The Great Escape:
Alvarellos et al. (2002, 2005) clarified that the relevant velocity to escape a moon in orbit around a planet isn’t the classical escape velocity appropriate for an isolated body, but rather the velocity required to reach the moon’s Hill Radius, which is:
| (3) |
where is the moon’s semi-major axis, is the mass of the moon, and is the mass of the planet. The velocity necessary to reach is then:
| (4) |
where is the moon’s radius, is the classical escape velocity, and is the moon’s mass. When estimating the amount of mass that escapes a moon, we use rather than . In general, .
2.3 Scaling Law Calculations
Our calculations are based on the expressions and definitions within Housen and Holsapple (2011). First is the expression for the cumulative mass ejected faster than a given velocity for a crater in the gravity regime, defined in terms of impactor properties:
| (5) |
where , , and are constants, and is the mass ejected faster than velocity , is the impactor velocity, is the density of the target’s crust, and is the impactor density. Housen and Holsapple (2011) indicate that is about 0.4 regardless of target type. The value of the exponent is expected to lie between (“momentum scaling”) and (“energy scaling”). For the materials tabulated by Housen and Holsapple (2011), ranges between 0.35 for perlite/sand mixture to 0.55 for water and rock. The values of and for ice are not given, but K. Housen (personal communication, 2011) recommends using the values for weakly cemented basalt as the closest approximation for ice (, ). We set kg/, appropriate for nonporous ice.
For a 1 km diameter comet with a density of 600 kg/, the impactor’s mass is kg. We use Zahnle et al. (2003) as the source for typical values of for ecliptic comets striking the different satellites. Substituting numerical values into Equation 5, we obtain the following for ejecta masses on icy satellites:
| (6) |
We will henceforth write as . First we calculate the ejected mass that escapes the moon, . In our discussion, we assume that this mass is equivalent to the amount of mass available to make sesquinary craters, .
| (7) |
Alvarellos et al. (2005) demonstrated that, for the mid-sized Saturnian satellites, most but not all of the sesquinary fragments re-impact their source moon. Their results were bracketed by 81.5% re-impact (ejecta from Odysseus crater on Tethys) on the low end, and by 99.6% re-impact (ejecta from Herschel crater on Mimas) on the high end.
Next we calculate the mass available to make secondary craters, , which is:
| (8) |
where is the mass ejected faster than the minimum speed necessary to make secondary craters, . This value is likely variable, dependent on target properties, but observations of Europan secondaries provide some constraints on the minimum possible value. See our discussion in Section 2.1, where we identify two plausible values for of 150 m/s and 250 m/s.
| (9) |
Later we find it useful to compare these masses with the total ejecta mass for a crater, . As Housen and Holsapple (2011) discuss, the volume of the final transient crater – at the end of the crater excavation phase but before modification due to wall collapse, etc. – has a corresponding mass:
| (10) |
where is a constant, and is the radius of the transient crater at the end of the excavation stage. This value does not correspond to an actual physical mass, since some significant fraction of any crater is formed by compaction and/or inelastic compression rather than excavation. K. Housen (personal communication, 2011) recommends that is about 0.5 for craters on icy satellites. Thus, we use the following expression for the total mass ejected:
| (11) |
where we assume .
To calculate , we used the expression from Housen and Holsapple (2011) for the diameter of the transient crater in the gravity regime, given a certain impactor:
| (12) |
where is a constant. K. Housen (personal communication, 2011) recommends using Housen and Holsapple (2011)’s value for sand of because of the similarity in porosity, although there may be differences due to friction angle. Substituting , , we have
| (13) |
as compared with
| (14) |
the expression used by Zahnle et al. (2003); Alvarellos et al. (2008); Zahnle et al. (2008), where is the angle of incidence (0 for a vertical impact). These authors assume , appropriate for impacts into wet sand, rock, and water (Schmidt and Housen, 1987; Housen and Holsapple, 2011). We incorporate impact angle into our calculations (Equations 6 and 13) by assuming an average primary impact angle of , and scaling the impact velocities in Zahnle et al. (2003) by .
With , it is a simple exercise to calculate the mass available to make an ejecta blanket ():
| (15) |
Figure 2 is a schematic illustration of these relationships. Any mass moving faster than is available to make sesquinary craters. Mass ejected faster than but slower than makes secondary craters (). Mass ejected slower than is available to make the ejecta blanket (). The smaller the difference between and , the less mass is available to make secondary craters. (For very small moons, we have , in which case no mass is available to make secondaries.) Conversely, the greater the difference between the two values, the more mass is available to make secondary craters.
The effective escape velocity is a function of the mass and radius (or bulk density and radius) of the target object, as well as the moon’s distance from its planet (see Eqs. 3 and 4). The minimum velocity of ejecta that can make secondaries, , is a function of the surface strength. Presumably is greater for rocky objects than for icy objects, although the difference may not be significant. For the mid-sized icy satellites of Saturn, is smaller than it is for the terrestrial planets (or the Galilean satellites).
For purposes of comparison, we calculate , , , and for a 1 km diameter comet impact on several mid-sized icy Saturnian satellites and the three icy Galilean satellites. We use the impact velocities from Zahnle et al. (2003), and an impactor density of 600 kg/.
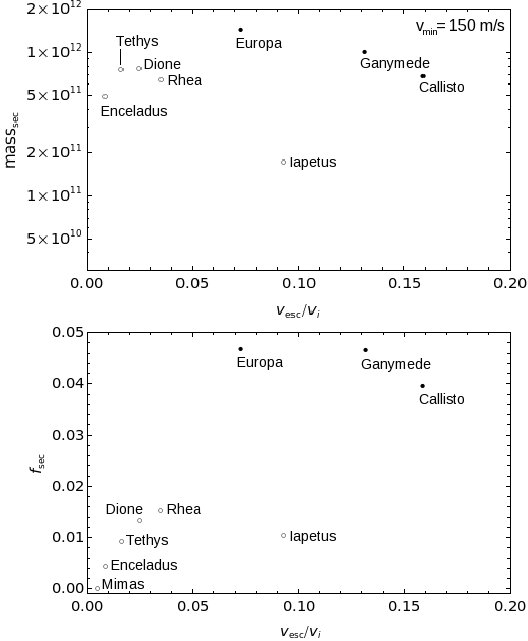
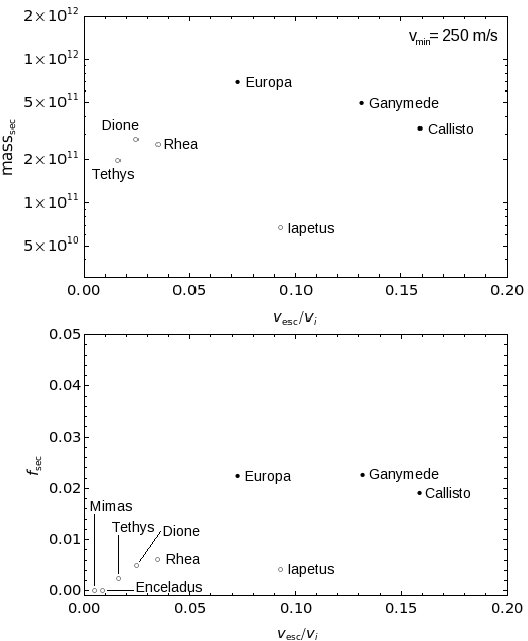
In all cases, the vast majority of the ejected mass resides in the “ejecta blanket”. Table 2 lists the absolute mass and fractional mass for each moon when m/s, the case which minimizes the amount of mass available for . Even in this case, between 95% and about 99% of the mass is in . However, enough ejecta are launched at sufficient speeds that such an impact should add to the observable secondary and sesquinary crater populations. To illustrate this point further, Table 3 lists and in terms of the impactor mass. Depending on the value of for each moon, the primary impact can eject multiple impactor masses to create secondaries and/or sesquinaries.
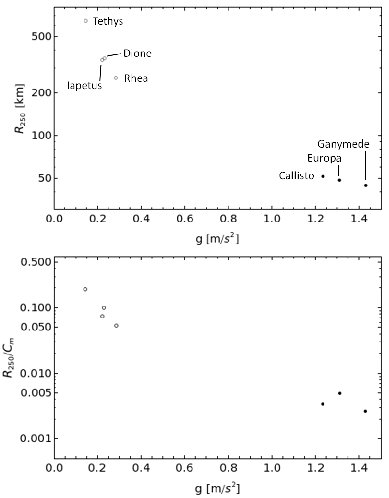
Figures 5 and 6 plot the fractional and absolute mass available to make secondary craters on each of the satellites. Mimas has no mass available to make secondary craters in either case, because for that moon, while the same is true for Enceladus in the m/s case. In both cases, Europa has the highest mass available for secondary craters. Tethys, Dione, and Rhea are the most similar to one another among the satellites addressed in this study.
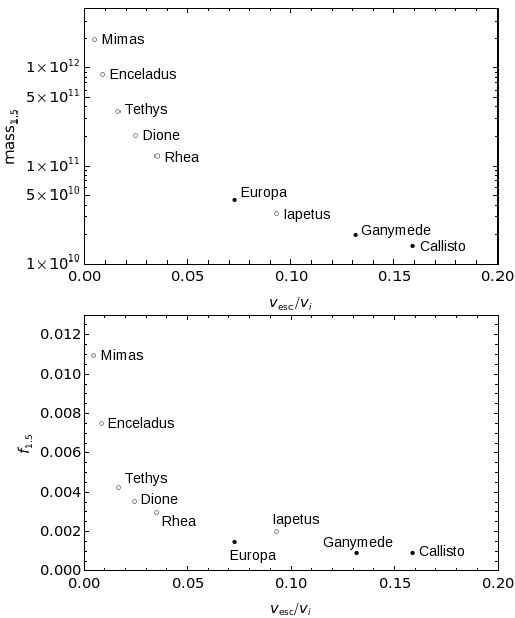
Figure 7 plots the fractional and absolute mass available to make sesquinary craters on each of the satellites. is independent of , and so is the same between the two values of used here. Mimas and Enceladus have orders of magnitude more mass available in this ejecta category than the Galilean satellites, and have significantly greater amounts of sesquinary ejecta than the other mid-sized Saturnian satellites.
2.4 Secondaries: Near and Far
Frequently secondaries are grouped into two basic populations: adjacent and distant (McEwen and Bierhaus, 2006). Adjacent secondaries are those that appear immediately outside the continuous ejecta blanket of a primary crater, and are a distinct high-spatial density annulus of small craters around the primary. The “distant” secondary is a broad classification, covering those secondaries that appear several crater radii away, to those that are hundreds (or even thousands) of km away (McEwen et al., 2005; McEwen and Bierhaus, 2006; Preblich et al., 2007; Dundas and McEwen, 2007; Robbins and Hynek, 2011). Of course, an ejecta fragment with a given velocity will result in different ballistic ranges on objects with different surface gravities and sizes. Formally, the ballistic range of an ejecta fragment, launched from a point on a sphere and traveling less than the escape speed of the object, is:
| (16) |
where is the radius of the moon, and is the half-angle distance of travel, defined by:
| (17) |
(Vickery, 1986), where is the fragment ejection velocity, is the ejection angle, and is the surface gravity of the moon.
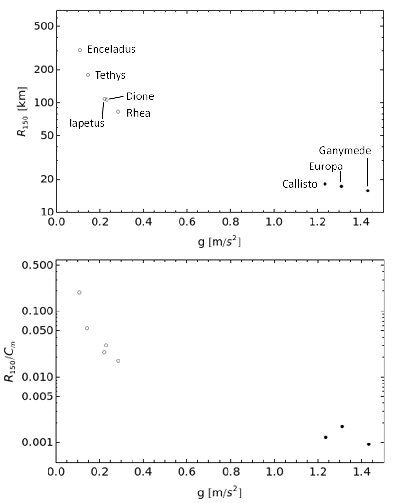
An illustrative comparison is to normalize the range by the circumference of the body, i.e. , where is the circumference of a moon. In Figure 8, we plot and for m/s, i.e., the lower limit to , and in Figure 9 we plot the same information for m/s, the maximum value of we use for the current analysis.
For m/s, a secondary crater on Enceladus will form no closer than over 300 km distant, and even for the more massive Rhea, the closest secondary forms over 80 km away. (In this model, no traditional secondaries form on Mimas for m/s.) This minimum range is a few percent of Rhea’s circumference and almost 20% of Enceladus’s circumference.
For m/s, the closest secondaries move further away from their parent primary. (For m/s, the available mass to make secondaries is zero for both Mimas and Enceladus.) The closest secondaries on Rhea are over 200 km distant, while those on Dione and Iapetus are over 300 km distant, and those on Tethys are over 600 km distant – 20% the circumference of the moon.
On objects with small surface gravities, then, there may not be “adjacent” secondary populations in the traditional sense. Certainly we don’t expect to see dense, overlapping fields of secondary craters around a large primary. This is true for the Saturnian satellites under discussion here, as well as asteroids, Kuiper Belt Objects, and other bodies where is close to, but still less than, (or ).
2.5 Discussion
Based on examination of the tables and figures, we divide the satellites into different groups based on the relative values of and . (Table 3 divides the satellites into groups with horizontal lines to illustrate the discussion.) In particular:
Mimas and Enceladus: These moons have the weakest surface gravities and the smallest escape velocities of those under consideration, as well as the highest cometary impact velocities. This combination means that an impactor will create the largest crater on these satellites, and further, will generate more mass for sesquinary craters than for secondaries.
Tethys, Dione, and Rhea: Larger than Mimas and Enceladus, these moons have higher surface gravities and escape velocities. In addition, impact speeds are lower. On these objects, there’s generally more mass to create secondary craters than sesquinary craters.
Iapetus: Despite its similarity in size to Dione and Rhea, Iapetus does not have much ejecta available for either secondaries or sesquinaries, due to the low primary impact velocity of around 6 km/s. The low impact velocity has two effects: the resulting primary crater and its ejecta mass are smaller, and a slower-moving primary impact generates slower moving ejecta.
The Galilean Satellites: These objects are clearly distinct from the Saturnian satellites, in that they have higher fractions of mass available for secondary craters, and lower fractions of mass available for sesquinary craters. Their higher escape velocities mean they retain more ejecta as secondary craters. For Europa, the combination of high impact velocity (which generates a large primary with lots of fast moving ejecta) and higher surface gravity means there is a significant amount of mass available to make secondary craters. This explains why clusters of secondary craters are everywhere on Europa (Bierhaus et al., 2005) – even though that moon has a relatively low density of primary craters – and yet clusters are rare to absent on the much more heavily cratered Saturnian satellites.
3 Cassini Image Data
We now turn to our analysis of Cassini images of three of Saturn’s mid-sized satellites and our techniques for measuring craters on the moons.
3.1 Description of Image Processing
We obtained the image data from the NASA Planetary Data System (PDS) website (http://img.pds.nasa.gov/), and performed all image processing using the USGS planetary image software package ISIS version 3, which provides several routines to manage Cassini ISS data. We used a combination of the Cassini-ISS-specific routines and additional ISIS routines to generate image mosaics that were the basis for our measurements. The processing can be considered to consist of two phases: the first phase is “image preparation”, which is a sequence of steps that generates a properly calibrated image; the second phase is “mosaic preparation”, which collates information from each calibrated image to generate the mosaic. [For more information on each routine, see the ISIS website (http://isis.astrogeology.usgs.gov/Application/)].
The following is a brief summary of the processing steps for the image preparation phase.
-
1.
ciss2isis: imports a Cassini ISS image into ISIS by collating the separate data file (.IMG) and label file (.LBL) from PDS into a single ISIS-format cube file (.cub). This is a Cassini-specific routine.
-
2.
cisscal: performs radiometric corrections to the images. This is a Cassini-specific routine (West et al., 2010).
-
3.
spiceinit: attaches geometry information for the spacecraft, instrument, and target body to determine the geometric properties (e.g., resolution, latitude, longitude) of each pixel in the image.
-
4.
trim: removes a user-specified number of pixels from a user-specified edge of the image. Because ISS images often have a one or two pixel border of invalid data around an image, we removed a two-pixel wide border from each edge of an image.
-
5.
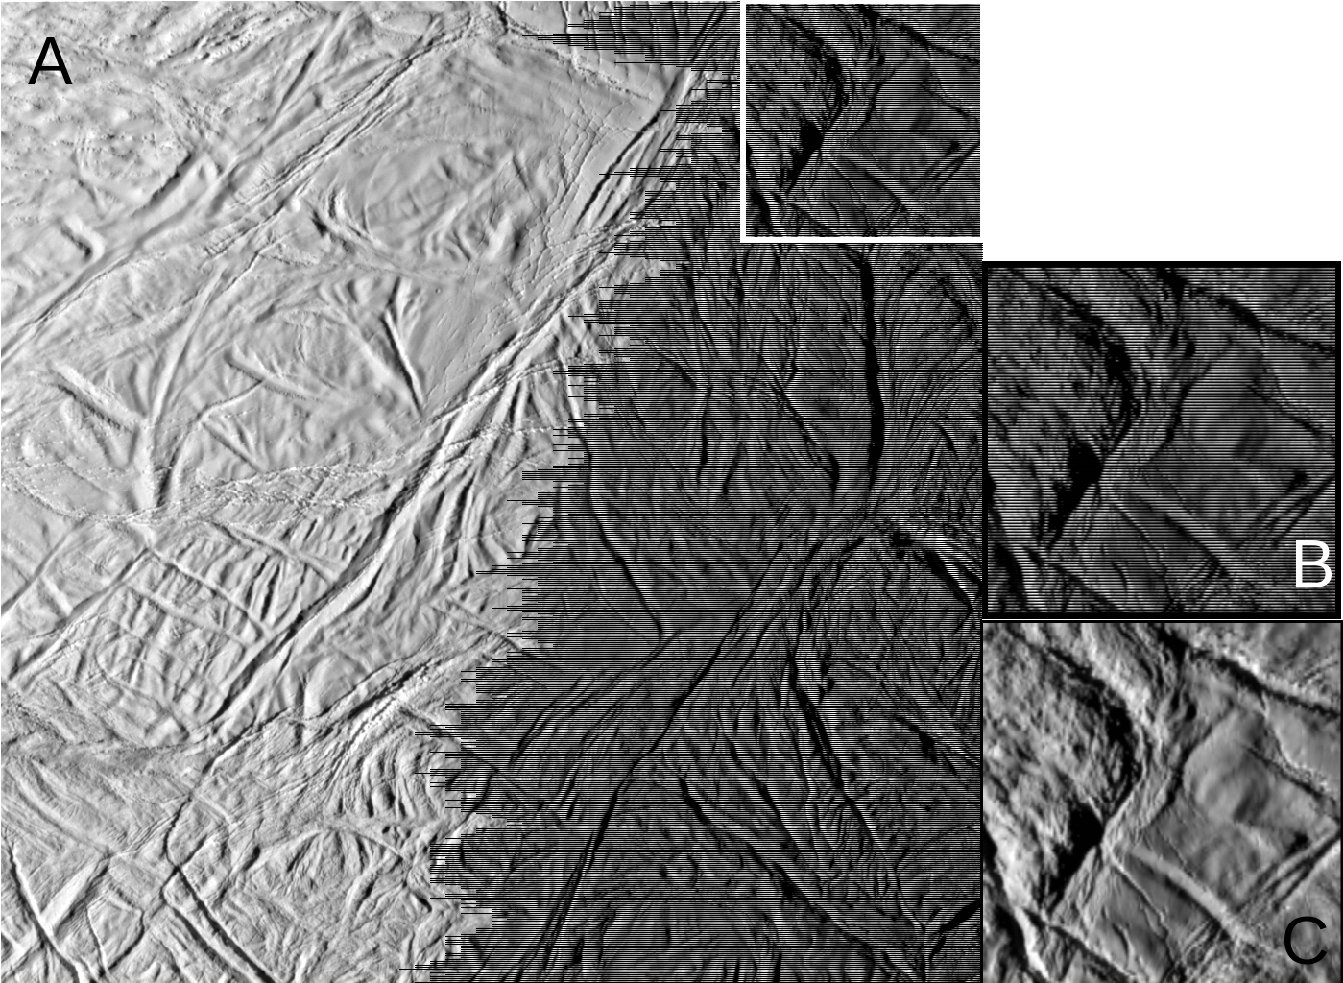
lowpass: applies a moving filter to the image. ISS image data are often returned using a compression scheme that assigns a fixed data volume per two-line pair. The data volume is more than sufficient for a single line, but not enough for the entire second line. The completeness of the second line depends on the scene content (and thus the ability of the algorithm to compress the data), but is never total. This results in horizontal variably sized “jail bars”, i.e., black bars with no image data, every other line in the image. To eliminate these data gaps, we used a (line by sample) moving filter to generate image data. In other words, each data-gap pixel became an image pixel, with an intensity value that is the average of the pixels above and below it. See Figure 10.
-
6.
camstats: outputs a text file containing summary information on the latitude, longitude, resolution, phase angle, and several other image properties. While camstats does no image processing, it is very useful to have a text-searchable summary for each image.
Once the previous steps have been applied to a set of images that comprise a mosaic, one must collect information on each image to determine the properties of the mosaic. The following is a summary of the routines and other steps used for the mosaic preparation phase.
-
1.
mosrange: computes and outputs the latitude and longitude extent, and pixel resolution, of a set of images. The results are output to a “.map” file. The .map file contains the required latitude and longitude extent of the mosaic, the mosaic projection type, and other details necessary to reproject and combine the individual images into the mosaic.
-
2.
qnet: creates and edits a control network. This step requires a significant amount of user interaction. Briefly, the user loads the set of images for the mosaic into qnet, which is a graphical user interface that allows the user to identify “tie points” between images. A tie point is a common feature between two (or more) images. Although the geometry information loaded into each image during the spiceinit step (mentioned above) contains roughly correct geometry information to align neighboring images, there are still residual errors at the pixel-level scale. The qnet routine enables one to identify the residual misalignment between the SPICE files (accessed using spiceinit) and the actual image alignment. An output of the user’s interaction with qnet is a network file (a “.net” file), which contains the corrections to the image alignments.
-
3.
jigsaw: more precisely aligns the images to sub-pixel levels. The inputs to jigsaw include the set of images to be mosaiced, and the network file created using qnet.
-
4.
cam2map: using the data from the “.map” file, this routine converts each image from the 2D plane of the image detector to a map-projected image. ISIS provides several map projection options; we typically used sinusoidal (Mercator equal-area) projections to generate mosaics for crater measurement.
-
5.
automos: creates a mosaic from a set of map-projected images. The output of automos is the product we used for crater measurement.
Some image mosaics consist of images acquired from rapidly varying viewing geometry (i.e., during a close flyby), or during an extended viewing sequence. For these mosaics, the native image resolution and/or phase angle (important for identifying craters, or distinguishing them from other features) can vary by many tens of percent, or even more than a factor of two, between the first and last images of the mosaic sequence. In these cases, we do not use all images that belong to the complete sequence; instead, we use those images whose resolutions differ by no more than 50%. We make this choice because the ISIS routine automos creates an image mosaic with a single resolution (specified by the .map file generated by the mosrange routine); it does not preserve the native resolution of the individual images. Minimizing the resolution difference between images used to generate a mosaic ensures a relatively common completeness limit across the mosaic.
4 Measured Crater Size-Frequency Distributions
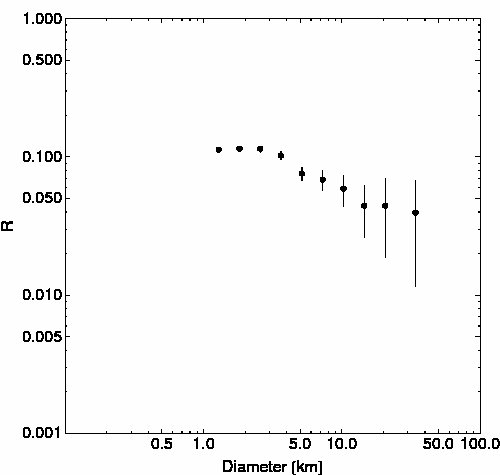
We display the crater size-frequency distributions (SFDs) as “R-plots” [relative plots]. (Crater Analysis Techniques Working Group et al., 1979) Recall that SFDs can often be approximated as power laws, or a series of power laws, such that , where is the number of craters per unit area with diameters between and , and and are positive constants. For example, primary craters on the terrestrial planets follow distributions with . To enhance structure, the R-plot divides by a power law with , i.e.:
| (18) |
At diameters less than a few km, terrestrial planet SFDs are roughly horizontal lines in R-plots, which is to say, . For subsequent discussion, we use the following terminology: if increases with increasing diameter, the SFD is shallow, i.e., dominated by large craters. For example, if , .
4.1 Enceladus
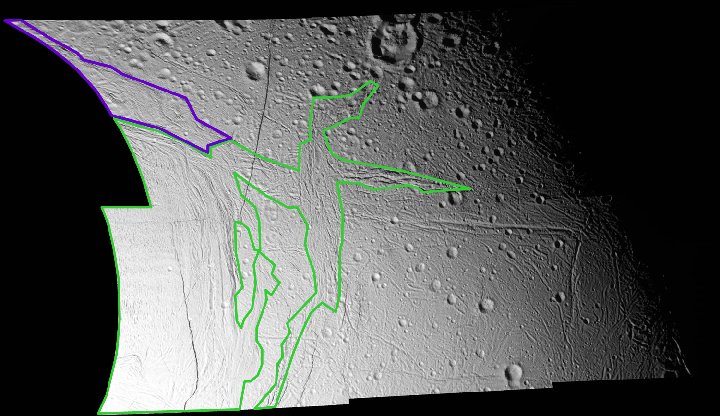
We focused our initial measurements on the young terrain of Enceladus, because those regions should be the best representation of the true primary crater population, and the least affected by secondary and/or sesquinary craters. We also measured some regions of heavily cratered terrain to compare the crater populations between young and old(er) regions of Enceladus. Table 4 summarizes the regions we’ve measured, and discussion of the measurements follows.
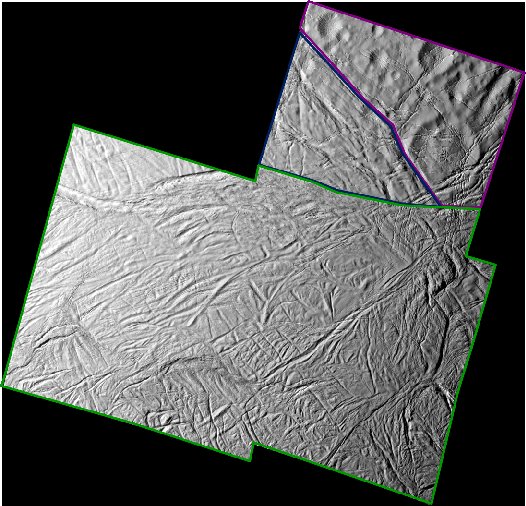
Young Terrain: We measured the crater populations within several
regions of the young terrains of Enceladus, including portions of
the
ISS_003EN_LIMTOP004_PRIME, ISS_004EN_REGEO002_PRIME,
ISS_011EN_MORPH002_PRIME, and ISS_011EN_N9COL001_PRIME mosaics
(see Table 4).
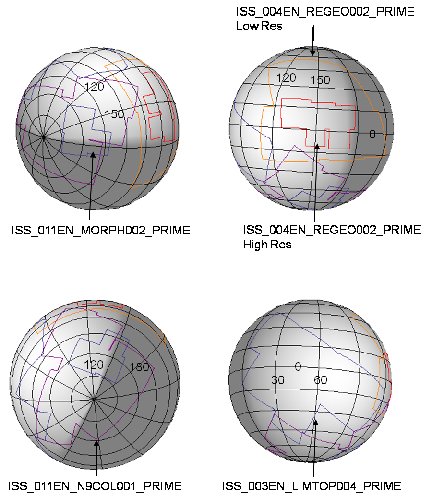
These mosaics span significant
areas at and near the south pole, and a variety of longitudes
(see Figure 11).
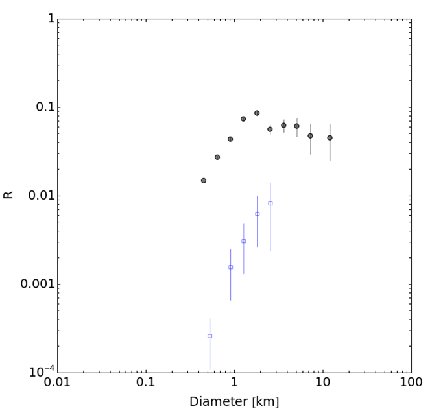
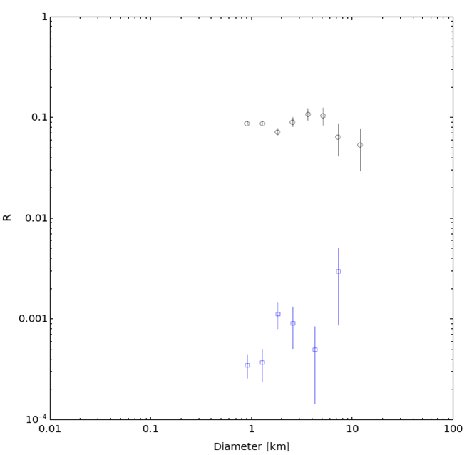
The SFDs on young terrains on Enceladus show a few notable features (see Figures 13, 15, 17, 19, and 21). First, they all display a differential slope of roughly -2 (), regardless of location. Second, the crater density roughly correlates with latitude: the southernmost regions have the lowest crater densities, while the lower latitudes have higher crater densities. Third is the “noise” in the crater SFDs; although the average trend for each region is a -2 differential slope, there are density excursions (“bumps and wiggles”) that depart from the linear trend. We have not yet ascertained what causes these departures, but an initial explanation is that these density variations are evidence for a dispersed and generally unclustered secondary crater population.
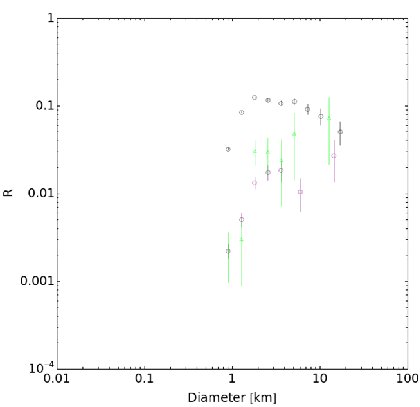
Old(er) Terrain: There are two key features of the crater SFD measured on the older, more heavily cratered terrain. First, at diameters larger than a few km, the SFD has a -3 differential slope. Second, at diameters less than a few km, there is a clear transition in the SFD to a roughly -2 differential slope that parallels the SFD seen on the young terrains of Enceladus.
The absence of a steeply-sloped SFD (i.e., ) at small crater diameters, even within heavily cratered regions, supports our prediction that secondaries should have minimal influence on the small crater populations of Enceladus. The presence of a steeper SFD at larger diameters is an intriguing evolution of what we preliminarily predict to be a -2 differential production population. We raise two points to address this evolution.
First, if any secondaries form on Enceladus, we expect they will be only the slowest moving, and therefore the largest. (Just as there exists a clear inverse mass-velocity relationship for the crater ejection process as a whole, there is also a more granular inverse mass-velocity relationship for the fragments themselves: higher-velocity fragments are smaller, while slower-velocity fragments are larger. This is why secondary craters trend to smaller diameters with increasing distance from their primary crater, even though the fragment ejection/impact velocity is growing. (See McEwen and Bierhaus (2006) for more discussion on this in regards to secondaries, or Bart and Melosh (2010) in regards to ejected boulders.) In addition, these slow moving fragments will not re-impact near their parent primary, as discussed in Section 2.4. Rather, they will travel some significant distance away, and may be unrecognizable as secondaries due to lack of the distinct morphologies of tightly packed secondary craters. The end result is a population of craters that: (i) follow a steeper SFD but are not clearly secondaries surrounding a certain primary; and (ii) extend down to some minimum diameter but no smaller (i.e., any smaller fragments ejected at higher velocities will escape).
The second point is that crater measurements by Kirchoff and Schenk (2009), which cover a larger region of heavily cratered terrains, show a similar behavior, namely a decreasing crater spatial density below diameters of a few km, and variations in density at larger crater diameters. Some cratered regions are at saturation densities, while others are not. It is possible that a combination of saturation effects, and a production function that is more steeply sloped at larger diameters, leads to the observed crater distributions.
4.2 The Non-Detection of Craters at the South Pole
The images provide essentially complete longitudinal coverage of the south pole between latitudes of -75∘ S and -90∘ S. We did not identify a single crater in this region at the limiting image scale of m/pixel, or a completeness limit of just over 600 m (i.e., pixels). Based on the lack of observed craters in this region, we set an upper limit on crater density. The area of a spherical cap is , where is the moon’s radius and is the latitude; thus the area of the region southward of -75∘ S is .
If is the true crater density (number of craters per square km) and is the surface area, then the expected number of craters is . Because primary cratering is a Poisson random process, the probability that the observed number of events equals is:
| (19) |
where is the expected value. In our case, , and . Thus the probability becomes:
| (20) |
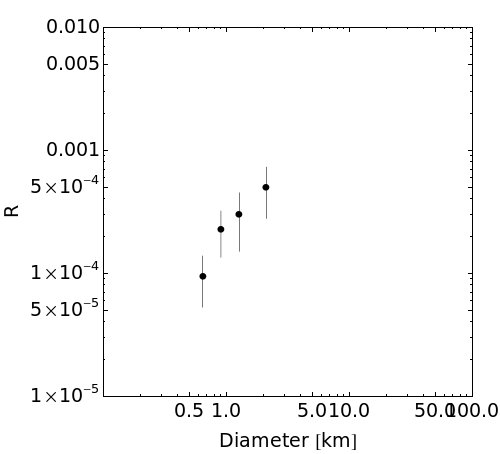
For a 99% confidence level, or , we derive an upper limit on the true crater density of craters/. For a diameter bin size from m to m, and bin “middle” of m, the corresponding upper limit on the R-value for the south pole of Enceladus is:
| (21) |
This value resides within the range of densities measured in the other young terrains.
4.3 The Primary Crater Size-Frequency Distribution
The primary crater SFD on the young surface of Europa (Bierhaus et al., 2009; Schenk et al., 2004) displays an approximately -2 differential slope at crater diameters between a few km and a few tens of km, as do younger terrains on Ganymede (bright terrain and floors/ejecta blankets of impact basins, Schenk et al. (2004)) and Callisto (floors/ejecta blankets of impact basins, Schenk et al. (2004)). The behavior of the primary crater SFD at smaller diameters is masked by the extensive secondary populations (Bierhaus et al., 2005). Thus Enceladus’s young terrains provide an important test of the primary crater SFD in the outer solar system at diameters smaller than a few km.
The crater SFDs on the young terrains of Enceladus have a varying but consistent trend of an approximately -2 differential slope. The density varies by up to an order of magnitude between regions; the lowest crater density is at and near the south pole, while the higher crater densities are at the mid- to northern latitudes. The consistency in the crater SFD, within young terrain and regardless of crater density, strongly suggests that this shape is in fact the production population.
The south polar plumes deposit material on the surface, and Kirchoff and Schenk (2009) find morphological evidence that some craters do have a “softened” appearance. However, deposition from the plumes cannot account for the shallow small crater SFD we see on Enceladus. Kempf et al. (2010) predict maximum deposition rates of about 1 mm/yr, but only for locations within 100 m of a plume. For more distant locations, beyond 10 km, the deposition rate drops off to less than mm/yr, and the majority of the area that sees plume deposits have deposition rates more like mm/yr. A 500 m diameter crater with a 100 m depth would take 1 Gyr to disappear by plume infill. Meanwhile 500 m diameter craters, using the estimates of Zahnle et al. (2003), are expected to form on Enceladus on timescales of 0.01–1 Myr, or at least three orders of magnitude faster. Thus we conclude that the small crater SFD on Enceladus young terrains (largely) reflects the production population.
The Enceladus young terrain crater SFD, combined with observations from the Galilean satellites, provide preliminary cross-planetary evidence for a differential-slope, primary-crater population at crater diameters less than a few tens of km in the outer Solar System. This argues for an impacting population (i.e., comets) that have a similar SFD for projectile diameters in the range from m to several km.
4.4 Mimas
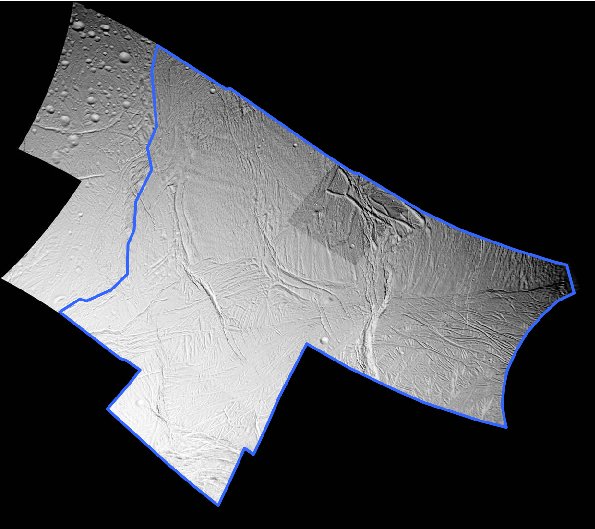
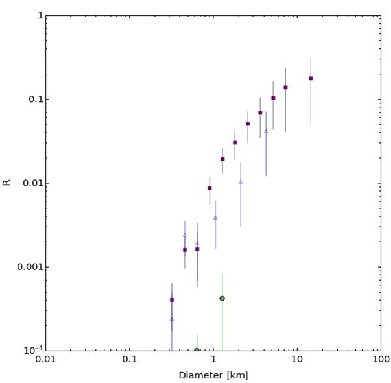
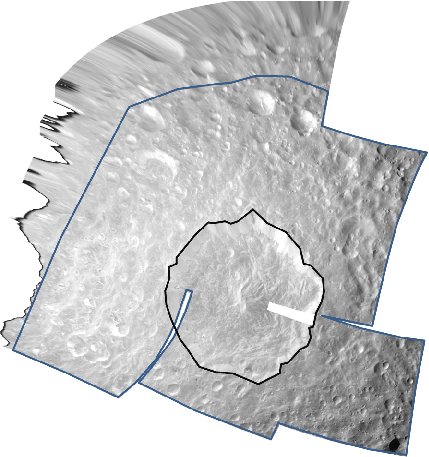
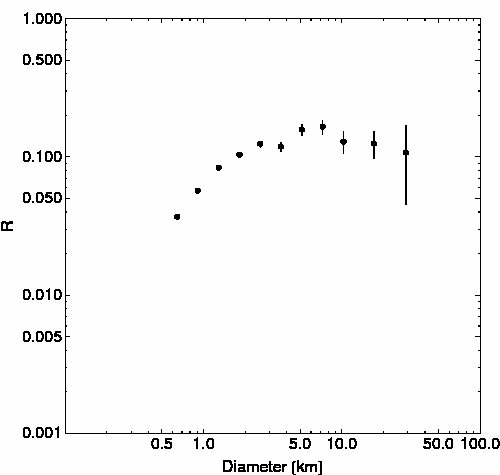
We measured an image mosaic that includes the large ( km) Herschel crater and surrounding region. Table 5 lists the images, and Figures 22 and 23 show the mosaic and R-plot, respectively. The measurements are for the region outside Herschel crater. Much like the measurements on the heavily cratered terrain of Enceladus, the crater SFD for diameters larger than 5 km has a roughly -3 differential slope (which is flat on an R-plot). At smaller diameters, the crater density decreases, and the SFD transitions to a roughly -2 differential slope.
Because the measurements are in the region immediately outside the Herschel crater, it is not unreasonable to expect that the large crater has affected the local small crater population. However, we note that Kirchoff and Schenk (2010) measured a large region of Mimas that includes areas not adjacent to Herschel, and find a very similar SFD (compare their Figure 2 with our Figure 23).
4.5 Rhea
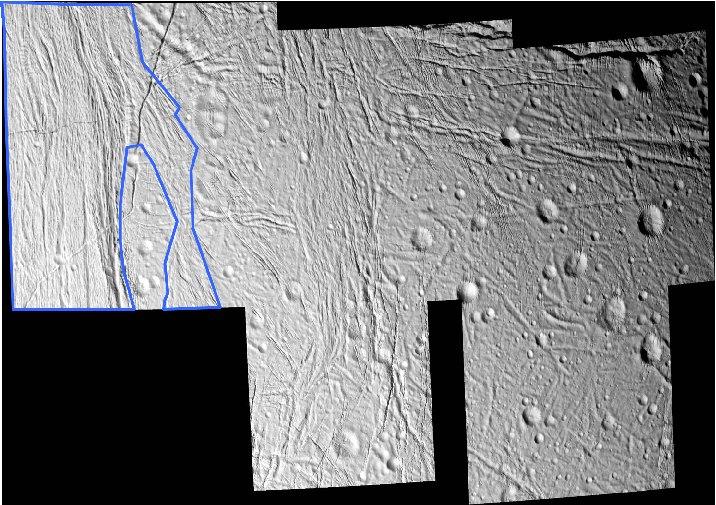
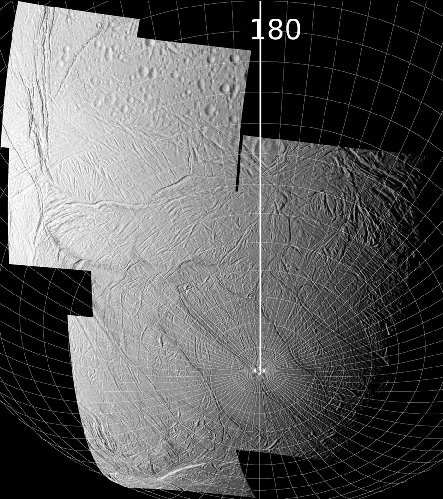
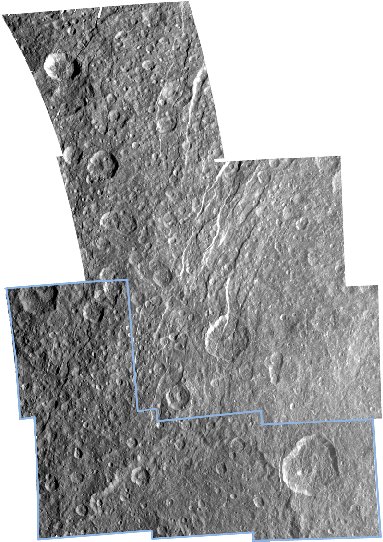
We measured the crater SFD in images located near the leading face of Rhea. Table 6 lists the images used to make the mosaic seen in Figure 24, and Figure 25 is the R-plot of our data. We measured almost 7500 craters in just the four images outlined in Figure 24.
Unlike Mimas and Enceladus, the crater density does not decrease at diameters smaller than a few km; indeed, Figure 25 shows an increase in crater density at smaller diameters. This observation matches the prediction of Section 2.3, namely that Rhea (along with Tethys and Dione) is sufficiently massive that it can retain a measurable secondary crater population. This is explicitly illustrated by an image sequence on Rhea that captures (one of the few examples imaged to date on Saturnian satellites) a secondary crater cluster near the 48-km ray crater Inktomi (Wagner et al., 2011).
5 Sesquinaries: Where Art Thou?
The correlation between predicted and observed secondary crater populations on the Saturnian moons is encouraging. What remains puzzling is the absence of a measurable signature of sesquinary craters on Enceladus, and especially on Mimas. The fragments that make secondary craters follow an inverse mass-velocity relationship (e.g., McEwen and Bierhaus (2006)), which partly explains their generally steep SFDs. Because sesquinary fragments from moons with low escape velocities are presumably the same fragments that make secondary craters on moons with higher escape velocities, one would logically expect that Mimas, with its multitude of large craters, would be covered in a steeply-sloped population of small craters made from sesquinary fragments. Yet the crater SFD clearly show a decrease in crater density at smaller sizes on an R-plot. Some of the small craters may, in fact, be sesquinaries, and at the moment we have no means to identify whether a small crater is primary or sesquinary. But the fact remains that the amount of escaped ejecta (see Table 3) per impact is factors of several greater than the impactor mass. Given that the sesquinary fragments mostly re-impact their source moon (Alvarellos et al., 2005), there should be a high-density small crater population made from sesquinary fragments. What happens to those fragments?
Zahnle et al. (2008) estimate that Ionian sesquinaries on Europa should dominate the small crater population on Europa, provided that Melosh’s spall model can be applied without modification to the 2.5 km/s ejection velocities required for spalls to escape Io. Yet observations (Bierhaus et al., 2005) clearly show that most small craters on Europa are Europan secondaries. Zahnle et al. (2008) wondered whether the Melosh (e.g., Melosh (1984)) spall model applied to the higher velocity fragments that are likely the source of the sesquinary population. The spall model predicts a plate-like geometry for the fragments, i.e. they are much larger in length and width than they are in height. As Zahnle et al. (2008) discussed, it may be unreasonable that such fragments survive in that state; more reasonably, they may break up into smaller pieces whose mean radius is approximated by the plate thickness, or by some smaller size scale intrinsic to the target material (for Io this might be the thickness of individual lava flows, presumably of order a meter).
Schultz and Gault (1985) conducted a number of experiments that explored the morphology of craters made by clusters of fragments rather than individual fragments. The craters made by fragments that were still relatively compact appeared similar to traditional impact craters, albeit shallower (as secondaries tend to be). More dispersed fragment clusters made craters whose morphology departed from a traditional impact crater.
An explanation for the missing sesquinary craters may lie in the mechanical construction of the ejecta fragments, and the greater (much greater, in many cases) time between launch and impact for sesquinary craters and secondary craters. Adjacent secondary craters are made by fragments with short flight times, less than a few minutes and sometimes less than a minute. Distant secondary craters are made by fragments with flight times of up to tens of minutes, depending on the moon. However, Alvarellos et al. (2005) show that sesquinary fragments in the Saturnian system typically have lifetimes of decades – some even survive for 10,000 years. This is between thousands to one million orbital periods of the moons, and thus the fragments have orders of magnitude more time to disperse than do fragments that make secondary craters. Close encounters with the parent moon may provide additional dispersive pulses to weakly bound fragments. The smallest discrete fragment, resistant to any further disruption or dispersion, finally impacts its source moon; perhaps its size is sufficiently diminutive that the resulting crater is below the imaging resolution of the current Cassini ISS data. For example, a 300-m crater on Enceladus, which we would probably see in the highest-resolution mosaics (Table 4), would be created by an 85-m diameter fragment striking at the moon’s escape velocity, assuming a impact angle (Eq. 13). For a km-sized crater on Enceladus, which we would see in any of the mosaics, the corresponding impactor diameter is 380 m. These impactor sizes are intermediate between the characteristic sizes for rubble and spalls calculated by Alvarellos et al. (2005) (see their Figures 2 and 4), so it seems plausible that modest fragmentation in orbit could render the sesquinaries unobservably small. See Alvarellos et al. (2008) and Zahnle et al. (2008) for further discussion of fragment sizes.
6 Summary
The following are the key observations and outcomes of this analysis:
-
1.
The mass available to make secondary craters depends upon the relative magnitudes of (the minimum velocity required to make a secondary crater) and the target moon’s modified escape velocity , in addition to impactor and target mechanical properties (e.g., material strengths and density contrasts). Objects for which should have no secondary crater population. For the current discussion, that regime includes Mimas and perhaps Enceladus (depending upon the appropriate value of for Enceladus – some variability in the small crater SFD seen on Enceladus’ young terrains provides preliminary evidence that secondaries may in fact form on Enceladus). More broadly, this applies to all small moons and most minor planets.
-
2.
A low surface gravity also means that primary craters will lack an adjacent secondary crater population, as even low-velocity ejecta will travel far from the parent primary, perhaps even significant fractions of the body’s circumference.
-
3.
Rhea, Tethys, and Dione are sufficiently massive that we expect them to retain measurable secondary crater populations. Our measurements of Rhea (as well as those of Kirchoff and Schenk (2010)) support this prediction. However, these moons will lack dense populations of adjacent secondaries due to the process described above in (2).
-
4.
Iapetus should not have significant secondary or sesquinary crater populations. This is a consequence of the low primary impact velocities due to Iapetus’ large distance from Saturn, which overall generate smaller primary craters with less ejecta, and also generate slower-moving ejecta.
-
5.
The Galilean satellites, and Europa in particular, are in the “sweet spot” for secondary crater production. High impact velocities generate large craters with lots of fast-moving ejecta, and the moons are massive enough to retain that ejecta to form secondaries. The same is true for the Moon, Mars, and Mercury.
-
6.
The crater SFD measured on young terrains of Enceladus generally follows a -2 differential slope. The similarity between this SFD on Enceladus, the primary crater SFD on the young jovian moon Europa, and recent observations of young rayed craters on other Saturnian satellites (Schenk and Murphy, 2011) provide growing evidence that this is, in fact, the production SFD at craters of these sizes, and that comets making these craters (comets less than a few hundred meters in diameter) follow a similar distribution. A slope of -2 for the nuclei of Jupiter-family comets (JFCs) was recently published by Weiler et al. (2011), but this result cannot be taken as a confirmation of our work because (1) there are very few determinations of nuclear sizes for sub-km comets; (2) few JFCs have been discovered by surveys with well-characterized observational biases; and (3) since JFCs have, by definition, been active at some point, they have undergone physical evolution, which will tend to flatten their size distribution. Triton appears to have a significantly steeper crater SFD (Stern and McKinnon, 2000; McKinnon and Singer, 2010), but its huge apex-antapex asymmetry seems inconsistent with heliocentric impactors (Schenk and Zahnle, 2007), thus making the link between crater sizes and the SFD of the impactors a thorny one.
-
7.
The fate of sesquinary ejecta remains elusive. There is little doubt that large impacts on small satellites send significant amounts of mass into orbit, mass that would otherwise make secondary craters on larger moons. However, unlike secondaries – which leave a distinct imprint on small crater SFDs by adding steep slopes – sesquinaries do not express themselves so ostentatiously. Heavily cratered regions on Enceladus, and especially Mimas, should have small crater populations near or at saturation density due to the effect of sesquinaries, and yet both moons display a distinct decrease in small crater density. One explanation may be that the fragments responsible for secondary craters are not yet sub-divided into their smallest discrete components. The significantly longer time spent as sesquinary fragments allows the ejecta fragments to further separate into their smallest discrete components, which form craters too small to be resolved by current image data. On the other hand, Cassini discovered three small moons - Pallene, Methone, and Anthe - with diameters of , 3, and 2 km, respectively, orbiting between Mimas and Enceladus. Alvarellos et al. (2005) speculated that these moons might be spalls launched in an event like the Herschel impact. Thus there is some reason to believe that large fragments can indeed be launched (or accrete in orbit around Saturn) and survive for long periods of time.
-
8.
The bulk of the crater SFDs across the Saturnian satellites may be explained by a single impacting population. The variation in impact velocity and surface gravities across the moons means that a single impacting population will generate different primary crater SFDs on each satellite. For a given sized impactor, the variation in primary crater size is followed by variation in ejecta mass and ejecta speeds available to make secondary and (probably) sesquinary craters. For example, on Iapetus a 1 km comet makes an approximately 8 km transient crater with kg available to make secondaries, while the same impactor makes a 17 km transient crater on Mimas, with no mass available to make secondaries. The mass available to make secondaries will travel different distances across the moons. The superposition of the varying primary crater, and resulting secondary (and sesquinary) crater distributions may explain the crater SFDs seen on the satellites.
-
9.
Finally, we propose an update to the Voyager-era interpretation of the Saturnian cratering record: Population I is likely dominated by heliocentric comets, and appears on all Saturnian satellites as the source of craters above several km diameter; Population II is a result of secondary (and perhaps sesquinary) craters, with significantly varying signatures between the satellites, due to differences in primary impact velocities, surface gravities, and escape speeds.
7 Acknowledgements
Michelle Kirchoff kindly provided detailed discussions of her measurements. We thank the Cassini Data Analysis Program for supporting this research.
References
- Alvarellos et al. (2002) J. L. Alvarellos, K. J. Zahnle, A. R. Dobrovolskis, and P. Hamill. Orbital Evolution of Impact Ejecta from Ganymede. Icarus, 160:108–123, November 2002. doi: 10.1006/icar.2002.6950.
- Alvarellos et al. (2005) J. L. Alvarellos, K. J. Zahnle, A. R. Dobrovolskis, and P. Hamill. Fates of satellite ejecta in the Saturn system. Icarus, 178:104–123, November 2005. doi: 10.1016/j.icarus.2005.04.017.
- Alvarellos et al. (2008) J. L. Alvarellos, K. J. Zahnle, A. R. Dobrovolskis, and P. Hamill. Transfer of mass from Io to Europa and beyond due to cometary impacts. Icarus, 194:636–646, April 2008. doi: 10.1016/j.icarus.2007.09.025.
- Bart and Melosh (2010) G. D. Bart and H. J. Melosh. Distributions of boulders ejected from lunar craters. Icarus, 209:337–357, October 2010. doi: 10.1016/j.icarus.2010.05.023.
- Barucci et al. (2008) M. A. Barucci, H. Boehnhardt, D. P. Cruikshank, A. Morbidelli, and R. Dotson. The Solar System Beyond Neptune. 2008.
- Bierhaus et al. (2005) E. B. Bierhaus, C. R. Chapman, and W. J. Merline. Secondary craters on Europa and implications for cratered surfaces. Nature, 437:1125–1127, October 2005. doi: 10.1038/nature04069.
- Bierhaus et al. (2009) E. B. Bierhaus, K. J. Zahnle, and C. R. Chapman. Europa, pages 161–180. University of Arizona Press, 2009.
- Bottke et al. (2010) W. F. Bottke, D. Nesvorný, D. Vokrouhlický, and A. Morbidelli. The Irregular Satellites: The Most Collisionally Evolved Populations in the Solar System. Astronomical Journal, 139:994–1014, March 2010. doi: 10.1088/0004-6256/139/3/994.
- Burns and Gladman (1998) J. A. Burns and B. J. Gladman. Dynamically depleted zones for Cassinis safe passage beyond Saturns rings. Planetary and Space Science, 46:1401–1407, October 1998. doi: 10.1016/S0032-0633(97)00147-5.
- Chapman and McKinnon (1986) C. R. Chapman and W. B. McKinnon. Cratering of planetary satellites, pages 492–580. IAU Colloq. 77: Some Background about Satellites, 1986.
- Crater Analysis Techniques Working Group et al. (1979) Crater Analysis Techniques Working Group, R. E. Arvidson, J. Boyce, C. Chapman, M. Cintala, M. Fulchignoni, H. Moore, G. Neukum, P. Schultz, L. Soderblom, R. Strom, A. Woronow, and R. Young. Standard techniques for presentation and analysis of crater size-frequency data. Icarus, 37:467–474, February 1979. doi: 10.1016/0019-1035(79)90009-5.
- Dobrovolskis and Lissauer (2004) A. R. Dobrovolskis and J. J. Lissauer. The fate of ejecta from Hyperion. Icarus, 169:462–473, June 2004. doi: 10.1016/j.icarus.2004.01.006.
- Dones et al. (2009) L. Dones, C. R. Chapman, W. B. McKinnon, H. J. Melosh, M. R. Kirchoff, G. Neukum, and K. J. Zahnle. Icy Satellites of Saturn: Impact Cratering and Age Determination, pages 613–635. 2009. doi: 10.1007/978-1-4020-9217-6_19.
- Dundas and McEwen (2007) C. M. Dundas and A. S. McEwen. Rays and secondary craters of Tycho. Icarus, 186:31–40, January 2007. doi: 10.1016/j.icarus.2006.08.011.
- Giese et al. (2008) B. Giese, T. Denk, G. Neukum, T. Roatsch, P. Helfenstein, P. C. Thomas, E. P. Turtle, A. McEwen, and C. C. Porco. The topography of Iapetus’ leading side. Icarus, 193:359–371, February 2008. doi: 10.1016/j.icarus.2007.06.005.
- Hartmann (1984) W. K. Hartmann. Does crater ’saturation equilibrium’ occur in the solar system? Icarus, 60:56–74, October 1984. doi: 10.1016/0019-1035(84)90138-6.
- Horedt and Neukum (1984a) G. P. Horedt and G. Neukum. Cratering rate over the surface of a synchronous satellite. Icarus, 60:710–717, December 1984a. doi: 10.1016/0019-1035(84)90175-1.
- Horedt and Neukum (1984b) G. P. Horedt and G. Neukum. Planetocentric versus heliocentric impacts in the Jovian and Saturnian satellite system. Journal of Geophysical Research, 89:10405–10410, November 1984b. doi: 10.1029/JB089iB12p10405.
- Housen and Holsapple (2011) K. R. Housen and K. A. Holsapple. Ejecta from impact craters. Icarus, 211:856–875, January 2011. doi: 10.1016/j.icarus.2010.09.017.
- Kempf et al. (2010) S. Kempf, U. Beckmann, and J. Schmidt. How the Enceladus dust plume feeds Saturn’s E ring. Icarus, 206:446–457, April 2010. doi: 10.1016/j.icarus.2009.09.016.
- Kirchoff and Schenk (2009) M. R. Kirchoff and P. Schenk. Crater modification and geologic activity in Enceladus’ heavily cratered plains: Evidence from the impact crater distribution. Icarus, 202:656–668, August 2009. doi: 10.1016/j.icarus.2009.03.034.
- Kirchoff and Schenk (2010) M. R. Kirchoff and P. Schenk. Impact cratering records of the mid-sized, icy saturnian satellites. Icarus, 206:485–497, April 2010. doi: 10.1016/j.icarus.2009.12.007.
- Levison and Duncan (1997) H. F. Levison and M. J. Duncan. From the Kuiper Belt to Jupiter-Family Comets: The Spatial Distribution of Ecliptic Comets. Icarus, 127:13–32, May 1997. doi: 10.1006/icar.1996.5637.
- Lorenz et al. (2007) R. D. Lorenz, C. A. Wood, J. I. Lunine, S. D. Wall, R. M. Lopes, K. L. Mitchell, F. Paganelli, Y. Z. Anderson, L. Wye, C. Tsai, H. Zebker, and E. R. Stofan. Titan’s young surface: Initial impact crater survey by Cassini RADAR and model comparison. Geophysical Research Letters, 34:L07204, April 2007. doi: 10.1029/2006GL028971.
- Marchi et al. (2009) S. Marchi, S. Mottola, G. Cremonese, M. Massironi, and E. Martellato. A New Chronology for the Moon and Mercury. Astronomical Journal, 137:4936–4948, June 2009. doi: 10.1088/0004-6256/137/6/4936.
- McEwen and Bierhaus (2006) A. S. McEwen and E. B. Bierhaus. The Importance of Secondary Cratering to Age Constraints on Planetary Surfaces. Annual Review of Earth and Planetary Sciences, 34:535–567, May 2006. doi: 10.1146/annurev.earth.34.031405.125018PDF: http://arjournals.annualreviews.org/doi/pdf/10.1146/annurev.earth.34.031405.125018.
- McEwen et al. (2005) A. S. McEwen, B. S. Preblich, E. P. Turtle, N. A. Artemieva, M. P. Golombek, M. Hurst, R. L. Kirk, D. M. Burr, and P. R. Christensen. The rayed crater Zunil and interpretations of small impact craters on Mars. Icarus, 176:351–381, August 2005. doi: 10.1016/j.icarus.2005.02.009.
- McKinnon and Singer (2010) W. B. McKinnon and K. N. Singer. Small Impact Craters on Triton: Evidence for a Turn-up in the Size-frequency Distribution of Small (sub-km) KBOs, and Arguments Against a Planetocentric Origin. In AAS/Division for Planetary Sciences Meeting Abstracts #42, volume 42 of Bulletin of the American Astronomical Society, pages 984–+, October 2010.
- Melosh (1984) H. J. Melosh. Impact ejection, spallation, and the origin of meteorites. Icarus, 59:234–260, August 1984. doi: 10.1016/0019-1035(84)90026-5.
- Moore et al. (2004) J. M. Moore, P. M. Schenk, L. S. Bruesch, E. Asphaug, and W. B. McKinnon. Large impact features on middle-sized icy satellites. Icarus, 171:421–443, October 2004. doi: 10.1016/j.icarus.2004.05.009.
- Neish and Lorenz (2011) C. D. Neish and R. D. Lorenz. Titan’s global crater population: A new assessment. Planetary and Space Science, 000:000–+, 000 2011. doi: doi:10.1016/j.pss.2011.02.016.
- Neukum (1985) G. Neukum. Cratering records of the satellites of Jupiter and Saturn. Advances in Space Research, 5:107–116, 1985. doi: 10.1016/0273-1177(85)90247-9.
- Plescia and Boyce (1985) J. B. Plescia and J. M. Boyce. Impact cratering history of the Saturnian satellites. Journal of Geophysical Research, 90:2029–2037, February 1985. doi: 10.1029/JB090iB02p02029.
- Porco et al. (2005) C. C. Porco, E. Baker, J. Barbara, K. Beurle, A. Brahic, J. A. Burns, S. Charnoz, N. Cooper, D. D. Dawson, A. D. Del Genio, T. Denk, L. Dones, U. Dyudina, M. W. Evans, B. Giese, K. Grazier, P. Helfenstein, A. P. Ingersoll, R. A. Jacobson, T. V. Johnson, A. McEwen, C. D. Murray, G. Neukum, W. M. Owen, J. Perry, T. Roatsch, J. Spitale, S. Squyres, P. C. Thomas, M. Tiscareno, E. Turtle, A. R. Vasavada, J. Veverka, R. Wagner, and R. West. Cassini Imaging Science: Initial Results on Phoebe and Iapetus. Science, 307:1237–1242, February 2005. doi: 10.1126/science.1107981.
- Porco et al. (2006) C. C. Porco, P. Helfenstein, P. C. Thomas, A. P. Ingersoll, J. Wisdom, R. West, G. Neukum, T. Denk, R. Wagner, T. Roatsch, S. Kieffer, E. Turtle, A. McEwen, T. V. Johnson, J. Rathbun, J. Veverka, D. Wilson, J. Perry, J. Spitale, A. Brahic, J. A. Burns, A. D. Del Genio, L. Dones, C. D. Murray, and S. Squyres. Cassini Observes the Active South Pole of Enceladus. Science, 311:1393–1401, March 2006. doi: 10.1126/science.1123013.
- Preblich et al. (2007) B. S. Preblich, A. S. McEwen, and D. M. Studer. Mapping rays and secondary craters from the Martian crater Zunil. Journal of Geophysical Research (Planets), 112:E05006, May 2007. doi: 10.1029/2006JE002817.
- Richardson (2009) J. E. Richardson. Cratering saturation and equilibrium: A new model looks at an old problem. Icarus, 204:697–715, December 2009. doi: 10.1016/j.icarus.2009.07.029.
- Robbins and Hynek (2011) S. J. Robbins and B. M. Hynek. Distant secondary craters from Lyot crater, Mars, and implications for surface ages of planetary bodies. Geophysical Research Letters, 38:L05201, March 2011. doi: 10.1029/2010GL046450.
- Schenk and Murphy (2011) P. M. Schenk and S. W. Murphy. The rayed craters of Saturn’s icy satellites (including Iapetus): Current impactor populations and origins. In Lunar and Planetary Institute Science Conference Abstracts, volume 42 of Lunar and Planetary Institute Science Conference Abstracts, pages LOL–LOL, March 2011.
- Schenk and Pappalardo (2004) P. M. Schenk and R. T. Pappalardo. Topographic variations in chaos on Europa: Implications for diapir ic formation. Geophysical Research Letters, 31:16703–+, August 2004. doi: 10.1029/2004GL019978.
- Schenk and Zahnle (2007) P. M. Schenk and K. Zahnle. On the negligible surface age of Triton. Icarus, 192:135–149, December 2007. doi: 10.1016/j.icarus.2007.07.004.
- Schenk et al. (2004) P. M. Schenk, C. R. Chapman, K. Zahnle, and J. M. Moore. Ages and interiors: the cratering record of the Galilean satellites, pages 427–456. 2004.
- Schmidt and Housen (1987) R. M. Schmidt and K. R. Housen. Some recent advances in the scaling of impact and explosion cratering. International Journal of Impact Engineering, 5:543–560, 1987.
- Schultz and Gault (1985) P. H. Schultz and D. E. Gault. Clustered impacts - Experiments and implications. Journal of Geophyscal Research, 90:3701–3732, April 1985.
- Shoemaker (1965) E. M. Shoemaker. Preliminary Analysis of the Fine Structure of the Lunar Surface in Mare Cognitum. In W. N. Hess, D. H. Menzel, & J. A. O’Keefe, editor, The Nature of the Lunar Surface, pages 23–+, 1965.
- Shoemaker and Wolfe (1981) E. M. Shoemaker and R. F. Wolfe. Evolution of the Saturnian Satellites: The Role of Impact. LPI Contributions, 428:1–+, 1981.
- Shoemaker and Wolfe (1982) E. M. Shoemaker and R. F. Wolfe. Cratering time scales for the Galilean satellites. In D. Morrison, editor, Satellites of Jupiter, pages 277–339, 1982.
- Smith et al. (1981) B. A. Smith, L. Soderblom, R. F. Beebe, J. M. Boyce, G. Briggs, A. Bunker, S. A. Collins, C. Hansen, T. V. Johnson, J. L. Mitchell, R. J. Terrile, M. H. Carr, A. F. Cook, J. N. Cuzzi, J. B. Pollack, G. E. Danielson, A. P. Ingersoll, M. E. Davies, G. E. Hunt, H. Masursky, E. M. Shoemaker, D. Morrison, T. Owen, C. Sagan, J. Veverka, R. Strom, and V. E. Suomi. Encounter with Saturn - Voyager 1 imaging science results. Science, 212:163–191, April 1981. doi: 10.1126/science.212.4491.163.
- Smith et al. (1982) B. A. Smith, L. Soderblom, R. M. Batson, P. M. Bridges, J. L. Inge, H. Masursky, E. Shoemaker, R. F. Beebe, J. Boyce, G. Briggs, A. Bunker, S. A. Collins, C. Hansen, T. V. Johnson, J. L. Mitchell, R. J. Terrile, A. F. Cook, J. N. Cuzzi, J. B. Pollack, G. E. Danielson, A. P. Ingersoll, M. E. Davies, G. E. Hunt, D. Morrison, T. Owen, C. Sagan, J. Veverka, R. Strom, and V. E. Suomi. A new look at the Saturn system - The Voyager 2 images. Science, 215:504–537, January 1982. doi: 10.1126/science.215.4532.504.
- Stern and McKinnon (2000) S. A. Stern and W. B. McKinnon. Triton’s Surface Age and Impactor Population Revisited in Light of Kuiper Belt Fluxes: Evidence for Small Kuiper Belt Objects and Recent Geological Activity. Astronomical Journal, 119:945–952, February 2000. doi: 10.1086/301207.
- Strom and Woronow (1982) R. G. Strom and A. Woronow. Solar System Cratering Populations. In Lunar and Planetary Institute Science Conference Abstracts, volume 13 of Lunar and Planetary Institute Science Conference Abstracts, pages 782–783, March 1982.
- Thomas et al. (2007) P. C. Thomas, J. W. Armstrong, S. W. Asmar, J. A. Burns, T. Denk, B. Giese, P. Helfenstein, L. Iess, T. V. Johnson, A. McEwen, L. Nicolaisen, C. Porco, N. Rappaport, J. Richardson, L. Somenzi, P. Tortora, E. P. Turtle, and J. Veverka. Hyperion’s sponge-like appearance. Nature, 448:50–56, July 2007. doi: 10.1038/nature05779.
- Vickery (1986) A. M. Vickery. Size-velocity distribution of large ejecta fragments. Icarus, 67:224–236, August 1986. doi: 10.1016/0019-1035(86)90105-3.
- Wagner et al. (2011) R. J. Wagner, G. Neukum, U. Wolf, N. Schmedemann, T. Denk, K. Stephan, T. Roatsch, and C. C. Porco. Bright ray craters on Rhea and Dione. In Lunar and Planetary Institute Science Conference Abstracts, volume 42 of Lunar and Planetary Institute Science Conference Abstracts, pages LOL–LOL, March 2011.
- Weiler et al. (2011) M. Weiler, H. Rauer, and C. Sterken. Cometary nuclear magnitudes from sky survey observations. Icarus, 212:351–366, March 2011. doi: 10.1016/j.icarus.2010.12.026.
- West et al. (2010) R. West, B. Knowles, E. Birath, S. Charnoz, D. di Nino, M. Hedman, P. Helfenstein, A. McEwen, J. Perry, C. Porco, J. Salmon, H. Throop, and D. Wilson. In-flight calibration of the Cassini imaging science sub-system cameras. Planetary and Space Science, 58:1475–1488, September 2010. doi: 10.1016/j.pss.2010.07.006.
- Wood et al. (2010) C. A. Wood, R. Lorenz, R. Kirk, R. Lopes, K. Mitchell, E. Stofan, and Cassini RADAR Team. Impact craters on Titan. Icarus, 206:334–344, March 2010. doi: 10.1016/j.icarus.2009.08.021.
- Zahnle et al. (1998) K. Zahnle, L. Dones, and H. F. Levison. Cratering Rates on the Galilean Satellites. Icarus, 136:202–222, December 1998. doi: 10.1006/icar.1998.6015.
- Zahnle et al. (2001) K. Zahnle, P. Schenk, S. Sobieszczyk, L. Dones, and H. F. Levison. Differential Cratering of Synchronously Rotating Satellites by Ecliptic Comets. Icarus, 153:111–129, September 2001. doi: 10.1006/icar.2001.6668.
- Zahnle et al. (2003) K. Zahnle, P. Schenk, H. Levison, and L. Dones. Cratering rates in the outer Solar System. Icarus, 163:263–289, June 2003. doi: 10.1016/S0019-1035(03)00048-4.
- Zahnle et al. (2008) K. Zahnle, J. L. Alvarellos, A. Dobrovolskis, and P. Hamill. Secondary and sesquinary craters on Europa. Icarus, 194:660–674, April 2008. doi: 10.1016/j.icarus.2007.10.024.
| Moon | [km/s] | [m/s] | [m/s] | [m/] |
|---|---|---|---|---|
| Mimas | 27 | 159 | 130 | 0.064 |
| Enceladus | 24 | 239 | 209 | 0.11 |
| Tethys | 21 | 393 | 345 | 0.145 |
| Dione | 19 | 510 | 467 | 0.231 |
| Rhea | 16 | 635 | 559 | 0.285 |
| Iapetus | 6.1 | 572 | 566 | 0.223 |
| Europa | 26 | 2000 | 1888 | 1.31 |
| Ganymede | 20 | 2741 | 2629 | 1.43 |
| Callisto | 15 | 2440 | 2382 | 1.235 |
| Moon | D [km] | |||||||
|---|---|---|---|---|---|---|---|---|
| Mimas | 17.3 | 0.989 | 0.000 | 0.000 | 0.011 | |||
| Enceladus | 14.9 | 0.988 | 0.004 | 0.007 | ||||
| Tethys | 13.5 | 0.987 | 0.009 | 0.004 | ||||
| Dione | 11.9 | 0.983 | 0.013 | 0.004 | ||||
| Rhea | 10.7 | 0.982 | 0.015 | 0.003 | ||||
| Iapetus | 7.8 | 0.988 | 0.010 | 0.002 | ||||
| Europa | 9.7 | 0.952 | 0.047 | 0.001 | ||||
| Ganymede | 8.6 | 0.953 | 0.047 | 0.001 | ||||
| Callisto | 8.0 | 0.959 | 0.040 | 0.001 |
| m/s | m/s | |||
| Moon | ||||
| Mimas | 0.0 | 6.1 | 0.0 | 6.1 |
| Enceladus | 1.5 | 2.7 | 0.0 | 2.7 |
| Tethys | 2.4 | 1.1 | 0.6 | 1.1 |
| Dione | 2.4 | 0.6 | 0.9 | 0.6 |
| Rhea | 2.0 | 0.4 | 0.8 | 0.4 |
| Iapetus | 0.5 | 0.1 | 0.2 | 0.1 |
| Europa | 4.6 | 0.1 | 2.2 | 0.1 |
| Ganymede | 3.2 | 0.1 | 1.6 | 0.1 |
| Callisto | 2.2 | 1.0 |
| Enceladus Mosaic | Image | Scale [m/pix] |
|---|---|---|
| ISS_003EN_LIMTOP004_PRIME | N1487300107_1 | 148 |
| N1487300285_1 | 141 | |
| N1487300482_1 | 133 | |
| N1487300648_1 | 126 | |
| N1487300854_1 | 118 | |
| ISS_004EN_REGEO002_PRIME | N1489047900_2 | 166 |
| N1489048083_2 | 158 | |
| N1489048255_2 | 151 | |
| N1489048757_2 | 131 | |
| N1489048931_2 | 124 | |
| N1489049105_2 | 117 | |
| ISS_004EN_REGEO002_PRIME | N1489049969_2 | 82 |
| N1489050144_2 | 75 | |
| N1489050320_2 | 68 | |
| N1489050475_2 | 62 | |
| N1489050651_2 | 55 | |
| ISS_011EN_MORPH002_PRIME | N1500062131_1 | 80 |
| N1500062262_1 | 73 | |
| N1500062382_1 | 67 | |
| ISS_011EN_N9COL001_PRIME | N1500061132_1 | 129 |
| N1500061253_1 | 123 | |
| N1500061390_1 | 116 | |
| N1500061512_1 | 110 | |
| N1500061634_1 | 104 | |
| N1500061771_1 | 97 | |
| N1500061892_1 | 91 |
| Mimas Mosaic | Image | Scale [m/pix] |
|---|---|---|
| ISS_126MI_GEOLOG001_PRIME | N1644777693_1 | 93 |
| N1644777828_1 | 97 | |
| N1644777993_1 | 102 | |
| N1644778141_1 | 106 | |
| N1644778308_1 | 110 | |
| N1644778455_1 | 115 | |
| N1644778567_1 | 118 |
| Rhea Mosaic | Image | Scale [m/pix] |
|---|---|---|
| ISS_121RH_REGMAP001_PRIME | N1637518901_1 | 147 |
| N1637519058_1 | 148 | |
| N1637519176_1 | 148 | |
| N1637519283_1 | 149 | |
| N1637519392_1 | 151 | |
| N1637519501_1 | 152 | |
| N1637519610_1 | 154 | |
| N1637519768_1 | 156 | |
| N1637519875_1 | 159 |
