Do all QSOs have the same black hole mass?
Abstract
QSOs from SDSS, 2QZ and 2SLAQ covering an order of magnitude in luminosity at fixed redshift exhibit similar amplitudes of clustering, with the brightest sample showing a clustering length only % higher than the faintest sample. In addition, QSO clustering evolution at is well fitted by a model that assumes a fixed host halo mass. If halo and black-hole masses are related, then this may imply that QSOs occur in a relatively narrow range of halo masses with a correspondingly narrow range of BH mass. HST and Gemini high resolution imaging of QSOs covering a large range in luminosity also show a relatively narrow range in QSO host galaxy luminosity. We argue that the slow evolution of early-type galaxies out to may also provide further support for a slow evolution of QSO host BH masses. The result would mean that if high- QSOs radiate at Eddington rates then low- SyI must radiate at less than Eddington. We discuss the consequences in terms of four empirical models where (a) QSOs radiate at a fixed fraction of , (b) QSO luminosity ‘flickers’ over time, (c) QSOs have a single BH mass and (d) QSOs are long-lived and evolve via Pure Luminosity Evolution (PLE). We conclude that the model requires and to be decoupled to circumvent the clustering results. While the single BH mass and flickering models fit the clustering results, they appear to be rejected by the relation found from reverberation mapping at . We find that the inclusion of QSO clustering data improves the fit of a long-lived QSO model and suggest that the predictions of the PLE model for QSO BH masses agree reasonably with UV-bump and reverberation estimates.
keywords:
quasar clustering1 Introduction
Over recent years there has been much new information on QSO clustering at high and low redshift. Here we combine results from various surveys to look specifically for the luminosity dependence of QSO clustering.
The QSO clustering amplitude in the range evolves only slowly with redshift. Since the mass clustering is falling as redshift increases range, this means that the QSO bias appears to rise with redshift. Converting bias into redshift via Press-Schechter theory implies that, for example, 2QZ QSOs at most redshifts inhabit haloes of (Croom et al., 2005). By comparing the space density of QSOs with the space density of such haloes (Martini & Weinberg, 2001), the general conclusion is that QSOs are short lived, with lifetimes of yrs. This short lifetime has seemed a necessary ingredient in a picture where the QSO halo mass does not appear to increase with time under gravity (Croom et al., 2005).
QSO halo mass and BH mass are generally assumed to be correlated using the empirical relations of Ferrarese & Merritt (2000); Gebhardt et al. (2000); Ferrarese (2002); Wyithe & Loeb (2005) and we shall initially also be making such an assumption. Some empirical support is found in the observational analysis of Fine et al. (2006) where BH masses estimated from BLR line widths are compared to halo masses estimated from QSO clustering. The analyses of Croom et al. (2005) suggest that it depends on which of the above halo-BH mass relations are assumed as to whether there is evolution in the Eddington ratio with redshift or not. Certainly the errors are large enough to encompass various possibilities.
Croom et al. (2005) found little evidence for luminosity dependent QSO clustering at fixed in the 2QZ survey, however the luminosity range in any individual magnitude limited survey is necessarily limited. So Porciani & Norberg (2006) and Shen et al. (2009) claimed some evidence for luminosity dependent QSO clustering respectively within the individual 2QZ and SDSS QSO surveys but both results were only marginally significant. Then da Ângela et al. (2008) found little evidence of a luminosity dependence of clustering after adding the fainter 2SLAQ survey to the 2QZ survey. They suggested that the results might be in good agreement with the models of Lidz et al. (2006) where the results of Croom et al. (2005) were interpreted as suggesting that if QSOs have a short lifetime and evolve quickly from bright to faint states (‘flickering’), then it might be expected that the luminosity dependence of QSO clustering might be small as found by Croom et al. (2005).
Here we shall first find further evidence for the independence of QSO clustering and luminosity supporting these previous conclusions. We shall then consider the implications for QSO evolution by considering four simple empirical models where (a) QSOs radiate at a fixed fraction of (eg Rees 1984), (b) QSO luminosity ‘flickers’ over time (Lidz et al., 2006), (c) QSOs have a single BH mass (Croom et al., 2005; da Ângela et al., 2008) and (d) QSOs are long-lived and follow Pure Luminosity Evolution (PLE, Boyle et al. 1987; Boyle, Shanks, & Peterson 1988). We shall attempt to test each of these against the clustering and other QSO data. In the cases where models fail the QSO clustering test, we shall also consider whether the assumptions that underpin the clustering test may be at fault rather than the model.
The data that we will use comes from the SDSS DR5, 2QZ and 2SLAQ QSO redshift surveys. These surveys provide a range of magnitude limits which cover a factor of 10 in QSO luminosity. This means we can for the first time efficiently check the dependence of small-scale clustering on QSO luminosity. We shall use these results as a context for a discussion on the phenomenology of QSO formation and evolution.
2 QSO Clustering data
2.1 SDSS, 2QZ and 2SLAQ surveys
Previously Croom et al. (2005) used the 2QZ survey to estimate the QSO correlation function and its dependence on redshift and luminosity. This was a survey of QSOs in two deg2 strips in the NGC and SGC. The magnitude limit was and the resulting QSO sky density was deg-2. At the average redshift of , the average absolute magnitude is mag. Croom et al. (2005) measured Mpc and in the range h-1Mpc for the amplitude and slope of the redshift-space correlation function, .
da Ângela et al. (2008) then used the 2SLAQ survey of 9418 QSOs based on SDSS imaging to test the luminosity dependence of the QSO clustering. The magnitude limit was with a sky density of the resulting QSO sky density was deg-2, including the 2dF QSOs where the two surveys overlapped, in a total area of 192deg2. The average absolute magnitude at is mag. da Ângela et al. (2008) found a amplitude and slope similar to that for 2QZ and again found that this QSO clustering amplitude depended very little on redshift or luminosity.
Most recently, Ross et al. (2009) have analysed the clustering of 30239 QSOs in the 5740deg2 SDSS DR5 survey to a limit of , producing an average absolute magnitude of mag or at . This provides a sky density of 5.3deg-2 in the uniform sample where Ross et al. (2009) measured Mpc and in the h-1Mpc range.
2.2 Clustering comparison
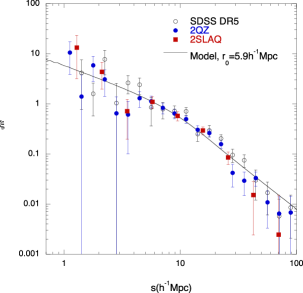
In Fig. 1 we now compare the clustering results from the three surveys directly with each other in terms of the redshift-space correlation function, . The cosmology assumed in all cases is , . We see that all three results are quite consistent, particularly in the range 5-20h-1Mpc where the signal is excellent. The power-law amplitudes and slopes the authors have fitted are also consistent. We checked this by fitting the results consistently in the h-1Mpc range. We have fitted for the real space correlation function scale-length, , assuming power-law slope, , infall parameter, , and line-of-sight pairwise velocity dispersion kms-1 The latter, somewhat degenerate, parameters are in the range usually found in redshift-space distortion analyses of QSO surveys (Hoyle et al., 2002; da Ângela et al., 2008). We find good consistency in these results with SDSS giving h-1Mpc, 2QZ giving h-1Mpc and 2SLAQ giving h-1Mpc. The best overall fit is h-1Mpc. The fits are simple fits, with no account taken of covariance between the correlation function points, since previous results have shown that the sparse QSO sampling leaves them approximately independent, at least at the bin sizes we have used (Croom et al., 2005; da Ângela et al., 2008). The brightest QSO sample scale length (SDSS) is therefore only % larger than the faintest sample. The overall goodness of fit of all 3 surveys to the h-1Mpc model is 46.2 on 36 degrees-of-freedom, acceptable at the level. Thus in surveys ranging from magnitude 19.1 to 21.85 or a factor of in luminosity (), the QSO clustering amplitudes are remarkably similar. Since the three surveys have very similar redshift distributions, this means that the amplitude of clustering at fixed redshift () is approximately independent of QSO luminosity. We further note that other authors have measured the cross-clustering of low redshift QSOs with LRGs and have found a similar lack of dependence on luminosity. For example, Mountrichas et al. (2009) found that LRGs cross-correlated with SDSS, 2QZ and 2SLAQ QSOs with similar amplitudes. Thus both auto- and cross-correlation analyses support the remarkable idea that intrinsically bright and faint QSOs show similar clustering environments.
3 Halo and BH masses via clustering evolution
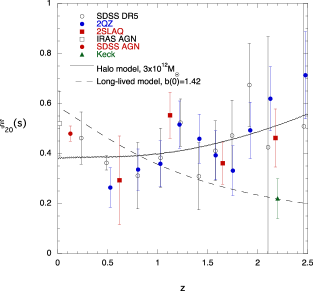
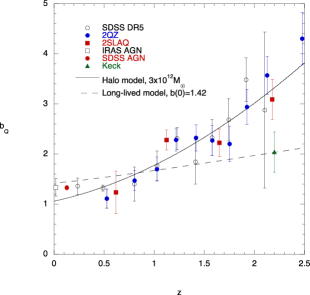
We next consider the halo model fit to the bias-redshift relations shown taken from Croom et al. (2005) for 2QZ, da Ângela et al. (2008) for the 2SLAQ survey and Ross et al. (2009) for the SDSS sample. These results have shown that the bias at each redshift is compatible assuming linear fluctuations and Gaussian density distributions with the QSOs occupying a single halo mass of at all redshifts. If we also assume that there is a host halo mass - BH mass relation (e.g Ferrarese 2002), this means that QSOs may contain the same BH-mass at all redshifts. A model with fixed halo mass of as found by Croom et al. (2005) for 2QZ is compared to the evolution of in Fig. 2a and to the overall QSO bias-redshift relation in 2b. The normalisation for the mass model is also chosen to be the same as that of Croom et al. (2005). A fit based on the SDSS, 2QZ and 2SLAQ QSO datasets gives a fitted halo mass of with , consistent with the result for 2QZ. It can be seen that the single halo mass model is a very good fit to these data, although we note that this model does not represent the evolution of an individual QSO. Following Croom et al. (2005), their equation (24) which assumes the unevolving relation, from Ferrarese (2002) then gives , again approximately independent of redshift. We note that the model dependence of this mass is large with the different models of Ferrarese (2002) and the evolving model of Wyithe & Loeb (2005) predicting masses between and at fixed (Croom et al., 2005). Nevertheless the relative change with is much less model dependent and this is more important for our purposes here.
These conclusions only apply if we base our results on the SDSS, 2QZ and 2SLAQ samples. Including the IRAS AGN, SDSS AGN and Keck points only increases the result to but the single halo mass model is now marginally rejected by the data at the 2-3level ( on 26 dof, ), with the highest residuals coming from the SDSS AGN and Keck points (see Figs. 2) and there is evidence for an increase in halo and hence black-hole masses as we move to lower redshift. For example, the halo mass corresponding to the SDSS AGN sample at is . It might be argued that low redshift Seyfert 2 galaxies may be a different class from the Type I QSOs that dominate at higher redshift but given their lower luminosities, it might be expected that their clustering amplitude represents a lower limit to that of Seyfert I’s at low redshift. In a unified picture these AGN might be expected also to be representative of Seyfert I’s. One caveat is that the SDSS AGN sample may also contain a population of LINERS which may not be comparable to Seyfert I in their clustering properties. Later we shall also argue that their higher space density means that only a fraction are expected to be obscured Seyfert I’s. We also note that Hickox et al. (2011) has suggested that obscured QSOs, with h-1Mpc, may show a higher clustering amplitude than unobscured QSOs, with h-1Mpc, in their QSO samples. We postpone further discussion of these two lower redshift clustering points until Sections 7 and 8.
4 QSO host galaxies via direct imaging
We now look at the empirical evidence for the mass and luminosity of QSO hosts from high resolution direct imaging. Schade, Boyle, & Letawsky (2000) used HST to image X-ray QSOs out to , where imaging decomposition is most reliable. They combined these data with those from similar observations of higher luminosity QSOs from Bahcall et al. (1997) and Boyce et al. (1998). Fig. 13c from these authors shows a flat distribution of host galaxy luminosity with QSO luminosity. This is particularly the case considering that low luminosity hosts of high luminosity QSOs are particularly difficult to detect. These authors also note that when a further decomposition into a bulge and disk is performed, there may then be more dependence of host bulge luminosity on QSO luminosity. The errors on the bulge luminosity become increasingly large and may provide an explanation for the wider scatter that is seen in this relation. There are also observations (e.g. Merloni et al. 2010) and model predictions (e.g. Lamastra et al. 2010) suggesting that the bulge-BH mass relation may not apply at high redshift (see also McLure et al. 2006). The potentially different results for bulge and galaxy luminosities must also be borne in mind because luminosity or more accurately disc stellar mass may better correlated with DM halo mass than bulge mass (e.g Kormendy, Bender, & Cornell 2011; Kormendy & Bender 2011).
This work was extended to higher redshift by Croom et al. (2004) using Gemini ALTAIRNIRI observations of 10 luminous QSOs out to . Only one host galaxy was detected and the upper limits on the others were compatible with simple passive evolution models of the host from the present day. Models where the hosts evolved at the same rate as the QSO luminosities were rejected at high significance. Again if we assume that the bulge-BH mass relation applies at high redshift then these results continue to imply a constant BH mass for high-z QSOs. Similar results have also been reported by other authors. For example, Floyd et al. (2004), in HST observations, also found only an mag range of galaxy host luminosity for an mag range of QSO luminosity, with little evidence for a correlation between the two, except possibly in their upper envelope (see their Fig. 7, upper panel). Thus the results from QSO clustering analyses and from QSO direct imaging appear to support the suggestion that QSO host galaxies may have a luminosity or, by extrapolation, stellar mass that is independent of QSO luminosity.
5 Immediate implications for QSO models
Based on the SDSS, 2QZ and 2SLAQ samples, we have found that either the clustering method is not appropriate or that all QSOs dwell in similar sized haloes. This could further imply that the broad-lined QSO population contain BHs of similar mass, approximately independent of QSO luminosity. The clustering results are powerful with the capability to rule out simple models. For example, the results appear incompatible with the simple model where QSOs all radiate at a fixed fraction of , unless there is no relation between and . Many other models that make this underlying assumption will also have this problem with these data. For example, Fig. 10 of Bonoli et al. (2009) predicts that at , QSOs give h-1Mpc and QSOs give h-1Mpc, ie a difference of h-1Mpc over this mag luminosity range. In comparison, over a wider 2.75 mag range, the data in Fig. 1 only gives h-1Mpc. Thus the predicted h-1Mpc is marginally rejected at . (We ignore the error on the model at fixed because the predicted luminosity dependence clearly persists at all .) Similar conclusions apply to the simplest version of the semi-analytic model of Fanidakis et al. (2011) for the evolution of black hole growth. Other empirical models such as the QSO ‘flickering’ model of Lidz et al. (2006) and the single BH mass QSO model of Croom et al. (2005); da Ângela et al. (2008) do better, since they were designed to explain the early indications of the luminosity independence of QSO clustering.
Thus, QSO host halo and BH masses at fixed may be independent of redshift despite the fact that the QSO luminosity brightens by a factor of in the range . Moreover, since QSOs at fixed redshift have the same clustering strength independent of luminosity or , this could imply that all QSOs have a narrow distribution of BH mass, independent of both redshift and luminosity, with QSOs becoming increasingly sub-Eddington at lower luminosities.
This appears unlikely. However there are some pieces of evidence that this might be the case. First, the luminosity function of the early-type galaxies thought to host QSOs appear to evolve very little over the redshift range out to (Metcalfe et al., 2006; Wake et al., 2006; Brown et al., 2007). If the LF and stellar mass function do not evolve much then it is a short step to supposing that the dynamics of the early-type do not evolve much either (although see Daddi et al. 2005). Then it could be that the BH mass might also be unevolving. The biggest BH lie in the biggest bulges and this relation is then predicted not to evolve with time. The QSOs then have to inhabit a narrow range of bulge/BH mass but with a large range of luminosity at fixed .
An escape from this conclusion could be that the high- QSOs have moved along the galaxy luminosity/mass function to higher galaxy luminosities/masses and hence have higher BH masses more consistent with being at Eddington. However, the fact that it has been so difficult to identify QSO hosts at in high resolution imaging led Croom et al. (2004) to suggest that the data are consistent with the hosts being similar luminosity to those at lower redshift.
Another possible argument for a slowly changing BH mass with time is the fact that the velocity widths, , of the broad lines are similar for high luminosity QSOs at high as they are for low-luminosity Seyfert I’s at low . Now in the standard view where QSOs radiate at approximately a fixed fraction of the Eddington luminosity, this is just a coincidence where the increase in BH mass by a factor of at high is approximately offset by a comparable increase in the BLR radius. Since the BLR radius-luminosity relation takes the form (Peterson et al., 2004; Kaspi et al., 2005; Bentz et al., 2009), if this relation is unevolving with redshift then and so , perhaps slow enough to explain the similarity in line widths. In this fixed fraction of case, there is therefore some empirical evidence to help explain this coincidence. Nevertheless, the explanation is still vulnerable if the relation actually proves to evolve with redshift.
Alternatively, to maintain the single BH mass model, we could pursue the idea motivated by the early-type galaxies that nothing evolves except the QSO luminosity. On this view, the BLR radius might then remain constant with luminosity and hence redshift ie . A fixed broad-line velocity width, , and radius, , gives a fixed BH mass with luminosity/redshift. The question then is whether it is feasible, for example, that the factor of increase in over could leave the BLR radius unchanged if a balance has to be maintained between photoionisation and gravity and this seems physically unlikely. It also seems at odds with the above evidence for the (and ) correlation found from reverberation mapping. Thus if these empirical results are correct then the constancy of QSO velocity width with and must remain simply a coincidence, rather than providing further evidence for the single BH mass model.
Indeed, any single BH mass/flickering model motivated by QSO clustering clearly has a severe problem with the QSO relation found from reverberation mapping at low redshift. Equn (9) of Peterson et al. (2004) rejects no correlation ie a slope of zero in the relation at the level! So here we have potentially the most serious and direct conflict with any simple single black hole mass interpretation of the QSO clustering results. As Peterson et al. (2004) point out, the simple fixed fraction of Eddington model fits the reverberation data very well but this model most clearly contradicts the clustering results. If we are to reconcile the clustering data with the reverberation data, we must conclude that there must be some decoupling of and and this immediately takes away the evidence for the flickering and any other single BH mass model. Meanwhile, we postpone our discussion of reverberation mapping and the PLE model to Section 8 and Fig. 4 where we shall directly compare BH masses predicted by the PLE model to masses derived from reverberation mapping.
6 Number densities of QSOs at all redshifts and luminosities.
The space number density of QSOs compared to the numbers of remnant nuclear black holes in early-type galaxies has been used to argue for short (yr) QSO lifetimes Richstone et al. (1998). However, if the QSOs were restricted to a small range of host galaxy/halo/BH masses as implied by the similarity of the QSO clustering results then this argument would start to push QSO lifetimes higher. Generally, these estimates depend on an assumption that QSO luminosity is proportional to host BH mass and this assumption is also challenged by the lack of a luminosity dependence of QSO clustering. Richstone et al. (1998) suggest that the bright QSO space density at is % of the galaxy density at . Thus, for example, if the QSOs are restricted to % of galaxies then this lifetime would increase to yrs. Clearly the more restricted the galaxy luminosity range, the longer these duty cycle arguments allow the QSO lifetime to be.
More detailed arguments for short QSO lifetimes have been similarly made on the basis of high peaks models of biased QSO clustering. Martini & Weinberg (2001) made predictions for the QSO correlation function based on the halo number densities inferred from QSO lifetimes estimated from QSO and model halo densities. Using the CDM results from these authors and the 2QZ clustering amplitude, Croom et al. (2005) derived a QSO lifetime of 4-50 Myr at . We note that a monotonic increase of halo mass with QSO luminosity is an implicit assumption here, otherwise it is impossible to establish a minimum halo mass at a fixed QSO luminosity limit. In what follows we shall also make this assumption. If we take the change in as % from 2SLAQ (h-1Mpc) to SDSS QSOs (h-1Mpc) then from the approximate relation, , fitted to Fig. 6 of Martini & Weinberg (2001), this corresponds to an bigger halo mass for the CDM model. Now assuming an approximate CDM halo mass function with for (Jenkins et al., 2001) we find that the number of haloes in the mass range is % of the total with . This means that the estimates of QSO lifetime would now lie in the range Myr. Since the clustering of the 2SLAQ, 2QZ and SDSS samples are statistically consistent, the increase in QSO lifetime could even be larger than this estimate.
This conclusion from the clustering is stronger than from the direct QSO imaging results. Here there is an mag range in host luminosity or a factor of , corresponding to % of the haloes with giving an increase in QSO lifetime. Again, since the range for the host luminosities is clearly an upper limit due to no account being taken of galaxy magnitude errors, there is no necessary disagreement with the clustering results and indeed the QSO lifetimes could be much higher if as expected the galaxy magnitude errors dominate the mag scatter. We therefore suggest that the short QSO lifetimes previously derived on the basis of the Martini & Weinberg (2001) arguments are at best lower limits if the QSOs are restricted to a range of halo masses and even on the basis of the present clustering data could imply that this lower limit is yr.
7 Long-lived QSO clustering model
If QSO lifetimes become longer then there is a clear prediction for QSO clustering via the long-lived model of Fry (1996) (see also Croom & Shanks (1996)). Here QSOs (and their host galaxies) are assumed to form at fixed bias at high redshift and then only evolve as separate entities clustering under gravity. This gives the relation:-
where is the gravitational growth factor and for the EdS model. This then produces the evolution for shown in Fig. 2. The relation produces a significantly worse fit than the single halo mass model discussed earlier, falling with redshift whereas the data appears to increase. If we now include the lower redshift results of Georgantopoulos & Shanks (1994) and Wake et al. (2004) then the higher clustering implied at lower redshifts produces improved agreement with the long-lived model prediction. We find that the best fit bias is . However, the model is still rejected at high significance with for 27 data points (26 degrees of freedom). Note that following Croom et al. (2005) this bias for the long-lived model is uncorrected for non-linear effects.
Given that the model assumes a constant bias for all QSOs at formation, this model intrinsically predicts a correlation function compatible with a constant halo mass for QSOs independent of luminosity, at least at fixed redshift. However, it is true that if there was a strong luminosity dependence at fixed shown by the QSO data then this might also have been compatible with the long-lived model.
We note that the cosmology also plays a role here. If we assume an EdS cosmology then reduces by a factor by . While the situation in respect of the single halo mass model remains the same as for the CDM case, the situation in respect of the long-lived model improves significantly, with the model now fitting the high SDSS AGN clustering amplitude while being able to fit better the points at high redshift. The best fit bias is , assuming a CDM normalisation of . Overall the model is acceptable in a chi-square test at the % significance level ( for 27 data points).
Croom et al. (2005) argued against a long-lived model on the grounds that accretion must take place and the halo masses would change contradicting the evidence from the constant mass clustering with redshift. However, this argument is now weakened by the fact that if applied to early-type galaxies and LRGs a contradiction also results in the context of the CDM cosmology which is avoided by appealing to halo occupation distributions (HODs). Indeed, the evolution of the luminosity function and clustering of early-type galaxies themselves appear to be reasonably compatible with long-lived PLE models. The LRG luminosity function appears consistent with passive evolution out to (Wake et al., 2006). Indeed, the NIR H and K galaxy number counts, dominated by early-type galaxies at , show little evidence of strong evolution out to Metcalfe et al. (2006, 2001, 1996). At large scales, Wake et al. (2008) found that for separations h-1Mpc, the evolution of LRG clustering was reasonably consistent with the long-lived, biased evolution out to . At h-1Mpc there was some evidence that the evolutionary model of Fry (1996) was too strong for the data. However, a HOD with a low galaxy merger rate of only 2.4%/Gyr can fit the data. Sawangwit et al. (2009) also found that a simple virialised cluster model, which clearly also conserves galaxy numbers, can improve the fit of a long-lived model to the small-scale clustering at h-1Mpc. Although these results generally only apply to , the fit of a HOD model with only a small amount of galaxy merging but with a halo merging rate which is compatible with CDM suggests that the simple arguments of Croom et al. (2005) against similar long-lived models for QSOs may not be as strong as initially envisaged.
8 PLE Model predictions
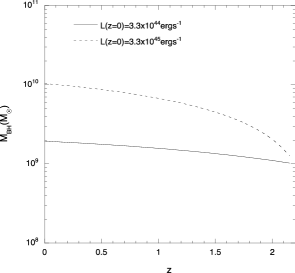
We next connect the above clustering results to the major observation of the evolution of the QSO luminosity function. One model which predicts a ‘long-lived’ evolution with redshift is a pure luminosity evolution (PLE) model. If the dependence of QSO luminosity on redshift is given by , then the dependence of BH mass on redshift is given by
where is the BH efficiency. At the characteristic knee in the luminosity function, an mag QSO has luminosity ergs-1 in the range 1200-10000Å(Marshall et al., 1984). We have assumed the EdS model for analytic simplicity but with fixed Universal age, Gyr. For zero initial mass at , and the QSO then accretes by . We have seen that the low redshift QSO clustering results may prefer such a long-lived model. On the assumption that the halo and long-lived models are self-consistent, the rise in predicted clustering amplitudes from to implies an increase of in halo mass, since from Section 6. Thus if the halo and galaxy growth rates are not decoupled as assumed in the previous section, then would increase by a factor of (since from Section 3) and the PLE model would be rejected on the basis of its much slower predicted growth rate (see Fig. 3). Even if the long-lived clustering model now gives an improved statistical fit with the inclusion of the low-z data in Figs. 2, the theoretical PLE growth rate and the theoretical long-lived model growth rate are mutually incompatible if and follow the above relation.
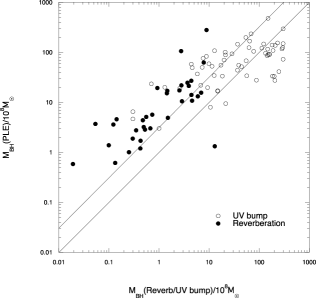
Fig. 4 shows the BH mass for 62 bright Palomar-Green QSOs as estimated from fitting the ‘UV bump’ in their spectra (Laor, 1990), compared to the BH masses estimated from the PLE equation above. At the high mass end, the PLE masses seem in good agreement with the masses of Laor (1990), although at low BH masses, the PLE masses appear too high. Overall the agreement seems reasonable but this is the result for a PLE model with negligible initial BH mass. A single BH mass model would depend on the scatter around and the errors on the UV bump BH masses to explain the range of BH mass shown by the Laor (1990) estimates in Fig. 4.
In a PLE model, the QSO is long-lived, thus explaining why the QSO space density at remains the same with redshift (Marshall, 1985; Boyle, Shanks, & Peterson, 1988; Croom et al., 2004, 2009). In any other model this represents a coincidence. Basically the same luminosity function behaviour is also seen in X-ray surveys (Boyle et al., 1993). There have been some reports that the X-ray LF is inconsistent with PLE (Hasinger et al., 2001; Giacconi et al., 2002; Alexander et al., 2003; Worsley et al., 2004) but these deviations are generally small and at low and in a broad-brush way at least, PLE remains an approximate fit to the X-ray LF. PLE has always been an excellent phenomenological fit to the optical QSO LF (although see Bongiorno et al. 2007) but the question has been whether it has any physical meaning. If exactly true the PLE model would suggest that low Seyfert I’s would have as high a BH mass as high-z QSOs at fixed because the BH fuelling rate at low redshift is small compared to that at high redshift (Marshall, 1985; Boyle, Shanks, & Peterson, 1988).
A single BH mass independent of QSO luminosity is not, however, a prediction of PLE at fixed redshift. The equation above implies that for fixed and a QSO brighter than will produce a bigger black hole mass of by . Indeed, for a QSO, from to , of order the minimum QSO lifetime, a black-hole mass of will already have been created. If we assume that the QSO has to be radiating at no more than Eddington, this implies that the initial mass for such QSOs has to be . If the fainter QSOs have a similar initial mass then this will minimise any difference between bright and faint QSOs (see Fig. 3).
Of course, if halo and BH masses are completely decoupled, then there may be no need to accommodate the approximate luminosity independence of clustering in this way. However, it could be that although halo/BH mass growth rates are decoupled, initial halo and BH masses could still be correlated. If so, the relation must evolve with redshift in the sense that the halo mass containing a particular must decrease as increases. At , all QSOs would then start with the same initial and have the same halo mass to be consistent with the clustering observations. Higher luminosity QSOs then accrete at a faster rate as in Fig. 3 but no luminosity dependence of the QSO clustering is generated because of the decoupling of halo and QSO/galaxy merging rates and the clustering of all QSOs grows at the long-lived rate.
In the context of the original PLE model, QSOs at all luminosities at could radiate at close to the Eddington limit and those at lower redshift then would radiate at increasingly sub-Eddington rates, up to . In the above PLE model case where all the initial must now be the same to fit the clustering results, if we assume that at the brightest QSO is radiating at Eddington, then at the same redshift the fainter QSOs have now to radiate at lower than the Eddington rate. At , these intrinsically faint QSOs have thus now to be radiating at below Eddington. This may be physically feasible in that standard optically thick, physically thin, accretion discs can accrete at down to % of the Eddington rate (C. Done, priv. comm.). Below this rate the accretion disc is unstable to evaporation. Thus the -27 mag QSOs at high redshift and the -22 mag Seyfert I’s locally can both be powered by thin disc accretion. Thus there appears to be a reasonable range of QSO luminosities where the PLE or single-BH mass models can operate within the context of a thin disc accretion model.
The mean BH mass measured in low luminosity SDSS AGN by Heckman et al. (2004) via the relation is and this seems in less good agreement with the PLE prediction than the results of Laor (1990). However, as we have already noted, the SDSS AGN comprise some 18% of the galaxy population whereas broad lined QSOs comprise %. Thus it is plausible that, although some fraction, (%?) of the SDSS AGN may be obscured counterparts of QSOs, the remainder might be expected to be a genuinely lower luminosity AGN population, sufficiently sub-Eddington to make any thin accretion disk unstable. Thus the obscured QSO population in a PLE model might lie only in the high BH mass tail of the SDSS AGN mass distribution which extends beyond (see Fig. 1 (left panel) of Heckman et al. (2004)).
We also revisit the reverberation BH masses of Peterson et al. (2004) for 35 low redshift QSOs and compare these with their predicted PLE masses as we did for the ‘UV-bump’ masses of Laor (1990) (see Fig. 4). We see that there is a good correlation but that the reverberation masses are generally higher than the PLE predictions and the agreement is less good than for the masses of Laor (1990). For the 11 QSOs in common between the two samples, the ‘UV-bump’ masses are higher than the reverberation masses but there is a significant scatter. The amplitude of the reverberation masses contains a scaling factor which was adjusted to fit the relation in quiescent galaxies (Peterson et al., 2004). We also note that if we chose to assume a initial BH mass then the disagreement would clearly worsen between the PLE and reverberation masses. Nevertheless, the correlation with the reverberation masses seen in Fig. 4 means that the PLE model performs better in this respect than if the single BH mass or flickering models were assumed to apply at as at (see Section 5).
9 QSO X-ray variability
A traditional problem for the PLE model is whether the massive BH it predicts, particularly in low redshift Seyfert I’s, can accommodate the short timescale variability observed in some of these sources. The timescale of variability set by a BH mass is s or hrs. Now variability in many QSOs is seen on timescales of hr and the question is whether these can be localised flares, affecting less than 5-10% of the area and total luminosity of the QSO. Clearly the smaller the fraction of the QSO luminosity that the flares affect, the more plausible the argument for the high PLE BH mass becomes. But the fact that the optical and X-ray evolutions are similar is a further coincidence that a long-lived model like PLE explains, since the optical accretion disc is expected to heat the X-ray ‘corona’. We now consider these issues in more detail.
The PLE and single BH mass models both make simple predictions for QSO variability. PLE predicts that at fixed , the amplitude of variability will be approximately independent of redshift because the BH mass only changes slowly with redshift. The single BH mass model makes the even simpler prediction that the variability amplitude will be approximately independent of redshift and luminosity, i.e. or . Almaini et al. (2000) found in a statistical X-ray variability analysis of 86 QSOs from the Deep ROSAT QSO survey Georgantopoulos et al. (1996) that generally the variability of QSOs shows a relatively flat distribution with redshift (see their Fig. 6b). They also found that there was some evidence for an inverse correlation with at which was similar to that found for low-z AGN by Lawrence & Papadakis (1993); Nandra et al. (1997) but this correlation disappeared for (see their Figs. 8a,b). More recently, other authors have made similar studies of QSOs in XMM and Chandra observations. In the CDF-S, Paolillo et al. (2004) analysed 74 variable QSOs and found little evidence of dependence on (see their Fig. 12). In the XMM-Newton Deep Survey of the Lockman Hole, Mateos et al. (2007) found variances for 74 QSOs and AGN that were approximately independent of luminosity and redshift (see their Fig. 5). Finally, Papadakis et al. (2008) in the same XMM-Newton Lockman Hole QSO dataset found no significant correlations with either redshift or luminosity (see their Fig. 2). We conclude that while at , there seems evidence for an inverse correlation between luminosity and variability amplitude, at there seems little evidence of any variability correlation with luminosity or redshift. While the latter results argue for both the PLE and single BH mass model, the former result would only be consistent with the PLE hypothesis. Finally, we note that the amplitude of QSO variability is in the range . Thus this is in the range 10-30% of flux at which level it may be easier to argue that the high BH masses predicted by PLE models may be allowed, if only a fraction of the QSO luminosity is involved in the variability.
10 Discussion
SDSS, 2QZ and 2SLAQ QSOs show similar clustering scale lengths to within %, while spanning an order of magnitude in luminosity. The QSOs in these surveys also show slow clustering evolution with redshift and a model with a single halo/BH mass for all QSOS fits both these results well. If true, then it implies that if the most luminous SDSS QSOs are radiating at Eddington luminosities at , then the faintest 2SLAQ QSOs at lower redshift must be radiating at an lower rate than Eddington. Although problems with BH masses estimated from emission-line widths can be avoided by appealing to evolution in the BLR radius-luminosity relation or in the line-widths themselves, it may be more difficult to explain away the strong correlation implied at from reverberation mapping. This presents an immediate problem for any single BH mass model and variants designed to fit QSO clustering such as the ‘flickering’ model of Lidz et al. (2006).
If QSO halo mass is restricted to a very small range then estimates of QSO lifetime must rise significantly and our very rough estimate is by a factor of to yrs based on the arguments of Martini & Weinberg (2001). This then prompts consideration of the clustering prediction of a long-lived QSO model (Fry, 1996). We find that this model predicts an increase in clustering amplitude at . When we include the low-redshift AGN clustering results of Wake et al. (2004) and Georgantopoulos & Shanks (1994), we find improved agreement with the long-lived model. Including these results also tends to worsen the fit of the single mass halo model. If the QSOs are long-lived then this also tends to argue against the idea that QSOs always radiate at a fixed fraction of because QSO BH mass tends to increase with time while QSO luminosity drops, so even if QSOs start at the Eddington rate they quickly become sub-Eddington.
If the long-lived QSO model is correct, then the QSO clustering results may be consistent with the fit of PLE models to the QSO luminosity function. A physical interpretation of why the QSO space density at is observed to remain approximately constant from to is that the QSOs have a long lifetime and the luminous Type I QSOs seen at dim by a factor of to become the low-luminosity Seyfert I’s seen at z=0. Thus this PLE model prediction may be supported by the QSO clustering results. We have noted that if and follow relations such as , then the theoretical growth rates of from PLE and the long-lived model are mutually incompatible. However, a key feature of the long-lived model is that it implicitly assumes that galaxy/BH and halo mass growth rates are decoupled so that the BH mass growth rate with predicted by PLE is easily accommodated. At fixed , PLE also predicts that BH mass growth rates are proportional to QSO luminosity. But again, since in the context of long-lived models, halo and BH mass growth are naturally decoupled there is no necessary contradiction with the clustering results here for PLE. This decoupling has given us the freedom to assume a constant initial BH mass for the PLE model so that it is actually in line with the luminosity independent clustering results at high . Then the higher accretion rate of the more luminous QSOs gives the possibility of generating the luminosity-BH reverberation mass correlation found at , without also generating clustering that is too luminosity dependent at these redshifts. In this picture, it is the lack of a relation between halo and galaxy/BH mass that explains the lack of luminosity dependence of QSO clustering seen in Fig. 1, rather than the lack of a relation between luminosity and BH mass.
Recently, Kormendy, Bender, & Cornell (2011); Kormendy & Bender (2011) have presented evidence that nuclear velocity dispersions may not correlate well with galaxy circular velocities in cases they have observed where there is no bulge, just nuclear star-clusters. They also argue that dynamically measured do not correlate well with disc stellar masses. Since circular velocities and disk stellar masses usually correlate well with DM halo masses, they then conclude that DMH masses don’t correlate well with . These results have some resonance with the arguments we have presented above based on QSO clustering and also the direct imaging of QSO hosts. We have argued that these results imply either that QSOs have the same BH mass or that the halo and BH mass growth rates are decoupled. In particular, our long-lived PLE model argues for a decoupling of halo and BH mass at least at to reconcile the slow evolution of QSO clustering with the faster predicted evolution of halo clustering. In the models of Lidz et al. (2006) it is the QSO luminosity that decouples from the BH/DMH masses to explain the clustering results. But in these scenarios the BH and DMH masses are expected to be strongly correlated, in contradiction with the new results of Kormendy, Bender, & Cornell (2011).
11 Conclusions
For clarity, we summarise the arguments for and against the four QSO models we have discussed above:
-
•
QSOs radiate at a fixed fraction of :
-in favour - reverberation mapping relation
- agrees with virial estimates of using unevolved BLR relation.
- against - this model predicts strongly luminosity dependent clustering which is not observed; need to break the relation as suggested by Kormendy, Bender, & Cornell (2011).
- if the QSOs are long-lived as implied by the luminosity independence of the clustering then they cannot always operate at a fixed fraction of and be consistent with observed QSO luminosity evolution.
-
•
The ‘flickering’ model of Lidz et al. (2006):
- in favour - independent QSO clustering.
- against - the reverberation mapping relation at .
- virial estimates of using the unevolved BLR relation.
- the longer duty cycles suggested by the coherent QSO LF evolution.
- Kormendy, Bender, & Cornell (2011) evidence against the assumed relation.
-
•
The single BH mass model:
- in favour - independent QSO clustering.
- against - the rise in clustering amplitude at .
- the reverberation mapping relation at .
- virial estimates of using the unevolved BLR radius-luminosity relation.
-
•
The long-lived/PLE model:
- in favour - independence of QSO clustering implies long lifetime.
- not ruled out by the QSO clustering evolution over the range
- reasonably reproduces reverberation and UV bump .
- explains coherent QSO LF evolution.
- invokes a decoupled relation as evidenced by Kormendy, Bender, & Cornell (2011).
- against - virial estimates of using the unevolved BLR relation.
- short X-ray variability timescales for low-z Seyfert I.
It is clear that models which predict well the QSO clustering results then tend to have a problem with the reverberation and UV bump relation and vice versa. We take the view that it is easier to circumvent the clustering results (by decoupling and ) than the reverberation mapping results. Therefore the answer to the question posed in the title may be that QSOs do not all have the same black-hole mass, although they may occupy similar halo masses at fixed redshift. Overall, we conclude that a model that is reasonably consistent with both clustering and the reverberation/UV-bump masses is the long-lived PLE model.
Acknowledgments
We thank an anonymous referee for comments which improved the quality of this paper.
US acknowledges financial support from the Institute for the Promotion of Teaching Science and Technology (IPST) of The Royal Thai Government.
We thank all the present and former staff of the Anglo-Australian Observatory for their work in building and operating the 2dF facility.
Funding for the SDSS and SDSS-II has been provided by the Alfred P. Sloan Foundation, the Participating Institutions, the National Science Foundation, the U.S. Department of Energy, the National Aeronautics and Space Administration, the Japanese Monbukagakusho, the Max Planck Society, and the Higher Education Funding Council for England. The SDSS Web Site is http://www.sdss.org/.
References
- Adelberger & Steidel (2005) Adelberger K. L., Steidel C. C., 2005, ApJ, 627, L1
- Alexander et al. (2003) Alexander D. M., et al., 2003, AJ, 126, 539
- Almaini et al. (2000) Almaini O., et al., 2000, MNRAS, 315, 325
- Bahcall et al. (1997) Bahcall J. N., Kirhakos S., Saxe D. H., Schneider D. P., 1997, ApJ, 479, 642
- Bentz et al. (2009) Bentz M. C., Peterson B. M., Netzer H., Pogge R. W., Vestergaard M., 2009, ApJ, 697, 160
- Bongiorno et al. (2007) Bongiorno A., et al., 2007, A&A, 472, 443
- Bonoli et al. (2009) Bonoli S., Marulli F., Springel V., White S. D. M., Branchini E., Moscardini L., 2009, MNRAS, 396, 423
- Boyce et al. (1998) Boyce P. J., et al., 1998, MNRAS, 298, 121
- Boyle et al. (1987) Boyle B. J., Fong R., Shanks T., Peterson B. A., 1987, MNRAS, 227, 717
- Boyle, Shanks, & Peterson (1988) Boyle B. J., Shanks T., Peterson B. A., 1988, MNRAS, 235, 935
- Boyle et al. (1993) Boyle B. J., Griffiths R. E., Shanks T., Stewart G. C., Georgantopoulos I., 1993, MNRAS, 260, 49
- Boyle et al. (2000) Boyle B. J., Shanks T., Croom S. M., Smith R. J., Miller L., Loaring N., Heymans C., 2000, MNRAS, 317, 1014
- Brown et al. (2007) Brown M. J. I., Dey A., Jannuzi B. T., Brand K., Benson A. J., Brodwin M., Croton D. J., Eisenhardt P. R., 2007, ApJ, 654, 858
- Corbett et al. (2003) Corbett E. A., et al., 2003, MNRAS, 343, 705
- Croom et al. (2004) Croom S. M., Schade D., Boyle B. J., Shanks T., Miller L., Smith R. J., 2004, ApJ, 606, 126
- Croom & Shanks (1996) Croom S. M., Shanks T., 1996, MNRAS, 281, 893
- Croom et al. (2004) Croom S. M., Smith R. J., Boyle B. J., Shanks T., Miller L., Outram P. J., Loaring N. S., 2004, MNRAS, 349, 1397
- Croom et al. (2005) Croom S. M., et al., 2005, MNRAS, 356, 415
- Croom et al. (2009) Croom S. M., et al., 2009, MNRAS, 399, 1755
- da Ângela et al. (2008) da Ângela J., et al., 2008, MNRAS, 383, 565
- Daddi et al. (2005) Daddi E., et al., 2005, ApJ, 631, L13
- Fanidakis et al. (2011) Fanidakis N., Baugh C. M., Benson A. J., Bower R. G., Cole S., Done C., Frenk C. S., 2011, MNRAS, 410, 53
- Ferrarese & Merritt (2000) Ferrarese L., Merritt D., 2000, ApJ, 539, L9
- Ferrarese (2002) Ferrarese L., 2002, ApJ, 578, 90
- Fine et al. (2006) Fine S., et al., 2006, MNRAS, 373, 613
- Floyd et al. (2004) Floyd D. J. E., Kukula M. J., Dunlop J. S., McLure R. J., Miller L., Percival W. J., Baum S. A., O’Dea C. P., 2004, MNRAS, 355, 196
- Fry (1996) Fry J. N., 1996, ApJ, 461, L65
- Gebhardt et al. (2000) Gebhardt K., et al., 2000, ApJ, 539, L13
- Georgantopoulos & Shanks (1994) Georgantopoulos I., Shanks T., 1994, MNRAS, 271, 773
- Georgantopoulos et al. (1996) Georgantopoulos I., Stewart G. C., Shanks T., Boyle B. J., Griffiths R. E., 1996, MNRAS, 280, 276
- Giacconi et al. (2002) Giacconi R., et al., 2002, ApJS, 139, 369
- Hasinger et al. (2001) Hasinger G., et al., 2001, A&A, 365, L45
- Heckman et al. (2004) Heckman T. M., Kauffmann G., Brinchmann J., Charlot S., Tremonti C., White S. D. M., 2004, ApJ, 613, 109
- Hickox et al. (2011) Hickox R. C., et al., 2011, ApJ, 731, 117
- Hoyle et al. (2002) Hoyle F., Outram P. J., Shanks T., Boyle B. J., Croom S. M., Smith R. J., 2002, MNRAS, 332, 311
- Jenkins et al. (2001) Jenkins A., Frenk C. S., White S. D. M., Colberg J. M., Cole S., Evrard A. E., Couchman H. M. P., Yoshida N., 2001, MNRAS, 321, 372
- Kaspi et al. (2000) Kaspi S., Smith P. S., Netzer H., Maoz D., Jannuzi B. T., Giveon U., 2000, ApJ, 533, 631
- Kaspi et al. (2005) Kaspi S., Maoz D., Netzer H., Peterson B. M., Vestergaard M., Jannuzi B. T., 2005, ApJ, 629, 61
- Kormendy, Bender, & Cornell (2011) Kormendy J., Bender R., Cornell M. E., 2011, Nature, 469, 374
- Kormendy & Bender (2011) Kormendy J., Bender R., 2011, Nature, 469, 377
- Lamastra et al. (2010) Lamastra A., Menci N., Maiolino R., Fiore F., Merloni A., 2010, MNRAS, 405, 29
- Laor (1990) Laor A., 1990, MNRAS, 246, 369
- Lawrence & Papadakis (1993) Lawrence A., Papadakis I., 1993, ApJ, 414, L85
- Lidz et al. (2006) Lidz A., Hopkins P. F., Cox T. J., Hernquist L., Robertson B., 2006, ApJ, 641, 41
- Manners, Almaini, & Lawrence (2002) Manners J., Almaini O., Lawrence A., 2002, MNRAS, 330, 390
- Marshall et al. (1984) Marshall H. L., Huchra J. P., Tananbaum H., Avni Y., Braccesi A., Zitelli V., Zamorani G., 1984, ApJ, 283, 50
- Marshall (1985) Marshall H. L., 1985, ApJ, 299, 109
- Martini & Weinberg (2001) Martini P., Weinberg D. H., 2001, ApJ, 547, 12
- Mateos et al. (2007) Mateos S., Barcons X., Carrera F. J., Page M. J., Ceballos M. T., Hasinger G., Fabian A. C., 2007, A&A, 473, 105
- McLure et al. (2006) McLure R. J., Jarvis M. J., Targett T. A., Dunlop J. S., Best P. N., 2006, MNRAS, 368, 1395
- Merloni et al. (2010) Merloni A., et al., 2010, ApJ, 708, 137
- Metcalfe et al. (2006) Metcalfe N., Shanks T., Weilbacher P. M., McCracken H. J., Fong R., Thompson D., 2006, MNRAS, 370, 1257
- Metcalfe et al. (2001) Metcalfe N., Shanks T., Campos A., McCracken H. J., Fong R., 2001, MNRAS, 323, 795
- Metcalfe et al. (1996) Metcalfe N., Shanks T., Campos A., Fong R., Gardner J. P., 1996, Nature, 383, 236
- Mountrichas et al. (2009) Mountrichas G., Sawangwit U., Shanks T., Croom S. M., Schneider D. P., Myers A. D., Pimbblet K., 2009, MNRAS, 394, 2050
- Nandra et al. (1997) Nandra K., George I. M., Mushotzky R. F., Turner T. J., Yaqoob T., 1997, ApJ, 477, 602
- Paolillo et al. (2004) Paolillo M., Schreier E. J., Giacconi R., Koekemoer A. M., Grogin N. A., 2004, ApJ, 611, 93
- Papadakis et al. (2008) Papadakis I. E., Chatzopoulos E., Athanasiadis D., Markowitz A., Georgantopoulos I., 2008, A&A, 487, 475
- Peterson et al. (2004) Peterson B. M., et al., 2004, ApJ, 613, 682
- Porciani & Norberg (2006) Porciani C., Norberg P., 2006, MNRAS, 371, 1824
- Rees (1984) Rees M. J., 1984, ARA&A, 22, 471
- Richstone et al. (1998) Richstone D., et al., 1998, Nature, 395, A14
- Ross et al. (2009) Ross N. P., et al., 2009, ApJ, 697, 1634
- Sawangwit et al. (2009) Sawangwit U., Shanks T., Abdalla F. B., Cannon R. D., Croom S. M., Edge A. C., Ross N. P., Wake D. A., 2009, arXiv, arXiv:0912.0511
- Schade, Boyle, & Letawsky (2000) Schade D. J., Boyle B. J., Letawsky M., 2000, MNRAS, 315, 498
- Shen et al. (2009) Shen Y., et al., 2009, ApJ, 697, 1656
- Wake et al. (2004) Wake D. A., et al., 2004, ApJ, 610, L85
- Wake et al. (2006) Wake D. A., et al., 2006, MNRAS, 372, 537
- Wake et al. (2008) Wake D. A., et al., 2008, MNRAS, 387, 1045
- Worsley et al. (2004) Worsley M. A., Fabian A. C., Barcons X., Mateos S., Hasinger G., Brunner H., 2004, MNRAS, 352, L28
- Wyithe & Loeb (2005) Wyithe J. S. B., Loeb A., 2005, ApJ, 621, 95