Intermediate-age Stars as Origin of Low Stellar velocity Dispersion Nuclear Rings: the case of Mrk 1157
Abstract
We have used the Gemini Near-infrared Integral Field Spectrograph (NIFS) to map the age distribution of the stellar population in the inner 400 pc of the Seyfert 2 galaxy Mrk 1157 (NGC 591), at a spatial resolution of 35 pc. We have performed wavelet and principal component analysis in the data in order to remove instrumental signatures. An old stellar population component (age 5 Gyr) is dominant within the inner 130 pc which we attribute to the galaxy bulge. Beyond this region, up to the borders of the observation field, young to intermediate age components (0.1–0.7 Gyr) dominate. As for Mrk 1066, previously studied by us, we find a spatial correlation between this intermediate age component and a partial ring of low stellar velocity dispersions (). Low- nuclear rings have been observed in other active galaxies and our results for Mrk 1157 and Mrk 1066 reveal that they are formed by intermediate age stars. Such age is consistent with a scenario in which the origin of the low- rings is a past event which triggered an inflow of gas and formed stars which still keep the colder kinematics of the gas from which they have formed. No evidence for the presence of an unresolved featureless continuum and hot dust component – as found in Mrk1066 – are found for Mrk 1157.
keywords:
galaxies: individual (NGC 591) – galaxies: individual (Mrk 1157) – galaxies: Seyfert – galaxies: stellar content –galaxies: near-infrared – data analysis: wavelet transform – data analysis: principal component analysis1 Introduction
The co-existence of an active galactic nucleus (AGN) and young stars in the central region of Seyfert galaxies is a widely known phenomenon, (e.g. Storchi-Bergmann et al., 2000, 2001; González-Delgado et al., 2001; Cid Fernandes et al., 2004; Asari et al., 2007; Dors et al., 2008), supporting the so-called AGN-Starburst connection (e.g. Norman & Scoville, 1988; Terlevich et al., 1990; Heckman et al., 1997; Heckman, 2004; Riffel et al., 2009c). The above studies have pointed out that the main difference between the stellar population (SP) of active and non-active galaxies is an excess of intermediate age stars in the former. In addition, near-infrared (NIR) SP studies have revealed that the continuum is also dominated by the contribution of intermediate-age stellar population components (SPCs, Riffel et al., 2007, 2009d, 2010b; Martins et al., 2010). In the NIR, another component is commonly detected in the nuclear spectra of Seyfert galaxies: unresolved hot dust emission (Riffel et al., 2009b, c, d; Rodríguez-Ardila et al., 2006; Rodríguez-Ardila, Riffel & Pastoriza, 2005). Thus, the study of the contribution of the SPs and other components to the circumnuclear continuum of active galaxies is a fundamental key in the understanding of the nature of their central engine.
Very recently, the use of integral field spectroscopy with adaptive optics at the Gemini North Telescope has allowed us to derive the contribution of distinct SPCs to the NIR spectra of active galaxies. In addition, we have mapped SPCs spatial distributions and performed the first two-dimensional (2D) SP synthesis in the NIR of the nuclear region of an active galaxy (Mrk 1066, Riffel et al., 2010b). A spatial correlation between the intermediate age SPC and a partial ring of low stellar velocity dispersions () was found, supporting the interpretation that the low- structures commonly observed in the inner few hundreds parsecs of Seyfert galaxies are due to colder regions with more recent star formation than the underlying bulge (Barbosa et al., 2006; Riffel et al., 2008a, 2009a; Riffel & Storchi-Bergmann, 2010d). Using a different method — modelling the Br equivalent width, supernova rate and mass-to-light ratio — Davies et al. (2007) have quantified the star formation history in the centre of 9 nearby Seyfert galaxies using their stars code. They found that the ages of the stars which contribute most to the NIR continuum lie in the range 10–30 Myr, pointing out that these ages should be considered only as “characteristic”, as they have not performed a proper spectral synthesis, suggesting that there may be simultaneously two or more SPs that are not coeval (Davies et al., 2007, 2006).
As part of an ongoing project aimed at mapping the 2D age distribution of the NIR SP in the inner few hundred parsecs of Seyfert galaxies, we present the NIR SP synthesis of the Seyfert 2 galaxy Mrk 1157 (NGC 591), an early type barred spiral galaxy located at a distance Mpc (from NASA/IPAC Extragalactic Database, NED), for which 1″ corresponds to 296 pc at the galaxy. The near-IR gas excitation and kinematics as well as the stellar kinematics of the inner 450 pc of Mrk 1157 are discussed in Riffel & Storchi-Bergmann (in prep.) using the same data used here.
2 The data
2.1 Observations and Data Reduction
Mrk 1157 was observed with Gemini NIFS (McGregor et al., 2003) operating with the Gemini North Adaptive Optics system ALTAIR in September/October 2009 under the programme GN-2009B-Q-27, following the standard Object-Sky-Sky-Object dither sequence, with off-source sky positions since the target is extended, and individual exposure times of 550 s.
Two sets of observations with six on-source individual exposures were obtained at different spectral ranges: the first at the J-band, centred at 1.25 m and covering the spectral region from 1.14 m to 1.36 m, and the second at the Kl-band, centred at 2.3 m, covering the spectral range from 2.10m to 2.53m. At the J-band, the J_G5603 grating and ZJ_G0601 filter were used, resulting in a spectral resolution of , as obtained from the measurement of the full width at half maximum (FWHM) of ArXe arc lamp lines. The Kl-band observations were obtained using the Kl_G5607 grating and HK_G0603 filter and resulted in a spectral resolution of FWHM.
The data reduction was accomplished using tasks contained in the nifs package which is part of gemini iraf111IRAF is distributed by the National Optical Astronomy Observatories, which are operated by the Association of Universities for Research in Astronomy, Inc., under cooperative agreement with the National Science Foundation. package, as well as generic iraf tasks. The reduction procedure included trimming of the images, flat-fielding, sky subtraction, wavelength and s-distortion calibrations. We have also removed the telluric bands and flux calibrated the frames by interpolating a black body function to the spectrum of the telluric standard star.
The angular resolution obtained from the FWHM of the spatial profile of the telluric standard star is 011002 for the J-band and 012002 for the Kl-band, corresponding to 32.65.9 and 35.55.9 pc at the galaxy, respectively. Since the star has been observed for a shorter time than the galaxy, this value should be considered as a lower limit for the spatial resolution. Nevertheless, the performance of ALTAIR for larger integration times (such those used for the galaxy) in previous works by our group was found to be similar to the one reached in the observation of the star. In the case of NGC 4151, the spatial resolution of the galaxy is only 002 worse than those obtained from the FWHM of the brightness profile of the star (Storchi-Bergmann et al., 2009). For each band, individual datacubes were created at an angular sampling of 005005 and combined to a single datacube using the gemcombine iraf task. More details about observations and data reduction can be found in Riffel & Storchi-Bergmann (in prep.).
2.2 Removing noise effects: The WPCA Method
Because of the complexity of the instruments, hyperspectral data frequently contains instrumental signatures that cannot be removed with standard data reduction techniques, and which in many cases contaminates the science data. The Gemini NIFS is no exception. The wavelet principal component analysis (WPCA) technique described below (a full account of the technique will be addressed in a paper in preparation - Ferrari et al. 2011) can separate the instrumental fingerprint and, after its removal, allow the analysis of the “clean” data.
2.2.1 Principal Component Analysis
Besides the relevant information, any set of data has some amount of redundant information and noise. The goal of principal component analysis (PCA) is to find a new basis on which the data – the spectra from each spatial pixel - is expressed in a more meaningful way. The basis vectors – the principal components – are obtained by searching for the maximum variance in the data. There are as many vectors as the original variables, but usually the first few vectors contain most of the information of the data set: they provide a more concise description of the data. Often the physical content is restricted to few vectors and thus interpretation can be easier. Mathematically we proceed as follows. In a basis where the variables are all uncorrelated (orthogonal) their covariance or correlation matrix is diagonal. We then find the principal components by diagonalizing the covariance or correlation matrix of the original data. In the case of covariance matrix, the eigenvectors are the principal components and the eigenvalues are the variance associated with each of the eigenvectors. In the case of a hyperspectral cube, it is informative to measure the correlation between each principal component and the spectra in each spatial pixel: the tomograms. For example, tomogram 1 is the projection (scalar product) of eigenvector 1 and the spectra relative to each spatial pixel. For a full description on the method applied to astronomical data, see Steiner et al. (2009).
2.2.2 Discrete Wavelet Transform
The Discrete Wavelet Transform (DWT) consists of describing a signal in terms of a smoothed component and detail wavelet coefficients (Mallat, 1999; Starck & Murtagh, 2006):
| (1) |
The maximum wavelet scale is . In the à trous (i.e. with holes) algorithm (Starck & Murtagh, 2006) used in this work, a series of smoothed versions of are calculated by convolving with scaled versions of a low-pass filter . In this way, the term is calculated by taking adjacent pixels from that are pixels far apart. We proceed in this way for each of the scale . After this, the discrete wavelet transform is obtained from the difference
| (2) |
The wavelet coefficients now retain only details which are about in size, a multiresolution transform. The maximum scale is mathematically arbitrary because, by virtue of Eq. (1) and (2), reconstruction is complete for any . Physically, is chosen so that the spatial frequencies of interest are lower than .
2.2.3 The WPCA Algorithm
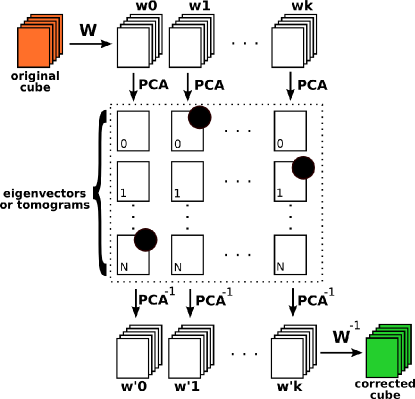
The idea behind the use of the wavelet and the PCA transforms together is to decompose the original signal both in the wavelet and in the PCA space, select unwanted features and finally reconstruct the signal after eliminating these features. The algorithm is schematically shown in Figure 1. The original datacube (orange) is first decomposed in wavelets scales . Then, the PCA analysis is performed in each of the wavelet components, resulting in several eigenvectors for each scale. After removing those eigenvectors which contain unwanted structures (represented by black dots in the figure), each of the wavelets components is restored with the PCA reconstruction, , and then the resulting corrected wavelets are combined to form the resulting corrected cube (green).
2.2.4 Application to Mrk 1157
Figure 2 shows an example of the WPCA transform of Mrk 1157 datacube. The columns are the wavelet decomposition of the original cube. In both Fig.1 and 2 the dotted rectangle represents the same kind of information: in each wavelet scale a PCA analysis is performed. The original information is completely represented in the wavelet space, thus summing up all the components gives back the original data. The WPCA cleaning process is basically to identify the components (in wavelet and PCA space) which contains mostly instrumental signatures (i.e noise), then remove them and reconstruct the signal.
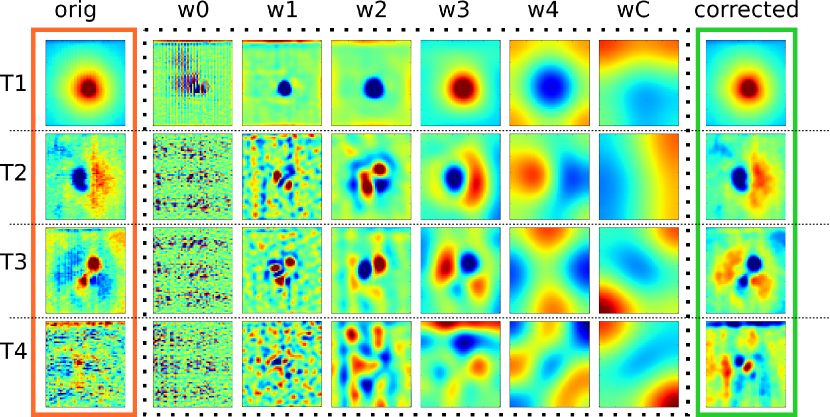
In the case of Mrk 1157 observations, the WPCA decomposition reveals that the tomograms are dominated by the instrumental signature (horizontal and vertical stripes in Fig. 2). That instrumental fingerprint can also be identified in the eigenvectors as high frequency bumps (not shown) in the beginning and in the end of the spectra – the instrumental signature has a spatial and spectral behaviour. Thus, we remove and reconstruct the cube with . We call the attention to the fact that we have analysed 5 wavelet scales and 20 principal componentes (with 20 eigenvectors and 20 tomograms; a total of 200 maps) to identify the instrumental signature. For sake of brevity, in Fig. 2 we only show the first 4 principal components, which account for 95% of the data variance.
The clean datacube was used to perform the stellar population analysis. The spatial resolution of the J and Kl bands are very similar, allowing us to combine both datacubes into a single datacube and then perform the spectral synthesis. The combination was done using the scombine iraf task at a spectral sampling of 2 Å. The astrometry was done using the peak of the continuum emission in both bands. We have re-binned the resulting datacube to a spatial sampling of 01 in order to reach a signal-to-noise ratio (S/N) high enough to obtain a reliable fit of the stellar population. The resulting S/N ranges from at the borders of the NIFS field to up to 120 at the nucleus. We used the wspectext iraf task to convert the individual spectra of the final datacube to 784 ascii files, used as input to the synthesis code. The observation field is 2828, which corresponds to 830830 pc2 at the galaxy.
3 Spectral Synthesis
Our main goal in this section is to map in detail the NIR spectral energy distribution (SED) components of the inner 400 pc of Mrk 1157. For this purpose we fit simultaneously the underlying continuum of the and bands applying the method described in Riffel et al. (2009d) and summarized below.
In order to perform the stellar population synthesis we use the starlight code (Cid Fernandes et al., 2004, 2005a; Mateus et al., 2006; Asari et al., 2007; Cid Fernandes et al., 2008). starlight fits the whole underlying spectrum, excluding emission lines and spurious data, mixing computational techniques originally developed for semi empirical population synthesis with ingredients from evolutionary synthesis models (Cid Fernandes et al., 2004, 2005a). Essentially, the code fits an observed spectrum, , with a combination, in different proportions, of single stellar populations (SSPs). Extinction is parametrised by the V-band extinction and modelled by starlight as due to foreground dust. In the fits we use the CCM (Cardelli, Clayton & Mathis, 1989) extinction law. In order to model a spectrum , the code solves the following equation:
| (3) |
where x is the population vector, whose components , (j = 1,..,N) represent the fractional contribution of each SSP in the base to the total synthetic flux at . is the spectrum of the th SSP of the base of elements normalized at , the reddening term is represented by , is the synthetic flux at the normalisation wavelength, denotes the convolution operator and is the Gaussian distribution used to model the line-of-sight stellar motions, which is centred at velocity with dispersion . However, note that due to the low spectral resolution of EPS models in the NIR, the values cannot be derived in a reliable way from the synthesis, thus, we do not use them. For details on see Sec. 4. The final fit is carried out minimizing the equation:
| (4) |
where emission lines and spurious features are excluded from the fit by fixing =0.
In Eq. 3, the most important ingredient in stellar population synthesis is the base set, . As default base starlight uses the SSPs of Bruzual & Charlot (2003). However, these SSPs do not include the effect of the contribution of thermally pulsating asymptotic giant branch (TP-AGB) stars, whose contribution is enhanced in the NIR and crucial to model the stellar populations in this spectral region (see Riffel et al., 2007, 2008b, 2009d, 2010b; Martins et al., 2010). Thus, we update the base using the Maraston (2005) Evolutionary Population Synthesis (EPS) models as described in Riffel et al. (2009d). The base comprises SSPs synthetic spectra covering 12 ages (0.01,0.03, 0.05, 0.1, 0.3, 0.5, 0.7, 1, 2, 5, 9 and 13 Gyr) and four metallicities (0.02, 0.5, 1, 2 Z⊙). We also include black-body functions for temperatures in the range 700-1400 K in steps of 100 K (Riffel et al., 2009d) and a power-law () in order to account for possible contributions from dust emission () and from a featureless continuum (), respectively, at the nucleus (e.g. Cid Fernandes et al., 2004). The same spectral base was used to map the age distribution of the stellar population in the inner 300 pc of Mrk 1066 (Riffel et al., 2010b).
4 Results
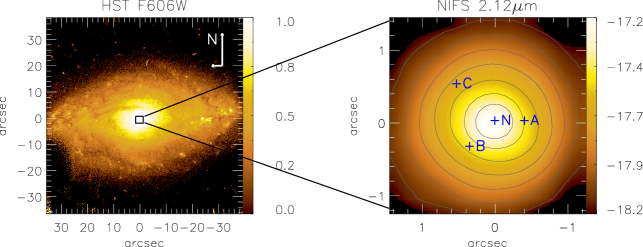
In Fig. 3 (top-left) we show an optical image of Mrk 1157 taken with the Wide Field and Planetary Camera 2 (WFPC2) at the Hubble Space Telescope (HST) through the filter F606W (Malkan, Gorjian & Tam, 1998). The 2.17 m NIFS datacube continuum image is also shown in Fig. 3 (top-right). In order to illustrate the accuracy of our fits, we show in Fig. 3 (bottom) sample spectra, obtained within 0101 apertures for four distinct positions: the nucleus (position N marked at top-left panel of Fig. 3) and 04 west (position A), 05 south-east (position B) and 08 north-east (position C) of the nucleus. The synthetic spectra were overploted on the data as dotted lines. As can be observed in this figure, the modelling of the stellar population reproduces very well the continuum/absorption spectra at all positions of Mrk 1157. Following Riffel et al. (2010b) the observed and synthetic spectra were normalized at 2.12 m, a region free of emission/absorption lines (Riffel et al., 2008b).
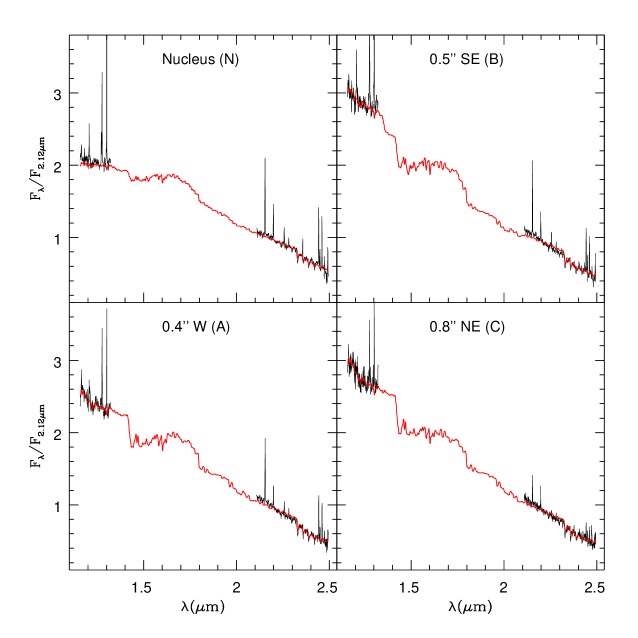
No contribution of the and/or components was necessary in order to reproduce the the nuclear continuum in Mrk 1157. Similar result was obtained by Riffel et al. (2009d) when fitting the nuclear integrated spectrum of this source within a larger aperture (r200 pc) over the 0.8—2.4m spectral region. We point out that the synthetic spectra was reddened using the AV derived from the synthesis (Fig. 7).
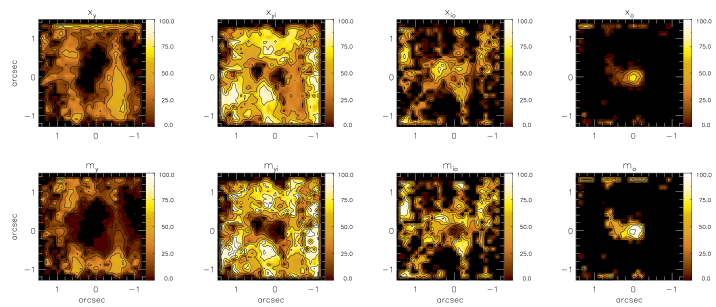
Following Riffel et al. (2010b, see also Riffel et al., 2009 and Cid-Fernandes et al. 2004), we have binned the contribution of the SPCs () into a reduced population vector with four age ranges: young (: Myr); young-intermediate (: Gyr), intermediate-old (: Gyr) and old (: Gyr). In Fig. 5, we show the spatial distribution of the percent flux contribution at 2.12 m of the stars in each : while in regions farther than r 0.8(240 pc) from the nucleus the contribution of the young-intermediate SPCs reaches values of up to 100%, closer to the nucleus the contribution of this component is negligible. Within this region the stellar population is dominated by the old component(50%), closely surrounded (r 04) by an intermediate-old population (also 50%). No signs of young stellar populations were detected close to the nucleus; however, a significant contribution (25-60%) is found in regions farther than 06.
The light-fraction SPC contributions depend of the normalization wavelength and thus the comparison with results from other spectral regions should be done with caution (Riffel et al., 2010c). However, a physical parameter which does not depend on the normalization point used in the fit is the stellar mass. The mass-fraction of each population vector components is show in Fig. 5 (young: , young-intermediate: , intermediate-old: and old population: ). The maps of the mass-weighted SPC follow a similar distribution to the light-weighted ones. However, in the former the contribution of the older ages is enhanced, particularly within 04 from the nucleus.
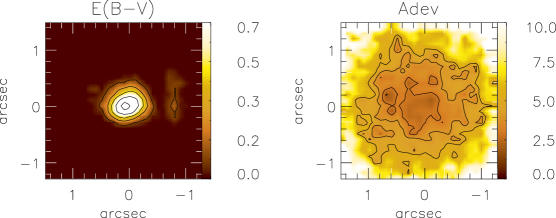
Besides the SPC distributions, the starlight outputs the average reddening of the stellar populations (Fig. 7). The highest values of (we used =3.1E(B-V)) are reached at the nucleus up to within 02 from it.
The goodness of the fit is measured in starlight by the percent mean deviation: adev=, where is the observed spectrum and is the fitted model (Cid Fernandes et al., 2004, 2005b). The adev map for Mrk 1157 is shown in Fig. 7 and presents values % at most locations, indicating that the model reproduces very well the observed underlying spectra.
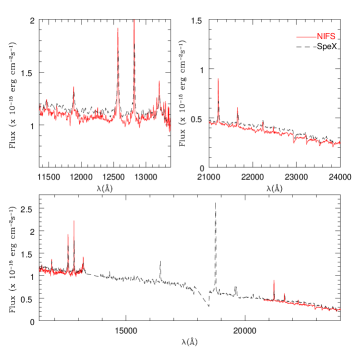
We point out that, in order to have a robust result on stellar population fitting with starlight it is important to have a reliable flux calibration (see starlight manual). In other words the fit depends on the overall shape of the observed spectrum from the to the -band, and our NIFS observations misses the -band. In order to verify the reliability of our flux calibration we have extracted a spectrum from our datacubes matching the aperture and position angle of our SpeX cross-dispersed spectrum (Riffel, Rodríguez-Ardila, & Pastoriza, 2006a). Note that the SpeX data were taken in the cross-dispersed mode, and thus are free from seeing and aperture effects (see Riffel, Rodríguez-Ardila, & Pastoriza, 2006a, for details). The comparison between both spectra is shown in Fig. 4. It is clear that our NIFS spectra have a reliable flux calibration. In fact the difference between the NIFS and SpeX spectra is lower than 3% in the band. In addiditon, we have performed a simulation varying the flux of the band by 20% (from 90% up to 110%) and the difference to the population vector components is, in mean, 5% indicating that our results are robust.
5 Discussion
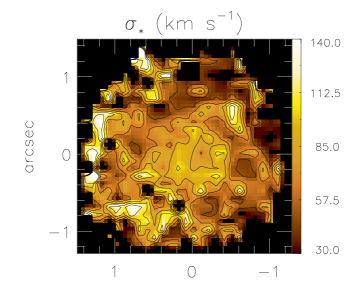
In general, our results are similar to those obtained in the 2D mapping of the SP of Mrk 1066 (Riffel et al., 2010b) as well as for previous NIR studies using single aperture nuclear spectra (Riffel et al., 2009d). By mapping the stellar population in 2D we can analyse the spatial variations of the SPCs in the inner few hundred parsecs of the galaxy. Further, the significance of these variations is enhanced by the comparison with the map presented in Fig. 6. This map was obtained by fitting the K-band CO absorption band-heads with the penalized Pixel Fitting (pPXF) method of Cappellari & Emsellem (2004) using as stellar template spectra those of the Gemini library of late spectral type stars observed with the Gemini Near-Infrared Spectrograph (GNIRS) IFU and NIFS (Winge, Riffel & Storchi-Bergmann, 2009). More details on the stellar kinematics of the central region of Mrk 1157 can be found in Riffel & Storchi-Bergmann(in prep.). The map shows a partial ring of low- values ( 50-60 ) surrounding the nucleus at 08 (230 pc) from it, immersed in higher values of the bulge stars ( 100 ).
Such rings are commonly observed in the central region of active galaxies and are due to kinematically colder regions with younger stars than the underlying bulge (Barbosa et al., 2006; Deo, Crenshaw & Kraemer, 2006; Simões Lopes et al., 2007; Riffel et al., 2008a, 2009a). The comparison between Mrk 1157 stellar population synthesis maps (light- and mass-weighted) and the map shows that the low ring is spatially correlated with the young-intermediate age SPC, while the highest s are associated with the old component. Interestingly, very similar results were found by Riffel et al. (2010b) for Mrk 1066. Thus, the results found for Mrk 1157 and Mrk 1066 support the use of low stellar velocity dispersion as a tracer of young-intermediate age stars in the galaxy centre, thus confirming the interpretation of the above studies.
The most compressed form to represent the SPCs mixture of a galaxy is by its mean stellar age, which was defined by Cid Fernandes et al. (2005b) in two ways: the first is weighted by light fraction,
| (5) |
and the second, weighted by the stellar mass,
| (6) |
Being both definitions limited by the age range used in our base, the former is more representative of the younger ages while the latter is enhanced by the old SPC (Riffel et al., 2009d). In order to compare our results with those derived using integrated spectra we have calculated the mean ages for the central region of Mrk 1157. These mean ages in light- and mass-fractions are = 8.48 = 8.65, respectively. Note that these values were obtained taking the mean value over all the spectra in the map (e.g. summing values over the map and dividing the result by the number of spectra in the map).
Besides our study of Mrk 1066 (Riffel et al., 2010b), to date, the only previous 2D stellar population studies of active galaxies in the NIR are those from the group of R. I. Davies. Davies et al. (2007) investigated the circumnuclear star formation in nine Seyfert galaxies using the NIR adaptive optics integral field spectrograph sinfoni at the Very Large Telescope (VLT). Based on measurements of the Br emission-line equivalent width, supernova rate and mass-to-light ratio, these authors found circumnuclear disks of typical diameters of tens of pc with a “characteristic” age in the range 10–300 Myr. Such a “characteristic” age can be associated with our mean age ( 300 Myr), thus our result for Mrk 1157 is in good agreement with those found by Davies et al. (2007) for their sample (which does not include Mrk 1157). Nevertheless, as pointed out by Riffel et al. (2010b) the methodology adopted here allowed us not only to obtain a “characteristic” age, but to also map the spatial distribution of the SPCs of different ages in the central region of a Seyfert galaxy, on the basis of NIR integral-field spectroscopy. Moreover, our results are in reasonable agreement with those of Riffel et al. (2009d) where the authors use integrated long-slit spectroscopy (considering the different apertures).
In further support to the results of the synthesis, we found that the average reddening map derived for the stellar population (Fig. 7) is in close agreement with the one derived for the narrow-line region using emission-line ratios (Riffel & Storchi-Bergmann, in prep.), presenting a similar structure and a very similar average value to that found by Riffel et al. (2009d, E(B-V)0.63) for the SP, using NIR integrated spectra.
6 Conclusions
As part of an ongoing project aimed at mapping the age distribution of the NIR SP in the inner few hundred parsecs of Seyfert galaxies, we present the spectral synthesis for the nuclear region of the Seyfert 2 galaxy Mrk 1157 (NGC 591) within the inner 400 pc at spatial resolution of 35 pc. We have used a cleaning method which allowed us to remove the noise effects and redundant data from the 1D extractions, thus allowing a more accurate analysis of the SPCs. Using the noise free cube we have mapped the distribution of stellar population components of different ages and of their average reddening. The main conclusions of this work are:
-
•
The cleaning technique presented here has allowed us to perform the spectral synthesis in noisy spectra (e.g. borders of the datacube) in a more accurate way.
-
•
The age of the dominant stellar population presents spatial variations: the flux and mass contributions within the inner 160 pc are dominated by old stars (5 Gyr), while intermediate age stars ( Gyr) dominate in the circumnuclear region between 170 pc and 350pc.
-
•
As for Mrk 1066 (Riffel et al., 2010b), we found that there is a spatial correlation between the distribution of the intermediate age component and low stellar velocity dispersion values, which delineate a partial ring around the nucleus of Mrk 1157. Similar structures have been found around other active nuclei, and our results for Mrk 1157 (and Mrk 1066) reveals that these nuclear rings are formed by intermediate age stars.
-
•
No signatures of non-thermal and hot dust components are found in central region of Mrk 1157.
Acknowledgments
We thank an anonymous referee for helpful suggestions. The starlight project is supported by the Brazilian agencies CNPq, CAPES and FAPESP and by the France-Brazil CAPES/Cofecub program. This work is based on observations obtained at the Gemini Observatory, which is operated by the Association of Universities for Research in Astronomy, Inc., under a cooperative agreement with the NSF on behalf of the Gemini partnership: the National Science Foundation (United States), the Science and Technology Facilities Council (United Kingdom), the National Research Council (Canada), CONICYT (Chile), the Australian Research Council (Australia), Ministério da Ciência e Tecnologia (Brazil) and south-eastCYT (Argentina). This research has made use of the NASA/IPAC Extragalactic Database (NED) which is operated by the Jet Propulsion Laboratory, California Institute of Technology, under contract with the National Aeronautics and Space Administration. This work has been partially supported by the Brazilian institution CNPq.
References
- Asari et al. (2007) Asari, N. V., Cid Fernandes, R., Stasińska, G., Torres-Papaqui, J. P., Mateus, A., Sodré, L., Schoenell, W., Gomes, J. M., 2007, MNRAS, 381, 263
- Barbosa et al. (2006) Barbosa, F. K. B., Storchi-Bergmann, T., Cid Fernandes, R., Winge, C., & Schmitt, H. 2006, MNRAS, 371, 170.
- Black & van Dishoeck (1987) Black, J. H., & van Dishoeck, E. F. 1987, ApJ, 322, 412.
- Bruzual & Charlot (2003) Bruzual, G. & Charlot, S., 2003, MNRAS, 344, 1000
- Cardelli, Clayton & Mathis (1989) Cardelli,J. A., Clayton, G. C. & Mathis, J. S., 1989, ApJ, 345,245.
- Cappellari & Emsellem (2004) Cappellari, M., Emsellem, E. 2004, PASP, 116, 138.
- Cid Fernandes et al. (2004) Cid Fernandes, R., Gu, Q., Melnick, J., Terlevich, E., Terlevich, R., Kunth, D., Rodrigues Lacerda, R., Joguet, B., 2004, MNRAS, 355, 273
- Cid Fernandes et al. (2005a) Cid Fernandes, R., Mateus, A., Sodré, Laerte, Stasińska, G., Gomes, J. M., 2005a, MNRAS, 358, 363.
- Cid Fernandes et al. (2005b) Cid Fernandes, R., González Delgado, R. M., Storchi-Bergmann, T., Martins, L. Pires & Schmitt, H., 2005b, MNRAS, 356,270.
- Cid Fernandes et al. (2008) Cid Fernandes, R., Schoenell, W., Gomes, J. M., Asari, N V., Schlickmann, M., Mateus, A., Stasinska, G., Sodre, L., Torres-Papaqui, J. P., for the SEAGal collaboration, 2008, arXiv:0802.0849
- Deo, Crenshaw & Kraemer (2006) Deo, R. P., Crenshaw, D. M. & Kraemer, S. B., 2006, AJ, 132, 321.
- Davies et al. (2005) Davies, R. I., I., Sternberg, A., Lehnert, M. D., & Tacconi-Garman, L. E., 2005, ApJ, 633, 105.
- Davies et al. (2006) Davies, R. I. et al. ApJ, 646, 754.
- Davies et al. (2007) Davies, R. I., Sánchez, F. M., Genzel, R., Tacconi, L. J., Hicks, E. K. S., Friedrich, S., & Sternberg, A. ApJ, 671, 1388
- Dors et al. (2008) Dors, O. L., Jr., Storchi-Bergmann, T., Riffel, R. A., Schimdt, Alex. A., 2008, A&A, 482, 59
- Dopita & Sutherland (1995) Dopita, M. A., & Sutherland, R. S. 1995, ApJ, 455, 468.
- Dopita & Sutherland (1996) Dopita, M. A., & Sutherland, R. S. 1996, ApJS, 102, 161.
- Emsellem et al. (2004) Emsellem, E. et al., 2004, MNRAS, 352, 721.
- Forbes & Ward (1993) Forbes, D. A. & Ward, M. J. 1993, ApJ, 416, 150.
- Ganda et al. (2006) Ganda, K., Falcón-Barroso, J., Peletier, R. F., Cappellari, M., Emsellem, E., McDermid, R. M., de Zeeuw, P. T., Carollo, C. M., 2006, MNRAS, 367, 46.
- González-Delgado et al. (2001) González Delgado, R. M., Heckman, T. & Leitherer, C., 2001, ApJ, 546, 845
- Heckman et al. (1997) Heckman, T. M., González Delgado, R. M., Leitherer, C., Meurer, G. R., Krolik, J., Wilson, A. S., Koratkar, A., Kinney, A. 1997, ApJ, 482, 114.
- Heckman (2004) Heckman, T. M., in Ho L. ed, Co-evolution of Black Holes and Galaxies, from the Carnegie Observatories Centennial Symposia. Carnegie Observatories Astrophysics Series. Cambridge University Press, Cambridge, pg. 358.
- Hicks et al. (2009) Hicks, E. K. S., Davies, R. I., Malkan, M. A., Genzel, R., Tacconi, L. J.; Sánchez, F. M., Sternberg, A., 2009, ApJ, 696, 448.
- Hollenbach & McKee (1989) Hollenbach, D., & McKee, C. F., 1989, ApJ, 342, 306.
- Larkin et al. (1998) Larkin, J. E., Armus, L., Knop, R. A., Soifer, B. T., & Matthews, K., 1998, ApJS, 114, 59.
- Mallat (1999) Mallat, Stephane,1999, A Wavelet Tour of Signal Processing, Second Edition, Academic Press.
- Malkan, Gorjian & Tam (1998) Malkan, M. A., Gorjian, V. & Tam, R., 1998, ApJS, 117,25.
- Maloney, Hollenbach & Tielens (1996) Maloney, P. R., Hollenbach, D. J., & Tielens, A. G. G. M., 1996, ApJ, 466, 561.
- Maraston (2005) Maraston, C., 2005, MNRAS, 362, 799 (M05).
- Martins et al. (2010) Martins, L.; Riffel, R.; Rodríıguez-Ardila, A.; Gruenwald, R.; de Souza, R., 2010, MNRAS, 406, 2185.
- Mateus et al. (2006) Mateus, A., Sodré, L., Cid Fernandes, R., Stasińska, G., Schoenell, W., Gomes, J. M., 2006, MNRAS, 370, 721
- Mazzalay, Rodríguez-Ardila & Komossa (2010) Mazzalay, X., Rodríguez-Ardila, A., & Komossa, S., 2010, MNRAS, 405, 1315.
- McGregor et al. (2003) McGregor, P. J. et al., 2003, Proceedings of the SPIE, 4841, 1581.
- Moran et al. (2000) Moran, E. C., Barth, A. J., Kay, L. E., & Filippenko, A. V., 2000, ApJ, 540, L73.
- Mouri (1994) Mouri, H. 1994, ApJ, 427, 777.
- Mulchaey, Wilson & Tsvetanov (1996) Mulchaey, J. S., Wilson, A. S., & Tsvetanov, Z., 1996, ApJS, 102, 309.
- Nagar et al. (1999) Nagar, N. M., Wilson, A. S., Mulchaey, J. S. & Gallimore, J. F., 1999, ApJS, 120, 209.
- Norman & Scoville (1988) Norman C., Scoville N., 1988, ApJ, 332, 124.
- Osterbrock & Ferland (2006) Osterbrock, D. E. & Ferland, G. J., 2006, Astrophysics of Gaseous Nebulae and Active Galactic Nuclei, Second Edition, University Science Books, Mill Valley, California.
- Oliva et al. (2001) Oliva, E. et al. 2001, A&A, 369, L5.
- Quillen et al. (1999) Quillen, A. C., Alonso-Herrero, A., Rieke, M. J., Rieke, G. H., Ruiz, M., & Kulkarni, V. 1999, ApJ, 527,
- Ramos Almeida, Pérez García & Acosta-Pulido (2009) Ramos Almeida, C., Pérez García, A. M., & Acosta-Pulido, J. A., 2009, ApJ, 694, 1379.
- Reunanen, Kotilainen & Prieto (2002) Reunanen, J., Kotilainen, J. K., & Prieto, M. A., 2002, MNRAS, 331, 154.
- Rodríguez-Ardila et al. (2004) Rodríguez-Ardila, A., Pastoriza, M. G., Viegas, S., Sigut, T. A. A., & Pradhan, A. K., 2004, A&A, 425, 457.
- Rodríguez-Ardila, Riffel & Pastoriza (2005) Rodríguez-Ardila, A., Riffel, R., & Pastoriza, M. G. 2005, MNRAS, 364, 1041.
- Rodríguez-Ardila et al. (2006) Rodríguez-Ardila, A., Prieto, M. A., Viegas, S. & Gruenwald, R. 2006, ApJ, 653, 1098.
- Riffel, Rodríguez-Ardila, & Pastoriza (2006a) Riffel, R., Rodríguez-Ardila, A. & Pastoriza, M. G., 2006a, A&A, 457, 61.
- Riffel et al. (2006b) Riffel, Rogemar A., Sorchi-Bergmann, T., Winge, C., Barbosa, F. K. B., 2006b, MNRAS, 373, 2.
- Riffel et al. (2007) Riffel, R., Pastoriza, M. G., Rodríguez-Ardila, A., & Maraston, C., 2007, ApJ, 659, 103.
- Riffel et al. (2008a) Riffel, Rogemar A., Storchi-Bergmann, T., Winge, C., McGregor, P. J., Beck, T., Schmitt, H. 2008a, MNRAS, 385, 1129.
- Riffel et al. (2008b) Riffel, R., Pastoriza, M. G., Rodríguez-Ardila, A. & C. Maraston, 2008b, MNRAS, 388, 803.
- Riffel et al. (2009a) Riffel, Rogemar A., Storchi-Bergmann, T., Dors, O. L., Winge, C., 2009a, MNRAS, 393, 783.
- Riffel et al. (2009b) Riffel, Rogemar A., Storchi-Bergmann, T., McGregor, P. J. 2009b, ApJ, 698, 1767.
- Riffel et al. (2009c) Riffel, Rogemar A., Storchi-Bergmann, T., Dors, O. L., & Winge, C., 2009c, MNRAS, 393, 783.
- Riffel et al. (2009d) Riffel, R.; Pastoriza, M. G.; Rodríıguez-Ardila, A. & Bonatto, C., 2009d, MNRAS, 400, 273.
- Riffel, Storchi-Bergmann & Nagar (2010a) Riffel, Rogemar A., Storchi-Bergmann, T. & Nagar, N. M., 2010a, MNRAS, 404, 166.
- Riffel et al. (2010b) Riffel, Rogemar A., Storchi-Bergmann, T., Riffel, R., & Pastoriza, M. G., 2010b, ApJ, 713, 469.
- Riffel et al. (2010c) Riffel, R.; Bonatto, C.; Cid Fernandes, R.; Pastoriza, M. G.; Balbinot, E., 2010c, MNRAS,tmp, 1806
- Riffel & Storchi-Bergmann (2010d) Riffel, Rogemar A. & Storchi-Bergmann, T., 2010d, arXiv:1009.4832.
- Sánchez et al. (2009) Sánchez, F. M., Davies, R. I., Genzel, R., Tacconi, L. J., Eisenhauer, F., Hicks, E. K. S., Friedrich, S., & Sternberg, A., 2009, ApJ, 691, 749.
- Simões Lopes et al. (2007) Simões Lopes, R. D., Storchi-Bergmann, T., de Fátima Saraiva, M., & Martini, P., 2007, ApJ, 655, 718.
- Simpson et al. (1996) Simpson, C., Forbes, D. A., Baker, A. C., & Ward, M. J. 1996, MNRAS, 283, 777.
- Springob et al. (2005) Springob, C. M., Haynes, M. P., Giovanelli, R., & Kent, B. R., 2005, ApJS, 160, 149.
- Starck & Murtagh (2006) Starck, J. L., Murtagh, F.,2006, Astronomical Image and Data Analysis, Springer; 2nd edition.
- Steiner et al. (2009) Steiner, J. E.; Menezes, R. B.; Ricci, T. V.; Oliveira, A. S., 2009, MNRAS, 395, 64.
- Storchi-Bergmann et al. (2000) Storchi-Bergmann, T., Raimann, D., Bica, E. L. D., Fraquelli, H. A., 2000, ApJ, 544, 747.
- Storchi-Bergmann et al. (2009) Storchi-Bergmann, T., McGregor, P. Riffel, Rogemar A., Simões Lopes, R., Beck, T., Dopita, M., 2009, MNRAS, 394, 1148.
- Storchi-Bergmann et al. (2010) Storchi-Bergmann, T., Simões Lopes, R., McGregor, P. Riffel, Rogemar A., Beck, T., Martini, P., 2010, MNRAS, 402, 819.
- Storchi-Bergmann et al. (2001) Storchi-Bergmann, T., González Delgado, R., Schmitt, H., Cid Fernandes, R., Heckman, T., 2001, ApJ, 559, 147.
- Terlevich et al. (1990) Terlevich E., Diaz A.I., Terlevich R., 1990, MNRAS, 242, 271.
- Ulvestad & Wilson (1989) Ulvestad, J. S., & Wilson, A. S., 1989, ApJ, 343, 659.
- Veilleux, Goodrich & Wilson (1997) Veilleux, S. A., Goodrich, R. W., & Hill, G. J. 1997, ApJ, 477, 631.
- Véron-Cetty & Veron (2001) Véron-Cetty, M. P., & Véron, P., 2001, A&A, 374, 92.
- Wilman, Edge & Juhnstone (2005) Wilman, R. J., Edge, A. C., & Juhnstone, R. M., 2005, MNRAS, 359, 755.
- Winge, Riffel & Storchi-Bergmann (2009) Winge, C., Riffel, Rogemar A., Storchi-Bergmann, T., 2009, ApJS, 185, 186.