EVLA observations of a proto-cluster of molecular gas rich galaxies at
Abstract
We present observations of the molecular gas in the GN20 proto-cluster of galaxies at using the Expanded Very Large Array (EVLA). This group of galaxies is the ideal laboratory for studying the formation of massive galaxies via luminous, gas-rich starbursts within 1.6 Gyr of the Big Bang. We detect three galaxies in the proto-cluster in CO 2-1 emission, with gas masses (H2) between and M⊙. The emission from the brightest source, GN20, is resolved with a size , and has a clear north-south velocity gradient, possibly indicating ordered rotation. The gas mass in GN20 is comparable to the stellar mass ( M⊙ and M⊙, respectively), and the sum of gas plus stellar mass is comparable to the dynamical mass of the system ( M⊙), within a 5kpc radius. There is also evidence for a tidal tail extending another north of the galaxy with a narrow velocity dispersion. GN20 may be a massive, gas rich disk that is gravitationally disturbed, but not completely disrupted. There is one Lyman-break galaxy (BD29079) in the GN20 proto-cluster with an optical spectroscopic redshift within our search volume, and we set a 3 limit to the molecular gas mass of this galaxy of M⊙.
1 Introduction
Numerous lines of evidence support the hypothesis that massive elliptical galaxies form the majority of their stars quickly at early epochs, including: stellar population synthesis studies of nearby elliptical galaxies (Renzini 2006; Collins et al. 2009), a faster decline with cosmic time in the star formation rate per unit stellar mass with increasing galaxy mass (Moresco et al. 2010), and the direct observation of ‘red and dead’ ellipticals in clusters at high redshift (Kurk et al. 2009; Doherty et al. 2009; Andreon & Huertas-Company 2011). Plausible progenitors for these evolved galaxies at high redshift are even higher redshift submm galaxies (SMGs), corresponding to dusty, luminous starburst galaxies found in wide-field submm surveys (Blain et al. 2002). These hyper-luminous high-z galaxies may trace high over-densities, and are likely related to the formation of clusters and large ellipticals (Stevens et al. 2003; Aravena et al. 2010; although cf. Chapman et al. 2009; Williams et al. 2011). While the space density of SMGs peaks around (Chapman et al. 2003), it is becoming clear that there is a substantial high-redshift tail of the SMG population, extending to (Capak et al. 2011, Riechers et al. 2010; Wardlow et al. 2011). Daddi et al. (2009a) conclude, based on SMG space densities and duty cycles, that there are likely enough SMGs at to account for the known populations of old massive galaxies at to 3.
A key question for the SMGs is: what drives the prolific star formation? Tacconi et al. (2006; 2008) argue, based on imaging of higher-order CO emission from a sample of SMGs, that SMGs are predominantly nuclear starbursts, with median sizes (kpc), ‘representing extreme, short-lived, maximum star forming events in highly dissipative mergers of gas rich galaxies.’ This conclusion is supported by VLBI imaging of the star forming regions in two SMGs (Momjian et al. 2005; 2010). However, recent imaging of the lower order CO emission in a few SMGs (Ivison et al. 2010; Carilli et al. 2010; Riechers et al. 2011 in press), suggests that the lower-excitation molecular gas reservoirs can be significantly more extended.
Daddi et al. (2009a) have identified a unique region in GOODS-N, containing the three galaxies: GN20, GN20.2a, and GN20.2b, at , within 20′′ of each other (projected physical separation = 140 kpc). GN20 is among the brightest submm galaxies known, with a 350 GHz flux density of 23mJy. The galaxies GN20.2a and b are separated by only a few arcseconds, and hence are not spatially distinct in typical submm bolometer images. The two galaxies have a summed flux density of mJy. The implied IR luminosities (8 to 1000m) are L⊙, with star formation rates are M⊙ yr-1 (Daddi et al. 2009a). High order CO emission (4-3 and/or 6-5) has been detected from all three galaxies, although only marginally in the case of GN20.2b (Daddi et al. 2009a).
The GN20 field also contains numerous Lyman Break Galaxies (LBGs) at similar redshift, and an overdensity of IRAC selected galaxies (Daddi et al. 2009a). Hence, this field offers an unprecedented opportunity to perform a definitive study of the gas distribution, kinematics, and physical conditions in a proto-cluster of galaxies within 1.6 Gyr of the Big Bang. In this paper we present a survey with the Expanded Very Large Array (EVLA; Perley et al. 2011), of the CO 2-1 emission from the GN20 proto-cluster. The low order transitions are critical for determining the total gas mass. We also search for CO emission from other galaxies in the cosmic volume surveyed.
2 The GN20 proto-cluster: a massive galaxy formation laboratory
The HST I-band image of the bright SMG GN20 shows diffuse emission about 1.5 in extent (Daddi et al. 2009a), although offset from the radio and submm emission by , implying high obscuration of the most active star forming regions in the galaxy. GN20 is detected at 1.4 GHz, and resolved on a scale of , with a total flux density at Jy (Morrison et al. 2010; Casey et al. 2009). High resolution imaging of the 850m emission shows resolved structure, with a north-south extension possibly as large at 1.5 (Younger et al. 2008; Iono et al. 2006). The 6.2m PAH spectral feature has been detected in GN20 using Spitzer (Riechers et al. in prep). The integrated CO 1-0 and 2-1 emission from GN20 has been imaged at resolutions down to with the VLA (Carilli et al. 2010). The molecular gas is extended on a scale of at least 1.5, and at high resolution forms a partial ring, or disk. Unfortunately, the old VLA correlator provided no velocity information. The excitation of the integrated CO emission from GN20 is higher than the Milky Way, but lower than high redshift quasar hosts and the nuclear starburst regions of IR-luminous galaxies. The CO 4-3 line strength in GN20 is more than a factor of two lower than expected for thermal excitation (Carilli et al. 2010).
GN20.2a shows a complex and extended morphology in the HST images (Daddi et al. 2009a), and it is a relatively strong radio source (Jy), likely corresponding to a radio AGN. The SED in the optical through near-IR is consistent with a star forming galaxy. GN20.2a has been detected in CO 4-3 emission by Daddi et al. (2009a). Daddi et al. derive an IR luminosity (8 to 1000m) of L⊙.
GN20.2b is faint and compact in the HST image. It is also detected in the radio continuum at Jy, consistent with star formation. CO 4-3 emission is marginally detected with the Plateau de Bure Interferometer, and appears to be broad (700 km s-1; Daddi et al. 2009a).
Daddi et al. (2009a) find 15 B-band dropout galaxies in a 25′′ radius centered on GN20, an overdensity of a factor of 6 compared to the full GOODS-N area, which is significant at the 7 level. A spike in the redshift distribution of galaxies at is observed in all of GOODS-N (13 spectroscopic redshifts in total at this redshift). Lastly, the SMG GN10 at is located 9′ from GN20 (Daddi et al. 2009b; Dannerbauer et al. 2008). Therefore, it appears that the GN20 volume has a very significant overdensity, indicating a proto-cluster environment at . Daddi et al. (2009a) estimate a total mass for this structure of M⊙.
3 Observations
We observed the GN20 field with the Expanded Very Large Array in the D (1km) configuration in March and April, 2010. Observations were made of the CO 2-1 line, using a total bandwidth of 246 MHz and in each of two polarizations, centered at 45.655 GHz. The velocity coverage is 1600 km s-1, including the CO 2-1 lines in the three galaxies. The total observing time was 28 hours, but only about 22 to 24 antennas were available at a time due to on-going EVLA work.
Dynamic scheduling to ensure good weather is now standard at the EVLA. Fast switching phase calibration was employed (Carilli & Holdaway 1999) on timescales between two and three minutes using the VLA calibrator J1302+5748. Data were edited to remove time ranges of poor phase stability. The source 3C286 was used for flux density calibration. Standard EVLA data calibration and editing was performed using AIPS. After calibration and data editing, images were synthesized using the robust weighting scheme of the uv data with R=2 (Cornwell et al. 1999).
The final resolution for the images was . Spectral line cubes were generated at 12MHz per channel (78 km s-1). The rms noise per channel at 12MHz resolution is 0.11 mJy beam-1. All images were corrected for the VLA primary beam response, which has a FWHM at 45 GHz. The field pointing center was located west of GN20.
4 Results
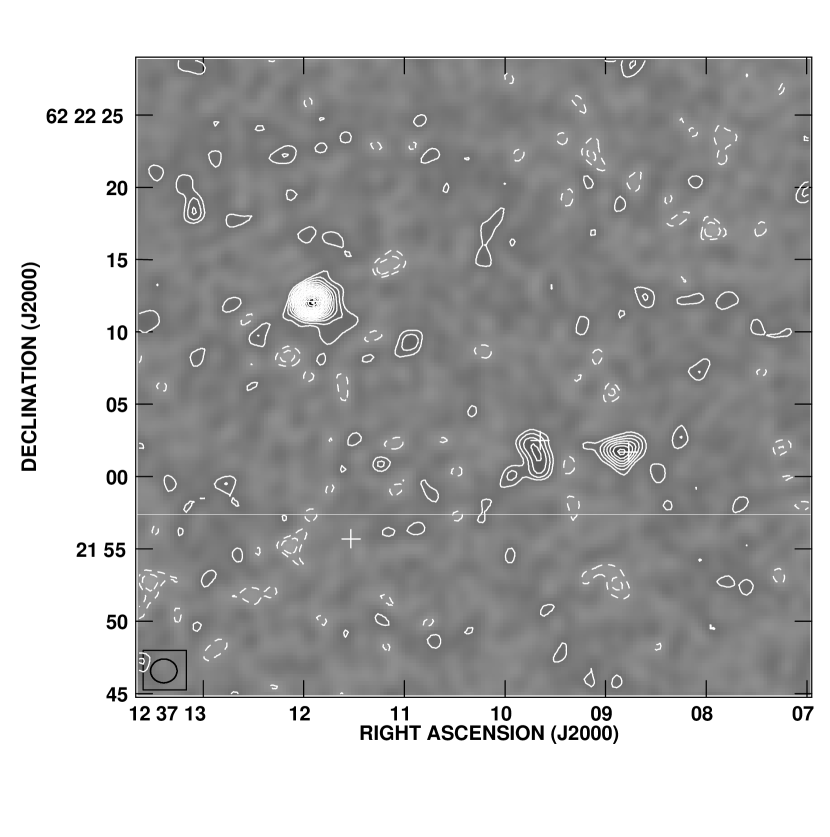
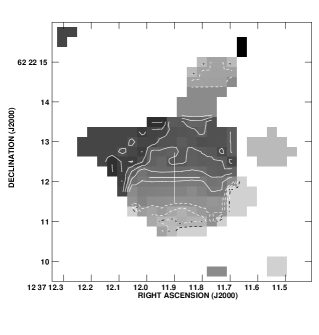
Figure 1 shows the CO 2-1 emission integrated over the full frequency range covered by these observations for the GN20 group. The crosses mark the 1.4 GHz continuum positions of the three galaxies GN20, 20.2a,b (Morrison et al. 2010), and the optical position of one LBG with a spectoscopic redshift in the redshift range of the CO 2-1 observations (Section 5.2). We have added the previously published D array observations (Carilli et al. 2010) to improve signal-to-noise. Unfortunately, the previous data did not have the exact same velocity coverage, and hence the velocity-integrated flux densities are not accurate. Hence, this image acts as a finding chart for the CO emitting regions, but accurate line fluxes will be based on subsequent analysis of the new EVLA data itself.
We detect CO 2-1 emission from GN20, GN20.2a, and GN20.2b. GN20 is extended on a scale (see below). GN20.2a is not spatially resolved by these observations. GN20.2b may be extended, although the signal-to-noise of these data are not conclusive.
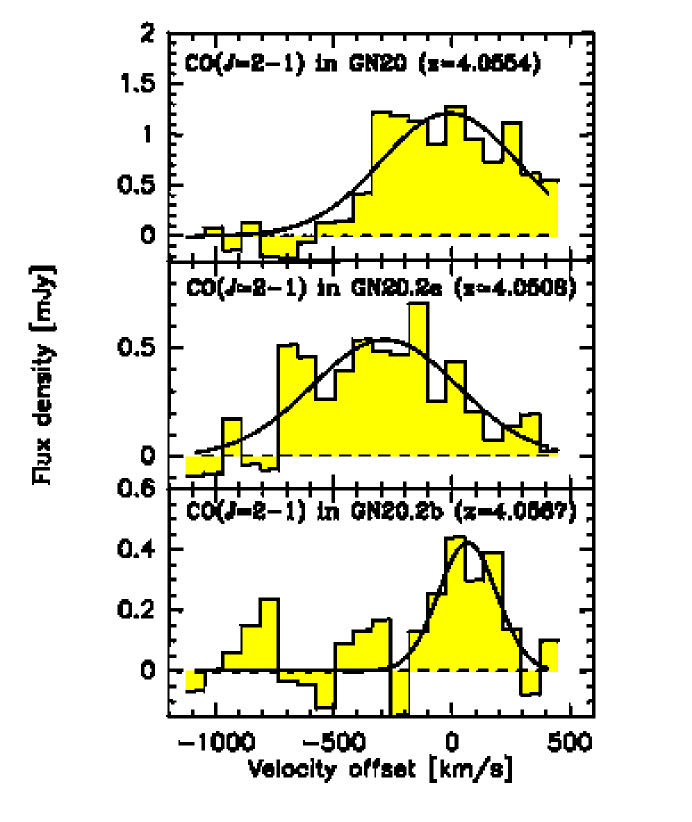
Figure 2 shows spectra of the three sources. For GN20, we integrate over an area of . For the other two sources we only consider the spectra at the peak of the velocity integrated CO image. Results for Gaussian fits to the lines are given in Table 1. The lines are broad for GN20 and GN20.2a ( km s-1), although not outside the range of the zero intesity line widths seen in some nearby ULIRGs (Downes & Solomon 1998). However, we note athat, due to the bandwidth limitation for the early EVLA, the very lowest frequency (highest velocity) emission for GN20 may be truncated by these observations, although the higher order CO transitions show that we expect little emission beyond our lowest spectral channel (Daddi et al. 2009a). GN20.2b shows a narrower profile at the peak position. However, the detection in the velocity integrated image over the full frequency range (Figure 1), suggests that the emission may be extended both spatially and spectrally. A possibly broader line is also suggested for the higher order CO emission, but again, the high order CO detection is only marginal (Daddi et al 2009a). We have investigated this possibility with the current data, and conclude that more sensitive observations are required to better characterize the CO emission from GN20.2b, and we simply present the spectrum at the peak position herein.
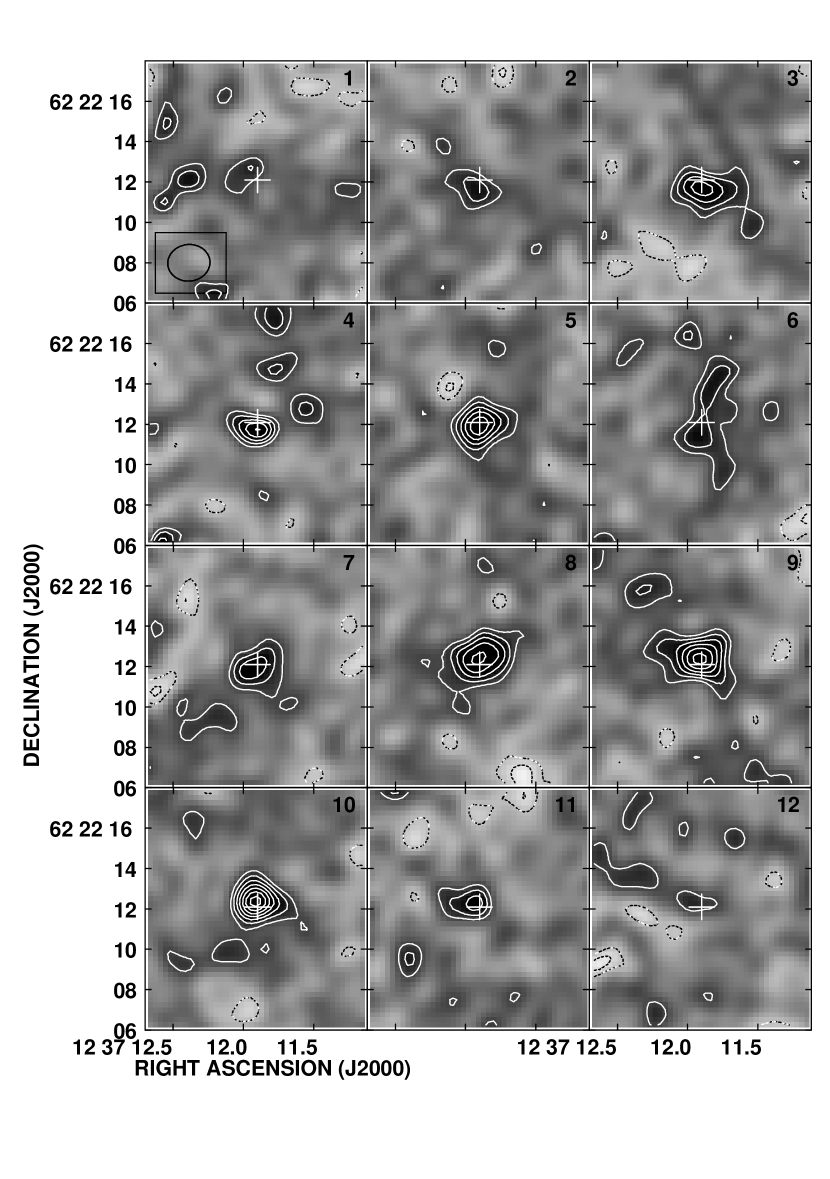
Figure 3 shows the velocity channel images for the GN20 CO 2-1 emission at 78 km s-1 channel-1 and resolution. The emission clearly moves from the south to the north with increasing frequency. An interesting feature is seen in channel 6, corresponding to a frequency of 45.598 GHz (or ). The emission in channel 6 appears to be substantially more extended than in other channels. Inspecting our bandpass calibration, we find no channel-dependent calibration errors that would lead to such a difference in morphology for this single channel. In channel 6 the emission extends well to the north, with a total of extent of . Admittedly, the signal-to-noise is not high, but this extended emission is suggestive of a gravitationally induced tidal feature. Such tidal tails in nearby galaxies often occur over a narrow velocity range (Hibbard & Mihos 1995).
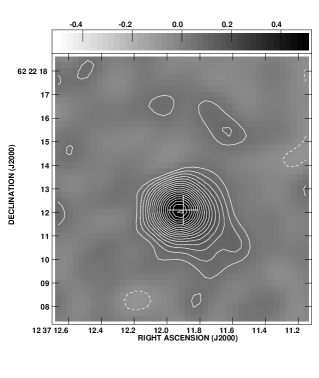
Figure 4a shows the CO 2-1 emission from GN20 integrated over the velocity range shown in the channel maps of Figure 3. The emission appears extended, in particular to the southwest. A formal Gaussian fit to the emission yields a total flux density of mJy, a peak surface brightness of Jy beam-1, and a deconvolved source size of with major axis position angle PA = 69o. Figure 4b shows the iso-velocity contours (first moment) of the CO 2-1 emission, ie. the weighted mean velocity derived after first blanking the channel images below 3 per channel. There is a velocity gradient north-south, with a magnitude of km s-1. Given the low spatial resolution of these images, this corresponds to a lower limit to the true projected rotational velocity.
5 Analysis
5.1 Masses
We derive the mass in molecular gas (H2) from the observed CO 2-1 luminosities using the standard relationships in Solomon & Vanden Bout (2005). We extrapolate from CO 2-1 to 1-0 luminosity assuming constant brightness temperature, which is certainly correct to within 10% for these galaxies (Carilli et al. 2010). We adopt a CO luminosity to H2 conversion factor of M⊙ K km s-1 pc2, appropriate for nearby nuclear starburst galaxies (Downes & Solomon 1998). The resulting values are listed in Table 1.
Admittedly, the uncertainty on is significant. A minimum gas mass can be derived assuming optically thin emission, and adopting a temperature and a CO to H2 abundance ratio. Ivison et al. (2010) show that for reasonable assumptions (Galactic CO abundance in molecular clouds, and temperatures 40 K to 50 K), the lower limit to (see also Aalto et al. 1995).
The gas mass in GN20 is M⊙. Daddi et al. (2009a) derive a stellar mass of M⊙ from IR through optical SED fitting.
We can obtain a very rough estimate of the gravitational mass of GN20 from the CO velocity field, although there are substantial uncertainties due to the low spatial resolution of these observations. For the rotational velocity, we adopt the extremes of the velocity channels with significant emission in Figure 3, or km s-1. For the radius, we adopt the value for the CO ring seen in the high resolution 2-1 observations presented in Carilli et al. (2010), kpc. The inclination angle remains uncertain. The gravitational mass inside this radius is M⊙. This naively derived dynamical mass is comparable to the sum of the stellar and gas masses.
5.2 Lyman-break galaxy molecular mass limits
There is one Lyman-break galaxy within our field with a spectroscopic redshift placing the CO 2-1 line within our band: J123711.48+622155.8 at (BD29079; Daddi et al. 2009a; Shim et al. 2011). We find no CO emission from this galaxy, to a limit of 0.17 mJy beam-1 at 78 km s-1 channel-1, after primary beam correction. Convolving to 312 km s-1, we set a 3 limit to the CO 1-0 luminosity of , assuming constant brightness temperature from CO 2-1 to 1-0. The implied molecular gas mass of this galaxy is M⊙. The stellar mass of this galaxy is M⊙ (Daddi et al. 2009a), hence the gas-to-stellar mass ratio is .
Daddi et al. (2009a) estimate a star formation rate of 150 M⊙ year-1 for BD29079, or an IR luminosity of L⊙. Daddi et al. (2010) have considered the ’star formation law’ in high galaxies, ie. the relationship between IR luminosity and CO luminosity, and find for galaxies of this luminosity at : . Adopting this relation implies an expected CO luminosity of L⊙. Hence, BD29079 is under-luminous in CO emission relative to the standard star formation law, although within the broad (factor three) scatter at any given luminosity.
There are 11 other LBGs within our field, and with photometric redshifts that are consistent with the sampled range, although the error bars are such that the galaxies could be outside the velocity range of the CO observations. We have looked for CO emission at all these positions, and find no significant detections to similar limits to those quoted above.
We emphasize that there is a large uncertainty in the derived H2 mass for the LBGs, due to the unknown conversion factor, . It is possible that metal poor star forming galaxies have a much larger value of than ULIRGs or even the Milky Way due to CO dissociation by the more pervasive UV radiation field (Madden et al. 1997; Papadopoulos & Pelupessy 2010).
6 Discussion
We have detected CO 2-1 emission from three galaxies in the GN20 proto-cluster at using the EVLA. The molecular gas masses range from M⊙ to M⊙. Hence, we are observing a group of molecular gas rich galaxies undergoing extreme starburts within 1.6 Gyr of the Big Bang.
GN20 presents a particularly interesting case, given its very high luminosity, and large spatial extent. We find that the sum of the stellar and gas mass in GN20 is comparable to the dynamical mass. While the assumptions involved in all three mass calculations are uncertain, it appears that the baryons likely dominate the mass content within 5 kpc radius of GN20. Moreover, their is little room for a CO luminosity to gas mass conversion factor substantially larger than 0.8 M⊙ K km s-1 pc2. High resolution observations are required to confirm the rotational aspect of the emission, and to obtain a more accurate derivation of the dynamical mass.
The morphology and velocity field for GN20 suggest a rotating disk, with a possible tidal tail extending 10kpc to the north in a single 78 km s-1 channel. We can speculate that GN20 is a gas rich disk galaxy that has been gravitationally torqued by its neighboring galaxies. This gravitational disturbance has not distrupted the disk, but has greatly enhanced star formation in the disk, as well as generating the extended, tidal gas distribution.
Lastly, we have searched for CO emission from LBGs in the GN20 protocluster. We set an upper limit of M⊙ to the molecular gas mass in these galaxies, including one with an accurate spectroscopic redshift. Our limit is below the expected value based on the standard star formation law at this redshift, but within the broad scatter.
We are obtaining high resolution CO imaging observations of the GN20 proto-cluster with the EVLA and the Plateau de Bure interferometer to perform a more detailed dynamical analysis, and study the spatial distribution of the CO excitation and gas-to-dust ratio of this forming cluster of massive galaxies at .
| Source | Redshift | Peak | FWHM | ICO | Velocitya | L’CO | M(H2) |
|---|---|---|---|---|---|---|---|
| mJy | km s-1 | Jy km s-1 | km s-1 | K km s-1 pc2 | M⊙ | ||
| GN20 | 4.0554 | 1.210.11 | 67988 | 0.870.088 | -1132 | ||
| GN20.2a | 4.0508 | 0.540.065 | 723110 | 0.410.050 | -28345 | ||
| GN20.2b | 4.0567 | 0.420.083 | 29070 | 0.130.025 | 6729 |
aVelocity relative to .
Aalto, S. et al. 1995, A& A, 300, 369
Andreon, S. & Huertas-Company, M. 2011, A& A, 526, 11
Aravena, M., Bertoldi, F., Carilli, C. et al. 2010, ApJL, 708, L36
Blain, A., Smail, I, Ivison, R., Kneib, J.-P., Frayer, D. 2002, PhR 369 111
Capak, P. et al. 2011, Nature, 470, 233
Carilli, C.L. & Holdaway, M. 1999, Radio Science, 34, 817
Casey, C.M., Chapman, S., Daddi, E. et al. 2009, MNRAS, in press
Chapman, S., Blain, A., Ivison, R., Smail, I. 2003 Nature 422 695
Chapman, S., Blain, A., Ibata, R. et al. 2009, ApJ, 691, 560
Collins, D., Stott, J.P., Hilton, M. et al. 2009, Nature, 458, 603
Cornwell, T., Braun, R., Briggs, D. 1999, in Synthesis Imaging in Radio Astronomy II, eds. G. B. Taylor, C. L. Carilli, and R. A. Perley (ASP: San Francisco) 180, 151
Daddi, E., Dickinson, M., Chary, R. et al 2005, ApJ 631 L13
Daddi, E., Dannerbauer, H., Stern, D. et al. 2009a, ApJ, 694, 1517
Daddi, E., Dannerbauer, H., Krips, M. et al. 2009b, ApJ, 695, L176
Daddi et al. 2010, ApJ, 714, L118
Dannerbauer, H., Walter, F., Morrison, G. 2008, ApJ, 673, L127
Downes & Solomon 1998 ApJ, 507, 615
Doherty, M., Tanaka, M., de Breuck, C. et al. 2009, A& A, 509, 83
Hibbard, J. & Mihos, C. 1995, AJ, 110, 140
Iono, D., Peck, A., Pope, A. et al. 2006, ApJ, 640, L1
Ivison, R., Papadopoulos, P, Smail, I. et al. 2010, MNRAS, 412, 1913
Kurk, J., Cimatti, A., Zamorani, G. et al. 2009, A& A, 504, 331
Madden, S., Poglitsch, A., Geiss, N. et al. 1997, 483, 200
Momjian, E., Carilli, C. & Petric, A. 2005, AJ, 129, 1809
Momjian, E. et al. 2010, AJ, 139, 1622
Moresco, M. et al. 2010, A& A, 524, 67
Morrison, G., Owen, F., Dickinson, M., Ivison, R., Ibar, E. 2010, ApJ, 188, S178
Papadopoulos, P. & Pelupessy, F. 2010, ApJ, 717, 1037
Perley, R.A. et al. 2011, ApJL, this volume
Renzini, A. 2006, ARAA, 44, 141
Riechers, D. et al. 2010, ApJL, 720, L131
Solomon & Vanden Bout 2005, ARAA, 43, 677
Stevens, J, Ivison, R., Dunlop, J. et al. 2003 Nature, 425, 264
Tacconi, L., Neri, R., Chapman, S. et al. 2006, ApJ, 640, 228
Tacconi, L., Genzel, R., Smail, I., et al. 2008, ApJ, 680, 246
Wardlow, J. et al. 2011, MNRAS, in press
Williams, C.C., Giavaisco, M., Porciani, C. et al. 2011, ApJ, in press
Younger, J., Fazio, G., Wilner, D. et al. 2008, ApJ, 688, 59