Torus and AGN properties of nearby Seyfert galaxies: Results from fitting IR spectral energy distributions and spectroscopy
Abstract
We used the CLUMPY torus models and a Bayesian approach to fit the infrared spectral energy distributions (SEDs) and ground-based high-angular resolution mid-infrared spectroscopy of 13 nearby Seyfert galaxies. This allowed us to put tight constraints on torus model parameters such as the viewing angle , the radial thickness of the torus , the angular size of the cloud distribution , and the average number of clouds along radial equatorial rays . We found that the viewing angle is not the only parameter controlling the classification of a galaxy into a type 1 or a type 2. In principle type 2s could be viewed at any viewing angle as long as there is one cloud along the line of sight. A more relevant quantity for clumpy media is the probability for an AGN photon to escape unabsorbed. In our sample, type 1s have relatively high escape probabilities, , while type 2s, as expected, tend to have very low escape probabilities. Our fits also confirmed that the tori of Seyfert galaxies are compact with torus model radii in the range 1-6 pc. The scaling of the models to the data also provided the AGN bolometric luminosities , which were found to be in good agreement with estimates from the literature. When we combined our sample of Seyfert galaxies with a sample of PG quasars from the literature to span a range of , we found plausible evidence of the receding torus. That is, there is a tendency for the torus geometrical covering factor to be lower () at high AGN luminosities than at low AGN luminosities ( at ). This is because at low AGN luminosities the tori appear to have wider angular sizes (larger ) and more clouds along radial equatorial rays. We cannot, however rule out the possibility that this is due to contamination by extended dust structures not associated with the dusty torus at low AGN luminosities, since most of these in our sample are hosted in highly inclined galaxies.
Subject headings:
galaxies: nuclei — galaxies: Seyfert — galaxies: structure — infrared: galaxies1. Introduction
The unified model for active galactic nuclei (AGN) proposes the ubiquitous presence of an obscuring torus around their nuclei, with type 1 and type 2 AGN being intrinsically similar (Antonucci 1993). The central region of an AGN (including the Broad Emission Line Region, BLR) is obscured when viewed along directions close to the equatorial plane of the torus, and it is then classified as a type 2 AGN. In type 1 AGN the viewing angle is close to the polar direction of the torus, and thus we have a direct view of the central engine. This model received strong support from the fact that broad lines have been revealed in the spectra of the polarized emission of a number of type 2 AGN (e.g., Antonucci & Miller 1985; Tran, Miller, & Kay 1992).
There is also indirect evidence of the presence of the dusty torus advocated by the unified model. First is the similarity of Seyfert 1s and Seyfert 2s with respect to a given isotropic indicator of the AGN luminosity such as, [O iii]5007, infrared (IR), hard X-ray, and radio luminosities of Seyferts (see e.g., Mulchaey et al. 1994; Alonso-Herrero, Ward, & Kotilainen 1997; Nagar et al. 1999). The UV and soft X-ray continua of Seyfert 2s, on the other hand are underluminous relative to the type 1s, because they are not transmitted through the torus. Second, the presence of “double-cone” morphology of the narrow line region (NLR) structures (e.g., Pogge 1989; Wilson & Tsvetanov 1996; Schmitt et al. 2003), with orientations similar to those of radio jets (Nagar et al. 1999 and references therein), are interpreted as emission collimated by the torus.
The role of the extinction produced by the host galaxy cannot be understated (Alonso-Herrero et al. 2003). For instance, for some Seyfert 2s broad lines are identified in the near-IR (e.g., Blanco, Ward, & Wright 1990; Ruiz, Rieke, & Schmidt 1994; Goodrich et al. 1994; Veilleux, Goodrich, & Hill 1997; Ramos Almeida, Pérez-García, & Acosta-Pulido 2009), and counter-cones are seen in direct and/or polarized near-IR light (e.g., Packham et al. 1997 for NGC 1068; Maiolino et al. 2000 for Circinus). Finally, there is the tendency of intermediate types (Seyferts 1.8+1.9) to be hosted in edge-on galaxies (Maiolino & Rieke 1995).
In recent years much progress has been made toward understanding the properties of the molecular dusty torus. From the theoretical point of view, torus models with smooth density distributions (e.g., Pier & Krolik 1993; Granato & Danese 1994; Efstathiou & Rowan-Robinson 1995) have been superseded by more complex clumpy dust distributions (e.g., Nenkova, Ivezic, & Elitzur 2002; Hönig et al. 2006; Nenkova et al. 2008a, 2008b; Schartmann et al. 2008; Hönig & Kishimoto 2010). The clumpy models reproduce well the near-IR and mid-IR emission of different types of AGN (e.g., Mason et al. 2006, 2009; Nenkova et al. 2008b; Schartmann et al. 2008; Polletta et al. 2008; Mor, Netzer, & Elitzur 2009; Thompson et al. 2009; Nikutta, Elitzur, & Lacy 2009; Ramos Almeida et al. 2009 and 2011, RA09 and RA11 hereafter; Hönig et al. 2010; Lira et al. 2011), and overcome some of the difficulties faced by smooth torus models in fitting IR data of AGN (see e.g., Alonso-Herrero et al. 2001, 2003).
From the observational point of view, mid-IR interferometric observations have revealed that the torus is relatively compact, with typical sizes of a few parsecs, geometrically thick, and with evidence of clumpiness (e.g., Jaffe et al. 2004; Tristram et al. 2007, 2009; Burtscher et al. 2009; Raban et al. 2009). Also, direct mid-IR imaging observations of Circinus gave a torus size of pc (Packham et al. 2005). In terms of their molecular gas, the tori contain , extend for tens of parsecs (typically radii of 30 pc) and have gas column densities, as derived from near-IR molecular hydrogen lines, ranging from 1 to (Davies et al. 2006; Hicks et al. 2009).
| Galaxy | z | d | Type | Ref | NH(X-ray) | Ref | Ref | Ref | Ref | |||
|---|---|---|---|---|---|---|---|---|---|---|---|---|
| Mpc | cm-2 | deg | pc | erg s-1 | ||||||||
| Circinus | 0.001448 | 4 | Sy2 | A1 | 430. | B1 | 80-90 | C1 | D1 | 43.6 | E1 | |
| IC 4329A | 0.016054 | 65 | Sy1.2 | A2 | 0.61 | B2 | – | – | 10.8 | D2 | 45.0 | E2 |
| IC 5063 | 0.011348 | 46 | Sy2 | A3 | 21.78 | B2 | 60 | C2 | – | – | 44.3-44.7 | E2 |
| MCG 5-23-16 | 0.008486 | 34 | Sy2 (broad Pa) | A4 | 1.6 | B3 | – | – | 2.8 | D2 | 44.4 | E3 |
| NGC 1068 | 0.003793 | 15 | Sy2 | A5 | B4 | 40, 65 | C3 | , | D3 | 45.0 | E4 | |
| NGC 2110 | 0.007789 | 31 | Sy2 (broad Br) | A6 | 2.84 | B2 | 30 | C4 | – | – | 43.8-43.9 | E2 |
| NGC 3227 | 0.003859 | 17 | Sy1.5 | A5 | 1.74 | B2 | 60-70 | C5 | – | – | 43.2-43.5 | E2 |
| NGC 4151 | 0.003319 | 13 | Sy1.5 | A5 | 6.9 | B5 | 67, 75 | C3 | 2 | D4 | 43.7 | E4 |
| NGC 5506 | 0.006181 | 25 | NLSy1 (broad Pa) | A4, A7 | 2.78 | B2 | 90-100 | C6 | – | D2 | 44.1-44.3 | E2 |
| NGC 7172 | 0.008683 | 35 | Sy2 | A2 | 8.19 | B2 | – | – | – | – | 43.7-43.8 | E2 |
| NGC 7469 | 0.016317 | 66 | Sy1 | A5 | 0.05 | B6 | – | – | 10.5 | D2 | 45.0-45.1 | E2 |
| NGC 7582 | 0.005254 | 21 | Sy2 (broad Br) | A6 | 5., | B7 | 86, 120 | C3 | – | D2 | 43.3 | E2 |
| NGC 7674 | 0.028924 | 118 | Sy2 (broad Pa) | A8 | B8 | – | C2 | – | – | E5 |
Notes.— Distances are for and for the nearby objects are taken from RA09 and RA11. References.— A1. Oliva et al. (1994). A2: Véron-Cetty & Véron (2006). A3: Colina, Sparks, & Macchetto (1991). A4: Blanco et al. (1990). A5: Osterbrock & Martel (1993) and references therein. A6: Reunanen et al. (2003). A7: Nagar et al. (2002). A8: Ruiz et al. (1994). B1: Matt et al. (1999). B2: Vasudevan et al. (2010). B3: Perola et al. (2002). B4: Risaliti, Maiolino, & Salvati (1999). B5: Beckmann et al. (2005). B6: Guainazzi et al. (1994). B7: Bianchi et al. (2009). B8: Matt et al. (2000). C1: Maiolino et al. (2000). C2: Schmitt et al. (2003). C3: Wilson & Tsvetanov (1994). C4: Pogge (1989). C5: Mundell et al. (1995). C6: Wilson et al. (1985), Maiolino et al. (1994). D1: Tristram et al. (2007). D2: Tristram et al. (2009). D3: Raban et al. (2009). D4: Burtscher et al. (2009). E1: Moorwood et al. (1996). E2: Vasudevan et al. (2010). E3: From the keV flux of Weaver & Reynolds (1998) and applying a bolometric correction of 20. E4: Woo & Urry (2002) and references therein. E5: Estimated from the scattered keV luminosity by Malaguti et al. (1998).
This is the third paper in a series using high angular resolution IR observations, the CLUMPY torus models of Nenkova et al. (2008a,b), and a Bayesian approach for fitting the data (Asensio Ramos & Ramos Almeida 2009) to derive the torus and AGN properties. In the first two papers of the series (RA09 and RA11) we fitted the IR photometric spectral energy distributions (SEDs) of a sample of nearby Seyfert 1 and Seyfert 2 galaxies. We constrained several torus model parameters, namely its angular width and the average number of clouds along radial equatorial rays, as well as the viewing angle to the torus. We found, in clear contrast with the simplest unified model predictions, that type 2s appear to have tori with wider cloud distributions (the torus angular width parameter, see Figure 1, and Section 3.1) and more clumps than those of type 1s. This may suggest that some of the properties of the tori of type 1 and type 2 AGNs are intrinsically different. For a sample of nearby active galaxies Hönig et al. (2010) constrained the number of clouds along equatorial rays and their distribution using high-angular resolution ground-based mid-IR spectroscopic observations, while fixing the other torus model parameters. They found however, no differences in the number and distribution of clouds between type 1 and type 2 AGN.
In this paper we expand on our previous work by combining photometric SEDs with high angular resolution () mid-IR spectroscopic observations of a sample of 13 nearby Seyfert galaxies. For the first time in this work we fit these data for a sizeable sample of Seyferts to put tighter constraints on torus model parameters. This paper is organized as follows. Section 2 presents the new observations and the data compiled from the literature. Section 3 describes the clumpy dusty torus models and the modelling technique. A discussion of the fits and inferred torus parameters is presented in Section 4. Section 5 discusses the properties of the torus and AGN. Finally our conclusions are given in Section 6.
2. Observations
2.1. The sample
Our sample is composed of 13 nearby Seyfert galaxies at a mean distance of 38 Mpc (median of 31 Mpc). We selected the galaxies to have high () angular resolution near-IR (m) imaging, and mid-IR (m) imaging and spectroscopy in the literature (Sections 2.3 and 2.4). Although the sample is not complete and may not be representative, the high-angular resolution IR data ensure that we can isolate the IR emission arising from the torus surrounding the AGN. Currently such high angular resolution imaging and spectroscopy can only be attained from the ground using 8-10 m-class telescopes (typically at m). The properties of this sample relevant to this work, and the corresponding references are summarized in Table 1. The sample includes type 1 and type 2 Seyfert galaxies, as well as Seyfert 2 galaxies with a broad component detected in the near-IR. The bolometric luminosities of the AGN, , are taken from the works of Woo & Urry (2002) and Vasudevan et al. (2010), or estimated from the hard X-ray luminosities using a typical bolometric correction of 20 (Elvis et al. 1994). The AGN bolometric luminosities of our sample span almost two orders of magnitude, from to . In terms of their X-ray neutral hydrogen column density, (X-ray), the sample contains both Compton thin objects and Compton thick galaxies. We finally list in Table 1 two observational properties related to the torus, namely the opening angle of the ionization cones , and the torus size ( FWHM) as derived from the modelling of mid-IR interferometric observations. These two parameters will be compared with the fitted torus model parameters in Section 5.1.
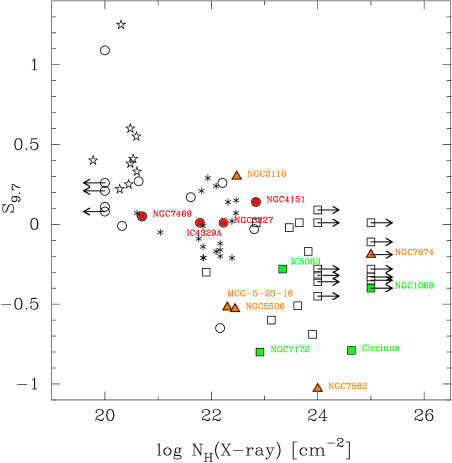
As explained in the Introduction, in this paper in addition to the IR photometric SEDs we will fit ground-based mid-IR (m) spectroscopy, including the m silicate feature. Shi et al. (2006) found that the m silicate features measured from Spitzer/IRS spectroscopy of a large sample of AGN vary from emission to absorption with increasing neutral hydrogen column densities. These authors interpreted this result with a scenario where the obscuring material is located in two different physical scales ( pc disk and a large scale disk extending up to 100 pc) with the dust distributed in clouds of different properties. Although the mid-IR ground-based spectroscopy in this work (see Sections 2.2 and 2.4) probes much smaller physical scales than those probed by the Spitzer/IRS data, it is of interest to place our sample of galaxies in the context of larger samples. In Figure 2 we show the apparent strength of the m silicate feature () as a function of the X-ray hydrogen column density for Seyfert 1s, Seyfert 2s, PG quasars, and 2MASS quasars adapted from the work of Shi et al. (2006). The strengths of the silicate feature in this figure are mostly measured from Spitzer/IRS spectroscopy111The typical extraction apertures of the Shi et al. (2006) IRS short-low (SL) spectra were 6pixels or 10.8″. and thus correspond©∂ to large physical sizes (at the mean distance of our sample kpc). For NGC 4151, NGC 7469 and NGC 3227 were also measured from Spitzer/IRS spectroscopy (Thompson et al. 2009), and for NGC 7582, NGC 7674 and IC 5063 from ground-based data (Hönig et al. 2010, and Section 2.4). From this figure it is clear that our relatively small sample probes well the observed ranges for Seyfert 1s and Seyfert 2s. We will come back to this issue in Section 5.
2.2. New observations
-band spectroscopy of NGC 4151 was obtained with Michelle (Glasse et al. 1997) on the Gemini North telescope on 20070318 (Program ID GN-2006B-Q-18). The standard mid-IR chop-nod technique was employed for the observations, and the chop and nod distances were 15″. The LowN grating and 2-pixel (0.36″) slit were used, giving . The slit was orientated at 60 degrees E of N, along the extended mid-IR emission discovered by Radomski et al. (2003). Two blocks of spectroscopy were obtained, each of 450 sec on-source (in the guided chop beam), and the galaxy nucleus was reacquired in between. Telluric standard stars were observed before and after the NGC 4151 spectroscopy, with the same observational setup. Michelle data files contain planes consisting of the difference image for each chopped pair for each nod. The chopped pairs were examined for anomalously high background or electronic noise, but none needed to be excluded from the final data set. The chopped difference images were then combined until a single file was obtained for each spectroscopy block, and this file for the two blocks then averaged together. The resulting spectrum was extracted in a 2-pixel aperture, wavelength-calibrated using telluric lines, divided by the standard star, and multiplied by a black-body spectrum.
-band (m) spectroscopy of NGC 1068 was obtained with Michelle on 20090923 (Program ID GN-2009B-Q-58), using the same chop-nod technique. The 3-pixel (0.54″) slit and lowQ grating were used, for , with the slit orientated along the ionisation cones (20 degrees E of N). The galaxy nucleus was observed for a total of 1800 sec on-source, and telluric standard stars were observed before and after NGC 1068. The data reduction procedure was similar to that used for the NGC 4151 -band spectroscopy, including extraction of the spectrum in a 2-pixel (0.36″) aperture. However, cancellation of the strong and variable -band telluric lines was poor in the initial, ratioed spectrum. This was improved by adding a sloping baseline to the standard star spectra before dividing222 i.e., fitting a continuum, multiplying by a few per cent, adding that back to the star spectrum, and dividing by that instead.. The effect on the spectral slope of the resulting NGC 1068 spectrum is small. The flux calibration was done with the telluric standard stars. The resulting flux densities are probably affected by slit losses, and therefore in Section 2.4 we recalibrate the spectra with photometric observations. Finally the -band spectrum used for the modelling was rebinned using a 3 pixel box.
| Galaxy | near-IR SED | Ref. | mid-IR SED | Ref | Spectroscopy | Ref |
|---|---|---|---|---|---|---|
| Circinus | A1 | 8.7, m | B1 | -band MIDI 0.60″ | C1 | |
| IC 4329A | A2 | 8.99, m | B2 | -band VISIR 0.75″ | C2 | |
| A3 | ||||||
| IC 5063 | A4 | 8.7, m | B1 | -band T-ReCS 0.67″ | C3 | |
| A5 | 10.5, 11.3, 11.9, m | B2 | ||||
| MCG 5-23-16 | A2 | 8.59, 8.99, m | B2 | -band VISIR 0.75″ | C2 | |
| m | B3 | |||||
| NGC 1068 | A2 | 8.8, m | B4 | -band Michelle 0.36″ | C4 | |
| A6 | -band Michelle 0.54″ | This work | ||||
| NGC 2110 | A7 | m | B5 | -band Michelle 0.36″ | C5 | |
| 8.6, 9.0, m | B2 | |||||
| m | B6 | |||||
| NGC 3227 | A8 | m | B1 | -band VISIR 0.75″ | C2 | |
| A3 | 8.99, m | B2 | ||||
| NGC 4151 | A8 | 10.8, m | B1 | -band Michelle 0.36″ | This work | |
| A3 | ||||||
| NGC 5506 | A1 | 11.3, m | B1 | -band T-ReCS 0.36″ | C6 | |
| M | A3 | |||||
| NGC 7172 | A2 | m | B1 | -band T-ReCS 0.36″ | C6 | |
| m | B7 | |||||
| NGC 7469 | A2 | 8.7, m | B8 | -band VISIR 0.75″ | C2 | |
| A1 | 10.49, 11.25, 11.88, 12.27, m | B2 | ||||
| NGC 7582 | A1 | 10.8, m | B1 | -band VISIR 0.75″ | C2 | |
| 8.6, 9.0, m | B2 | |||||
| NGC 7674 | A2 | m | B2 | -band VISIR 0.75″ | C2 |
References. A1: Prieto et al. (2010). A2: Alonso-Herrero et al. (2001). A3: Ward et al. (1987), the photometry is used as an upper limit. A4: Quillen et al. (2001). A5: Kulkarni et al. (1998). A6: Marco & Alloin (2000). A7: Alonso-Herrero et al. (1998), the photometry is an upper limit. A8: Alonso-Herrero et al. (2003). B1: RA09. B2: Hönig et al. (2010). B3: Reunanen, Prieto, & Siebenmorgen (2010). B4: Tomono et al. (2001), for the 0.4″ fluxes. B5: Mason et al. (2009). B6: Lawrence et al. (1985). B7: Horst et al. (2008). B8: RA11. C1: Tristram et al. (2007). C2: Hönig et al. (2010). C3: Young et al. (2007). C4: Mason et al. (2006). C5: Mason et al. (2009). C6: Roche et al. (2007).
2.3. Published unresolved nuclear fluxes
As discussed at length in our previous papers (Alonso-Herrero et al. 2001, 2003; RA09 and RA11) high angular resolution observations are required to isolate the emission associated with the torus, and with the direct view of the AGN in type 1s as well. At the distances of our galaxies and the current angular resolutions of the near and mid-IR imaging and spectroscopic observations the torus emission appears unresolved. In the near-IR up to m, extended stellar emission arising in the host galaxy contaminates and even dominates the nuclear fluxes of type 2 Seyferts (Alonso-Herrero, Ward, & Kotilainen 1996; Videla et al. 2011) and is not negligible in type 1 Seyferts (Kotilainen et al. 1992). At longer wavelengths (m) contamination by stellar photospheric emission is greatly reduced. However, any extended nuclear emission not directly related to the dusty torus, such as dusty clouds in the NLR and the coronal line region (e.g., Bock et al. 2000; Alloin et al. 2000; Radomski et al. 2003; Packham et al. 2005; Mason et al. 2006; Roche et al. 2006; Reunanen et al. 2010) and/or dust heated by young massive stars (Siebenmorgen, Krügel, & Spoon 2004; Alonso-Herrero et al. 2006; Mason et al. 2007; Reunanen et al. 2010), needs to be removed.
To isolate as much as possible the emission of the torus (and the AGN when seen directly) we compiled high-angular resolution near-IR and mid-IR fluxes from the literature with estimates of the unresolved emission when available. These unresolved fluxes are the result of removing, using various methods, the underlying near-IR stellar emission and the mid-IR emission produced by star formation. The compiled photometry includes near-IR ground-based and HST/NICMOS observations (with the NIC2 camera, angular resolutions ″) and ground-based mid-IR measurements with angular resolutions of . The only exception are the -band measurements of Ward et al. (1987) for type 1 Seyferts (Table 1), but we use them as upper limits. All the mid-IR photometric points have angular resolutions in the range ″ to match the resolution and slit widths of the mid-IR spectroscopic data (see Section 2.4). When possible, for a given galaxy we tried to match the angular resolution of the photometric points to make sure we are modelling similar physical scales. Table 2 lists for each galaxy in our sample the wavelengths and references of the photometric data used to construct their SEDs. Finally, we used the Spitzer/IRS m continuum fluxes of Deo et al. (2009) for those galaxies in our sample without nuclear star formation as upper limits in our fits.
Based on discussions in the papers listed in Table 2 and comparisons between different works we use the following errors for our analysis. For near-IR ground-based data, except for the NACO data (see below) of Prieto et al. (2010), we use for the -band 30%, for the and bands 25%, and for the -band 20%. These include the photometric error, the background subtraction uncertainty and the uncertainty from estimating the unresolved flux. For the last one we note that the stellar emission contribution within a given aperture decreases with increasing wavelength and thus the stellar contribution has a minimum in the -band (see e.g., Kotilainen et al. 1992 and Alonso-Herrero et al. 1996). The -band fluxes are always considered as upper limits because estimating the unresolved component was not possible. For the NACO AO observations of Prieto et al. (2010), which were measured through 0.1-0.2″ apertures, the smaller contamination by stellar emission when compared to natural seeing observations results in lower uncertainties. We therefore use 20% in J, and 15% in the NACO bands. Finally, for the NICMOS data, which have very stable photometric calibration and PSFs, we use 20% in the -band, and % in the and bands (unless otherwise specified in the corresponding references). The estimated NICMOS uncertainties are based on the comparison of the unresolved fluxes reported for the same galaxies in different works (Alonso-Herrero et al. 2001; Quillen et al. 2001; Gallimore & Matthews 2003, and Kishimoto et al. 2007). For the and band measurements we use 15% and 25% errors, respectively to account for the photometric calibration and unresolved component uncertainties (see details in RA09).
We finally address the issue of possible variability of the near-IR fluxes and the simultaneity of the SEDs. Nine out of the 13 galaxies in our sample have been reported to show variability in the near-IR: NGC 7674 (Quillen et al. 2000), NGC 1068, IC 4329A, NGC 2110, MCG 5-23-16, NGC 5506, and NGC 7469 (Glass 2004), NGC 3227 (Suganuma et al. 2006), and NGC 4151 (Koshida et al. 2009). There are no reports on mid-IR variability of our sources. The typical variability in the near-IR is % on average, with amplitude variations around the median of between for our sample. For all these galaxies the m data, when available, were taken simultaneously. The fluxes in some cases were not simultaneous with the shorter wavelength fluxes. However, in most cases the fluxes are taken as upper limits as there was no estimate of the unresolved emission. Glass (2004) showed that the -band variability is typically less than 20% around the median flux, which is within the photometric and unresolved emission uncertainties. We can therefore assume that variability in the near-IR does not affect the compiled SED within the above discussed uncertainties of the unresolved measurements.
2.4. Published ground-based mid-IR spectroscopy
The published mid-IR spectroscopy used in this work (see Table 2) was obtained with four different instruments:
-
•
(i) The Thermal-Region Camera Spectrograph (T-ReCS; Telesco et al. 1998) on the Gemini-South Telescope. The T-ReCS data were obtained with the low-resolution grating, which provides a spectral resolution of . The slit widths were 0.67″ (Young et al. 2007) and 0.36″ (Roche et al. 2006, 2007).
-
•
(ii) The Michelle instrument (Glasse et al. 1997) on the Gemini-North telescope. The Michelle observations (Mason et al. 2006; 2009 and Section 2.2) were obtained with a 0.36″ slit width and a spectral resolution of in the -band, and a 0.54″ slit and in the -band.
-
•
(iii) VISIR, the mid-IR imager and spectrograph mounted on the 8.2m UT3 telescope at the ESO/Paranal observatory in Chile. The VISIR observations (Hönig et al. 2010) were obtained in low-spectral resolution mode ( with a slit width of 0.75″.
-
•
(iv) MIDI (Leinert et al. 2003), the mid-IR interferometer at the VLTI at the ESO/Paranal observatory. The MIDI observations (Tristram et al. 2007) were taken with a 0.6″ width slit and . The data used here are a ”total flux spectrum”, where 4 spectra are obtained for this, two for each telescope of the interferometer and 2 for each ”window” in MIDI. The spectrum was extracted in a 6 pixel wide mask or 0.516″, and calibrated individually for the windows and telescopes.
Because the VISIR ground-based mid-IR spectra have slightly higher spectral resolution than the other spectra, we rebinned them to contain approximately 150 spectral points. The MIDI, T-ReCS and Michelle spectra contain between 100 and 200 spectral points. We did not attempt to remove any emission lines (e.g., [S iv]m) or broad features (e.g., PAH features) in the spectra.
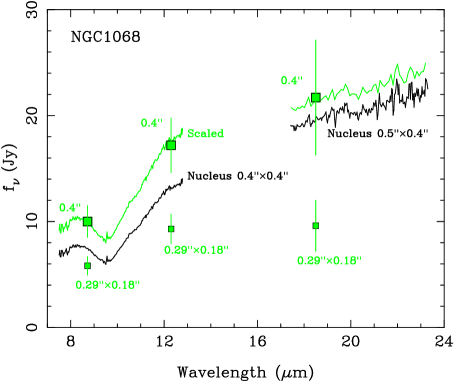
The final step was to scale the spectra to the photometric points. This was mostly necessary for the spectra observed with the narrowest slits (see Table 2) because of slit losses. As an example, in Figure 3 we show the original and -band spectra (Mason et al. 2006 and Section 2.1, respectively) of NGC 1068 together with the mid-IR photometric points of Tomono et al. (2001) for a circular aperture of 0.4″-diameter, and the photometry through a rectangular aperture after deconvolution of the data. To match the angular resolutions of the imaging and spectroscopic data, the NGC 1068 and -band spectra were scaled to their corresponding photometric points. Finally, for all the -band spectra in our sample we added in quadrature the intrinsic error of the spectra and the 15% error of the imaging data (see Section 2.3) used for scaling the data, for each spectroscopic point. For the -band spectrum of NGC 1068 the associated error for scaling the spectrum is 25%. These errors were added for the fitting.
3. Modeling of the data
3.1. Clumpy Torus Models
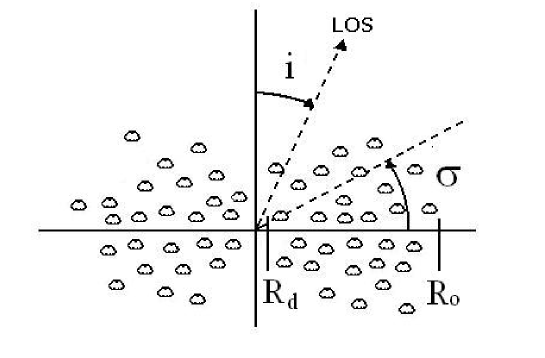
In this work we use an interpolated version (see Section 3.3) of the clumpy dusty torus models of Nenkova et al. (2002, 2008a,b) including the corrections for the previously erroneous AGN scaling factor (see the erratum by Nenkova et al. 2010). The CLUMPY models are described by the six parameters listed in Table 3 that we explain in the following (see also Figure 1). An AGN with a bolometric luminosity is surrounded by a torus of dusty clouds and all the clouds have the same optical depth , which is defined in the optical -band. The torus clouds are located between the inner radius of the torus and the outer radius of the torus , and the torus radial thickness is defined as . The inner radius of the torus is set by the dust sublimation temperature ( K),
| (1) |
The angular distribution of the clouds is assumed to have a smooth boundary and it is described as a Gaussian with a width parameter . The radial distribution is a declining power law with index (). The mean number of clouds along radial equatorial rays is . The number of clouds along the line of sight (LOS) at a viewing angle (measured from the polar direction, see Figure 1) is,
| (2) |
In a clumpy dust distribution the classification of an object as a type 1 or type 2 AGN is not truly a matter of the viewing angle but of the probability for direct view of the AGN (see Figure 1, and also Elitzur 2008). The probability for an AGN-produced photon to escape through the torus along a viewing angle when all the clouds are optically thick () is,
| (3) |
| Galaxy | (frg) | Ref | Ref | ||
|---|---|---|---|---|---|
| (mag) | |||||
| Circinus | 0.44 | 9 | A1, A2 | 1.8/2.4 | B1 |
| IC 4329A | 0.28 | - | - | B2 | |
| IC 5063 | 0.68 | 7 | A3 | 0.3 | B2 |
| MCG 5-23-16 | 0.46 | A4 | 0.3 | B2 | |
| NGC 1068 | 0.85 | - | - | B3 | |
| NGC 2110 | 0.74 | 5 | A2 | 3 | B2 |
| NGC 3227 | 0.68 | - | - | 0.01 | B4 |
| NGC 4151 | 0.71 | - | - | 0.14 | B4 |
| NGC 5506 | 0.30 | A5 | 1.1/1.4 | B1 | |
| NGC 7172 | 0.46 | - | - | 3.2/3.2 | B1 |
| NGC 7469 | 0.72 | - | - | 0.05 | B4 |
| NGC 7582 | 0.42 | 8, 13 | A6 | 1.0 | B2 |
| NGC 7674 | 0.91 | A7 | 0.2 | B2 |
Notes.— The axial ratios are the ratio of to minor to major axis of the host galaxies and are taken from de Vaucouleurs et al. (1991), except for that of NGC 7172 that is from Jarrett et al. (2003). S9.7 are the observed strengths of the silicate feature, with positive numbers indicating that the feature is in emission, and negative numbers the feature is in absorption. For the Roche et al. (2007) galaxies, the two measurements correspond to fits to the feature done using two different silicate grain profiles. References. A1: Maiolino et al. (2000). A2: Storchi-Bergmann et al. (1999). A3: Heisler & Robertis (1999). A4: Veilleux et al. (1997). A5: Goodrich et al. (1994). A6: Winge et al. (2000). A7: Riffel, Rodríguez-Ardila, & Pastoriza (2006). B1: Roche et al. (2007). B2: Hönig et al. (2010). B3: Mason et al. (2006). B4: Thompson et al. (2009).
In the models the radiative transfer equations are solved for each clump and thus the solutions depend mainly on the location of each clump within the torus, its optical depth, and the chosen dust composition. We adopt a dust extinction profile corresponding to the OHMc dust (i.e., the standard cold oxygen-rich ISM dust of Ossenkopf et al. 1992). The total torus emission is calculated by integrating the source function of the total number of clumps convolved with the radiation propagation probability along the torus (Nenkova et al. 2002). For Type 1 and intermediate type Seyferts where there is an unobscured view of the AGN, it is also possible to include its contribution to the resulting SED. The AGN continuum emission in these models is characterized with a piecewise power law distribution (see Nenkova et al. 2008a for details).
We finally note that there is some evidence of the presence of an extra hot dust component, originating very close to the AGN. Reverberation mapping (see discussion by Kishimoto et al. 2007) and near-IR interferometric observations (e.g., Kishimoto et al. 2009 and references therein) of Seyfert galaxies have shown that the sublimation radii appear to be smaller than expected from Equation 1 (similar to the Barvainis 1987 relation). However in this work we take the simplest approach for fitting the data assuming that all the near-IR emission is originating in the ¨classical¨ torus, with no additional hot dust components.
3.2. Foreground dust components
In this section we examine the possibility of having contributions to the observed IR SEDs and mid-IR spectra of Seyfert galaxies from dust emission and absorption unrelated to the AGN. There are several pieces of evidence we can look into, namely the inclination of the galaxies, and the presence of nuclear dust lanes and spatially resolved variations of the silicate feature.
Approximately half of the galaxies in our sample have minor-to-major axis ratios of (inclined host galaxies, see Table 4), and as suggested by Deo et al. (2009), it is likely that dust in the host galaxy disk can contribute significantly to the observed silicate absorption and the long-wavelength continuum. The only exception appears to be IC 4329A, which is a highly inclined system, but does not show silicate absorption. Deo et al. (2009) concluded for this galaxy that it is likely that our line of sight does not intersect any dense clouds in the host galaxy.
| Parameter | Symbol | Interval |
|---|---|---|
| Torus radial thickness | [5, 30] | |
| Torus angular width | [, ] | |
| Number of clouds along an equatorial ray | [1, 15] | |
| Index of the radial density profile | [0, 3] | |
| Viewing angle | [, ] | |
| Optical depth per single cloud | [5, 150] |
Notes.— Torus radial thickness: where is the outer radius and is the inner radius (Equation 1). The cloud distribution between and is parametrized as .
Using color maps Martini et al. (2003) showed that in general the dust in the nuclear regions of Seyfert galaxies is on physical scales not associated with those of the dusty torus. It is then likely that this dust is located in front of the nucleus (see also Regan & Mulchaey 1999) and arises from the galactic ISM. In our sample, Circinus, IC 5063, NGC 5506, NGC 7582, NGC 2110, NGC 7172, and possibly NGC 7674 show dust features in the nuclear (central ) regions (see e.g., Quillen et al. 1999; Maiolino et al. 2000; Martini et al. 2003).
Some of the galaxies in our sample show variations of the m silicate feature on scales of ″ indicating the presence of extended dust components (Mason et al. 2006; Roche et al. 2006, 2007: Colling, Roche, & Mason 2009). Similarly, the spatially-resolved mid-IR polarimetric observations of NGC 1068 (Packham et al. 2007) can be explained with a geometrically, and optically thick torus surrounded by a larger, more diffuse structure, associated with the dusty central regions of the host galaxy.
Roche et al. (2007) showed that NGC 5506 and NGC 7172, both with prominent nuclear dust lanes (see e.g., Malkan et al. 1998), have similar absorbing columns as derived from X-ray observations and the m features, for the latter just by using a foreground dust screen model. This suggests that some of the extinction measured from the m silicate feature might arise in the galactic ISM (see also the discussion in Section 2.1, and Figure 2). In other words, in these two galaxies if the silicate feature were to come only from the torus, it would be shallower (at it is filled in by emission from warm dust also in the torus). These findings would also be consistent with the work of Guainazzi, Matt, & Perola (2005) who showed that the presence of dust lanes on scales of 100 pc in Compton-thin Seyfert 2s is correlated with the X-ray obscuration, mostly in the X-ray column density range . This was interpreted by these authors as due to the larger covering fraction of the gas in the dust lanes, rather than the pc-scale dusty torus.
From a theoretical point of view, clumpy dusty models cannot produce very deep silicate features ( (see Nenkova et al. 2008b; Elitzur 2008; Sirocky et al. 2008), while observations show that many Seyfert galaxies have relatively deep silicate features (see Shi et al. 2006; Hao et al. 2007; Deo et al. 2009). In our sample, this includes Circinus, NGC 5506, NGC 7582, NGC 7172 (see Table 4 and Figure 2). By analogy with those ULIRGs optically classified as type-2 AGN and with deep silicate features modelled by Sirocky et al. (2008), the deep silicate features of some Seyfert 2 galaxies in our sample may be explained by additional obscuration by cold foreground dust.
For simplicity we will consider the extended dust component as a purely foreground medium producing only absorption. We note however, that high angular resolution mid-IR spectroscopic observations of the ionization cone dust of NGC 1068 show evidence of components of both absorption and emission. We use the IR extinction curve of Chiar & Tielens (2006) of the local ISM in the wavelength range m, which includes the two silicate features at 9.7 and m. For extinctions (mag) the effects of foreground extinction cannot be ignored, especially in the spectral region around the m silicate feature.
Finally, it is important to note the possible degeneracy between AGN type and the effects of foreground extinction. Using smooth density torus models Alonso-Herrero et al. (2003) demonstrated that the reddened near-IR SED from a nearly face-on (polar view) torus (underlying Seyfert 1) looks similar to the intrinsic near-IR SED at a viewing angle closer to a true Seyfert 2 (equatorial view) given sufficient levels of foreground extinction (mag). Given this degeneracy in our fitting process we choose not to leave the foreground extinction as a free parameter (see Section 3.3), but instead we use published values of the extinction as estimated from near-IR measurements. Table 4 gives the values of the foreground extinction used in this work, only for galaxies with evidence of extended dust components and with mag. The foreground extinction is applied to the torus emission, as well as to the AGN emission that is included for galaxies with a direct view of the BLR.
3.3. Modeling Technique
The CLUMPY database now contains models, which are calculated for a fine grid of model parameters. To fit the data we take a Bayesian approach to dealing with the inherent degeneracy of the torus model parameters (see RA09 and RA11). In this work we use an updated version of the BayesClumpy code developed by Asensio Ramos & Ramos Almeida (2009). This tool uses a Bayesian inference to allow as much information as possible to be extracted from the observations. We refer the reader to Asensio Ramos & Ramos Almeida (2009) for details on the interpolation methods and algorithms used by BayesClumpy. However, it is important to note that in using a Bayesian approach we do not make use of the original set of models of Nenkova et al. (2008a,b), but rather of an interpolated version of them (see figures 3 and 4 in Asensio Ramos & Ramos Almeida 2009). The fineness of the grid of clumpy models makes interpolation an appropriate methodology for our studies.
The new version of BayesClumpy allows, in addition to fitting photometric points, for the possibility of fitting spectra. In the case of photometric observations, BayesClumpy simulates the transmission curve of the corresponding filter on the model spectra. For the spectroscopic observations, the full information, flux and associated uncertainty, is used. When both photometric SEDs and spectroscopy are fitted together, we use the data uncertainties discussed in Section 2 as weights for the fitting routine. Under the assumption that the torus models are valid simultaneously for photometric and spectroscopic data and that the noise in all observed points is mutually uncorrelated, the Bayesian approach is insensitive to the fact that there are many more spectroscopic points than photometric ones. The reason is that, apart from the possible regularization that can be included in the prior distributions, we sample the full posterior distribution and obtain marginalized posterior for each parameter. The marginalization procedure takes into account all possible values of the parameters producing good fits. This avoids the possible overfitting of the SED which is produced by neglecting the few photometric points.
| Galaxy | [deg] | [deg] | ||||||||||
| Median | MAP | Median | MAP | Median | MAP | Median | MAP | Median | MAP | Median | MAP | |
| Pure Type 1s | ||||||||||||
| IC 4329A | 28 | 5 | 15 | 0.0 | 130 | 54 | ||||||
| NGC 3227 | 44 | 15 | 15 | 0.1 | 149 | 30 | ||||||
| NGC 4151 | 16 | 9 | 15 | 0.0 | 116 | 68 | ||||||
| NGC 7469 | 20 | 11 | 15 | 0.0 | 148 | 58 | ||||||
| Pure Type 2s | ||||||||||||
| Circinus | 45 | 15 | 15 | 0.9 | 54 | 61 | ||||||
| IC 5063 | 47 | 6 | 15 | 0.8 | 99 | 84 | ||||||
| NGC 1068 | 21 | 5 | 15 | 2.0 | 49 | 89 | ||||||
| NGC 7172 | 68 | 17 | 15 | 1.5 | 52 | 85 | ||||||
| Type 2s with broad lines detected in near-IR | ||||||||||||
| MCG 5-23-16 | 35 | 14 | 15 | 2.1 | 133 | 59 | ||||||
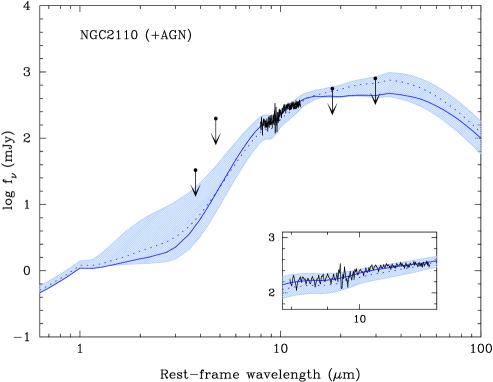
| NGC 2110 (+AGN) | 70 | 5 | 12 | 2.7 | 150 | 37 | ||||||
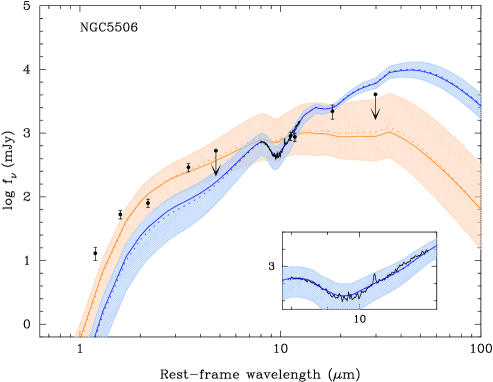
| NGC 5506 | 40 | 15 | 15 | 0.3 | 99 | 35 | ||||||
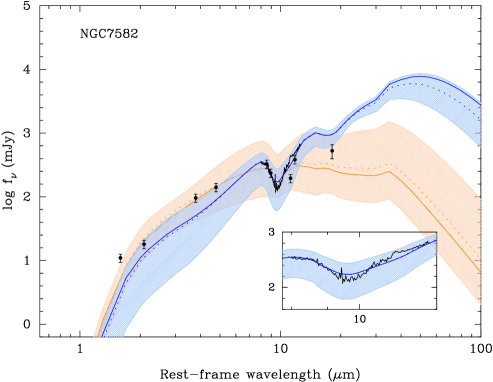
| NGC 7582 | 49 | 25 | 15 | 0.1 | 97 | 0 | ||||||
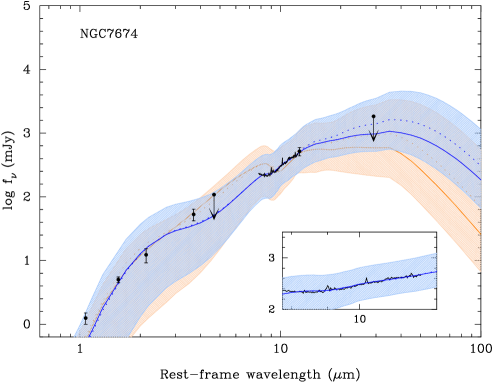
| NGC 7674 | 24 | 12 | 15 | 2.2 | 148 | 69 | ||||||
Notes.— Torus model parameters are listed for the median and values around the median, and the MAP values.
The prior distributions for the model parameters are assumed to be truncated uniform distributions in the ranges given in Table 3. We note that in the most up-to-date version of the CLUMPY models after correcting for the erroneous AGN scaling factor (Nenkova et al. 2010), the optical depth of the individual clouds only goes up to 150, instead of of the older models. The only prior information we use in this work is the viewing angle. For those galaxies in our sample with H2O maser detections: Circinus (Greenhill et al. 2003) and NGC 1068 (Greenhill et al. 1996) we restricted the viewing angles to values in the range , that is, close to equatorial views through the torus. We can also use the accretion disk viewing angles deduced from X-ray observations of the Fe K line as an additional constraint, if we assume that the accretion disk and the torus are coplanar. We found estimates for three galaxies in our sample, for MCG 5-23-16 is (Reeves et al. 2007), and for NGC 5506 and NGC 2110 is (Guainazzi et al. 2010 and Weaver & Reynolds 1998). For these three galaxies we assumed Gaussian distributions for this parameter with a width of 10 °.
In addition to the the six torus model parameters, there are two extra parameters that can be fitted or fixed. The first parameter accounts for the vertical displacement needed to match the fluxes of a given model to an observed SED/spectrum. This vertical shift, which we allow to vary freely, scales with the AGN bolometric luminosity (see Nenkova et al. 2008b) and will be discussed in Sections 4.1 and 4.2. The second parameter is the foreground extinction (see Section 3.2 and Table 4) due to the host galaxy, which is different from that produced by the torus along the LOS (see RA09 and RA11).
For the modelling of the SED and spectroscopy of type 1 Seyferts the AGN contribution needs to be added to the torus emission (see Nenkova et al. 2008a for the assumed shape). In principle, the same should be done for those Seyfert 2s in our sample with broad lines detected in the near-IR, as this means we have a direct view of the BLR. However most of these Seyfert 2s in our sample are also heavily affected by extinction (see Table 4). Kishimoto et al. (2007) demonstrated for type 1 Seyferts that most of the unresolved emission at m is produced by hot dust emission from the inner walls of the torus, and that there is a very small contribution from the big blue bump emission (i.e., AGN emission) at this wavelength. Then there is the question for AGN with broad lines and foreground extinctions mag of whether we are seeing AGN emission in the range m or not. We thus decided for these galaxies to fit the data both including and not including the AGN emission. This will be discussed in more detail in Section 4.2.
4. Results from fits to SED+spectroscopy
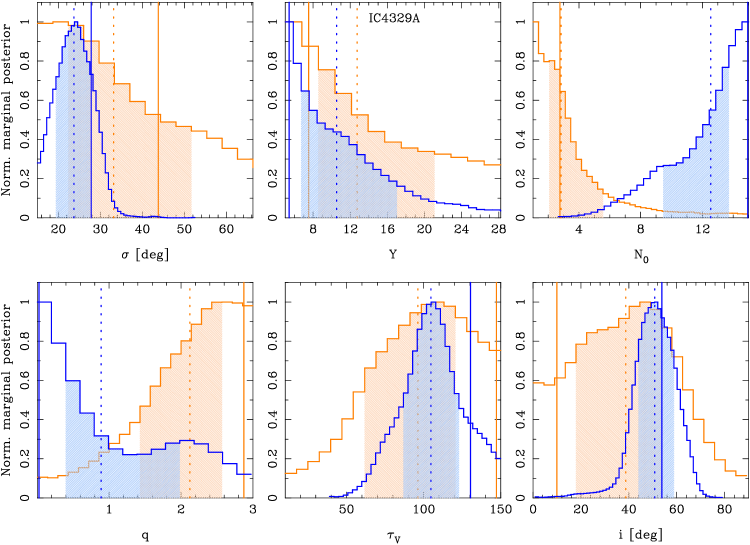
The result of the fitting process are the marginal posterior distributions for the six free parameters that describe the CLUMPY models plus the vertical shift. These are the probability distributions of each parameter, which are represented as histograms. As explained in Section 3.1, except for the viewing angle of five galaxies, for the rest of the parameters we use uniform priors. If the observational data contain sufficient information for the fit, then the resulting probability distributions of the fitted torus model parameters will clearly differ from uniform distributions. In those cases the probabilities either show trends or are centered at certain values within the considered intervals.
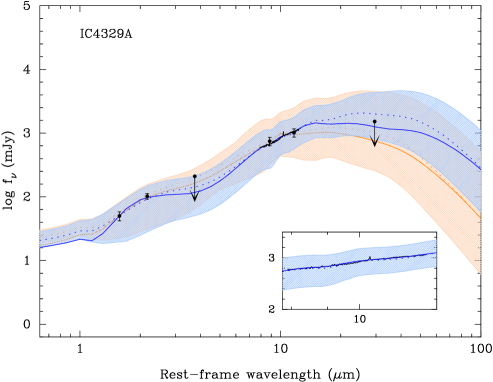
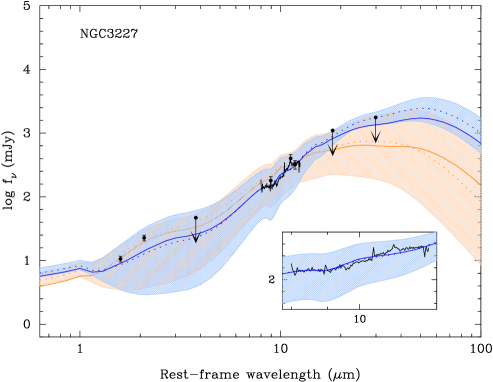
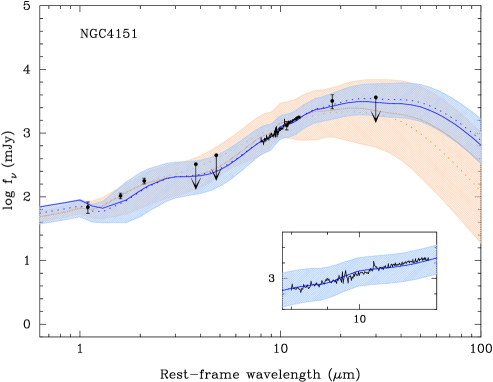
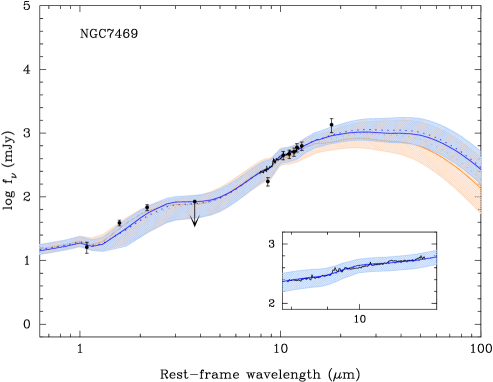
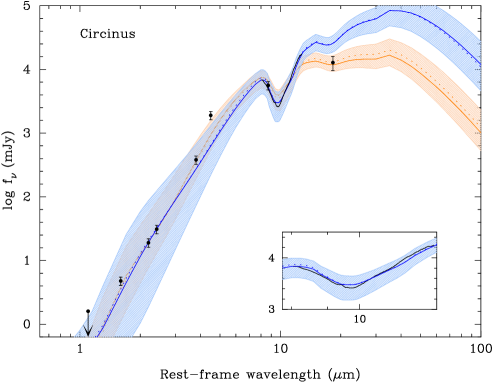
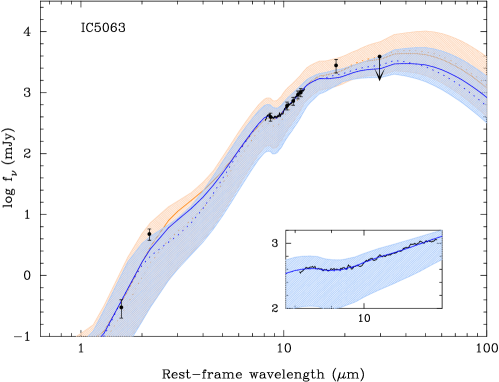
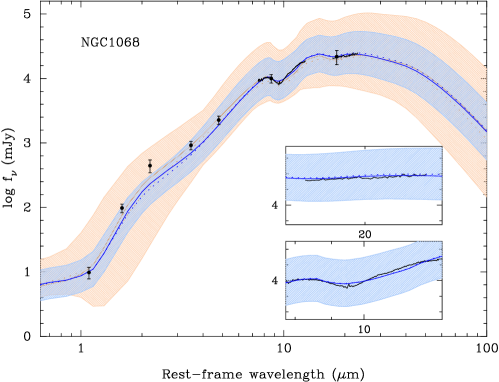
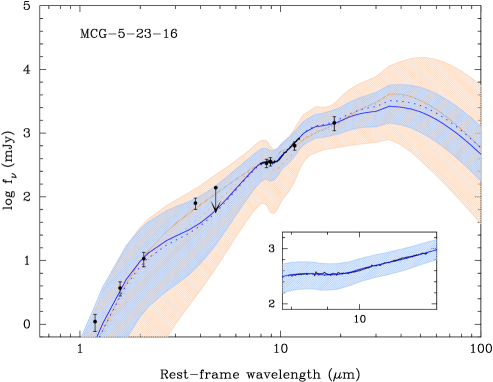
For each galaxy we translate the fitted torus model parameters into two model spectra. The first one corresponds to the maximum-a-posteriori (MAP) values that represent the “best fit” to the data. The second is the model produced with the median value of the probability distribution of each parameter, which is characteristic of the observed SED+spectroscopy data. Figures 4 to 6 show for Seyfert 1s, Seyfert 2s, and Seyfert 2s with broad lines in the near-IR, respectively, these fits to the SED+spectroscopy. Figure 7 shows the marginal posterior distributions of the six torus model parameters for IC 4329A. The marginal posterior distributions for the rest of the sample are shown in Appendix A. In Appendix B we also show for Circinus, NGC 1068, NGC 4151, and IC 4329A the two-dimensional posterior distributions for all combinations of the torus model parameters. This kind of two-dimensional distributions can be used to check for possible correlations and degeneracies between different torus model parameters for a given galaxy. Table 5 summarizes the statistics for the fitted torus model parameters. In Sections 4.1 to 4.3 we discuss new constraints on the torus model parameters when fitting the SED+spectroscopy data together, and in Section 4.4 we assess the improvements obtained by adding mid-IR spectroscopy to the SED data.
4.1. Fits to pure Seyfert 1s and Seyfert 2s
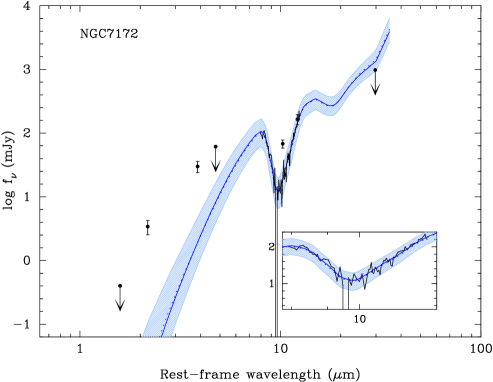
In this section we discuss the fits to the pure Seyfert 1s and 2s333In this work pure type 1 AGN have broad lines detected in the optical (i.e., include types 1.5, 1.8 and 1.9), while pure type 2s do not have broad lines detected either in the optical or in the near-IR., while the fits to those Seyfert 2s with broad lines detected in the near-IR (including NGC 5506) are discussed separately in Section 4.2. As can be seen from Figures 4 and 5 (in blue), the CLUMPY torus models provide very good simultaneous fits to the photometric SED and spectroscopy data of Seyfert 1s and 2s, in particular for those galaxies with low host galaxy foreground extinction.
It is worth noting that all the Seyfert 1s except IC 4329A show a slight excess of emission in the near-IR, above the median torus+AGN model fits, which might be attributed to hot dust. Mor et al. (2009) included, apart from the torus emission, two extra components, hot dust and NLR emission, to fit the Spitzer/IRS spectra of PG quasars. These extra components provided the additional flux need in the near-IR for their sample. It is not clear however if such components are needed in our fits, because the unresolved emission we used for our fits probes typically a few tens of parsecs, while the Mor et al. (2009) data cover physical sizes on scales of a few kpc. Finally, the near-IR photometric points of our Seyfert 1s are well within the confidence regions of the fitted models.
The only galaxy for which we could not get a good fit to both the SED photometric points and the mid-IR spectroscopy was the Seyfert 2 galaxy NGC 7172. This galaxy is highly inclined (see Table 4), has prominent dust lanes, and thus probably suffers from high extinction in the host galaxy (see e.g. Roche et al. 2007). Since we could not find estimates for the host galaxy extinction, we used the foreground extinction derived from the X-ray column density and the standard Galactic ratio (Bohlin, Savage, & Drake 1978). As can be seen from Figure 5, while the model provides a reasonable fit to the m silicate feature, the near-IR photometric points are well above the model. One possibility is that there is contamination by extended dust components in this galaxy, and the unresolved flux estimates from the and -band ground-based data are upper limits. However, the most likely explanation is that the clumpy torus emission + cold foreground dust screen are not the appropriate model for this galaxy. Rather, a spherically symmetric smooth model may be more appropriate for deeply embedded objects, such as NGC 7172 (see Levenson et al. 2007).
As can be seen from the marginal posterior distributions in Figure 7 and Figures A1 to A7 (blue lines and blue shaded regions), the majority of the fitted torus model parameters of the pure Seyfert 1s and Seyfert 2s are well constrained. In particular, the width of the angular distribution , the radial torus thickness , and the viewing angle , which were also relatively well constrained from fits to the SED alone (RA09, RA11, and Section 4.4), present narrow probability distributions. As found by RA11 there is no clear relation between the derived viewing angle and the classification of the galaxy into a type 1 or a type 2. In other words, not all type 1s are viewed at relatively low inclination angles and not all type 2 are seen at directions closer to the equatorial plane of the torus. However, as we shall see in Section 5.2, the relevant quantity for a galaxy to be classified as a type 1 or a type 2 is the probability for an AGN produced photon to escape unabsorbed or not.
As can be seen from Table 5, our results confirm that CLUMPY models of tori with relatively small radial thicknesses, produce good fits with no need for very large tori. The fitted values are within the assumed range of , and the data for most galaxies can be fitted with tori with radial thickness . In Section 5.1 we will compare in more detail our derived physical sizes of the torus (in parsecs) with those derived from the modeling of mid-IR interferometry.
The index of the power law distribution controls the placement of clouds between the inner, hotter parts of the torus and the outer cooler regions (Nenkova et al. 2008b), and thus plays a role in the shape of the IR SED (see also Hönig & Kishimoto 2010). The effects of changing on the CLUMPY models are easier to see in type 1 objects (low values of ). For steep radial distributions (clouds concentrated near the inner radius of the torus) the near and mid-IR SEDs become redder (see figure 9 of Nenkova et al. 2008b), although including the AGN contribution always makes the model SEDs flatter. We find that the fitted values of for our Seyfert 1s are relatively small. However the reverse for Seyfert 2s (seen at high inclinations) is not necessarily true. We also note that the sensitivity of the SED to for very small values of is highly reduced. This is because for such small tori the SED does not change much whether the clouds are distributed along the whole extent of the torus () or highly concentrated in its inner part (large ). This lack of sensitivity could result in posterior distributions that depend on the quality of the interpolation technique used by BayesClumpy. Consequently, whenever the inferred is very small (e.g., NGC 1068), the inferred value of should be treated with caution.
For a larger sample and using fits of the SEDs alone RA11 found statistically significant differences of between type 1s and type 2s. RA11 found that the SEDs of type 1s were fitted with small values of , while those of type 2s required larger . Hönig et al. (2010), on the other hand, found the parameter (, in their notation) to be in the range for both type 1s and 2s. The other torus model parameters, and , derived from the SED+spectroscopy data will be discussed in the context of the fits of the spectral region around the m silicate feature (Section 4.3). For a detailed discussion of the fits to individual sources and comparison with clumpy torus models fits in the literature, we refer the reader to Appendix B.
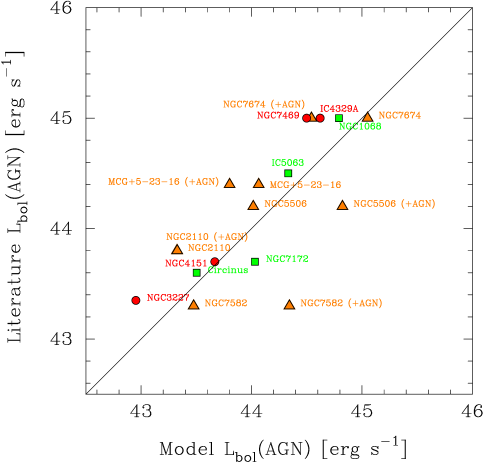
As explained in Section 3.3, the shift applied to scale the CLUMPY models to the data is directly related to the bolometric luminosity of the AGN. In this work we chose to leave the shift as a free parameter, but other works (e.g., Mor et al. 2009) used it as a constraint for the fits. Figure 8 shows a comparison between the fitted AGN bolometric luminosities () and AGN bolometric luminosities from the literature. The latter were computed with different methods, including applying bolometric corrections and modelling of the SEDs (see Table 1 and Section 2.1). The typical uncertainties of the AGN bolometric luminosities from scaling the CLUMPY models are dex. It is clear from this figure that the agreement between the bolometric luminosities is good for the majority of pure Seyfert 1s and Seyfert 2s, with most of our estimates within dex of the 1:1 relation. The only exception is the Seyfert 1 NGC 7469. The fitted AGN bolometric luminosity for this galaxy is below two independent literature estimates (e.g., Woo & Urry; Vasudevan et al. 2010). There is strong nuclear (pc) star formation in this galaxy, but it only contributes a small fraction of the -band luminosity within 0.2″ (see e.g., Davies et al. 2007 and references therein). However, the ground-based mid-IR nuclear spectrum of this galaxy (Hönig et al. 2010) show faint m PAH emission, and the PAH emission becomes very prominent in the circumnuclear regions (Roche et al. 1991). It is then likely that the mid-IR nuclear fluxes and spectroscopy of NGC 7469 contain a contribution from star formation. A similar situation may be the case for NGC 3227.
4.2. Fits to Seyfert 2s with near-IR broad lines
Four galaxies in our sample are classified as Seyfert 2s, but there are also reports in the literature of detections of broad lines in the near-IR (see Table 1 for references). Additionally, NGC 5506 has different spectral classifications in the literature and there is some controversy about whether it has broad components of the near-IR emission lines (Blanco et al. 1990; Ruiz et al. 1994: Goodrich et al. 1994; Veilleux et al. 1997). Nagar et al. (2002) clearly detected BLR emission in the near-IR and classified NGC 5506 as a narrow line Seyfert 1 (NLSy1). Given these facts we discuss NGC 5506 in this section.
As the near-IR data suggest, for this kind of galaxies we may have a direct view of the BLR, and thus in principle we should include the AGN component when modelling the data. However, some of these galaxies also tend to suffer from relatively high values of foreground extinction (Table 4). For these Seyferts we performed the fits with and without the AGN components. In this section we use other observational properties of these galaxies to determine whether the AGN component should be included or not for fitting their SED+spectroscopy data.
| Galaxy | (AGN) | Covering factors | |||
| [erg s-1] | [pc] | [%] | |||
| Pure Type 1s | |||||
| IC 4329A | 44.6 | 2.7 | |||
| NGC 3227 | 43.0 | 0.7 | |||
| NGC 4151 | 43.7 | 0.9 | |||
| NGC 7469 | 44.5 | 2.6 | |||
| Pure Type 2s | |||||
| Circinus | 43.5 | 1.0 | |||
| IC 5063 | 44.3 | 2.4 | |||
| NGC 1068 | 44.8 | 2.0 | |||
| NGC 7172 | 44.0 | 2.0 | |||
| Type 2s with near-IR broad lines | |||||
| MCG5-23-16 | 44.1 | 2.3 | |||
| NGC 2110 (+AGN) | 43.3 | 1.0 | |||
| NGC 5506 | 44.0 | 1.9 | |||
| NGC 7582 | 43.5 | 1.5 | |||
| NGC 7674 | 45.1 | 6.1 | |||
Notes.— (AGN) and were derived from the median values of the marginal posterior distributions.
In Section 4.1 we showed that the model fits for pure Seyfert 1s and 2s provided good constraints to the AGN bolometric luminosity. We can then use the comparison between the fitted AGN luminosity and those taken from the literature to determine if we need to add the AGN component. Figure 8 suggests that for NGC 5506, NGC 7582, NGC 7674, and MCG 5-23-16 we do not need to add the AGN component. For NGC 2110 we obtained comparable bolometric luminosities (and other torus model parameters) with and without the AGN component. This is probably due to the lack of photometric points in the near-IR for this galaxy. Finally we note that when we included the AGN component to fit the SED + spectroscopy data of NGC 5506 we could not fit the data with the viewing angles inferred from X-ray data (Section 3.2). This is in agreement with the luminosity comparison.
The fits of the Seyfert 2s with broad lines detected in the near-IR are shown in Figure 6, while the marginal posterior distributions are displayed in Appendix A (Figures A8 to A12). For the three galaxies with moderate silicate features (MCG 5-23-16, NGC 2110, and NGC 7674, see Table 4) we are able to reproduce reasonably well the photometric SED points and the mid-IR spectroscopy, and the torus model parameters are mostly well constrained. As for the pure Seyfert 2 NGC 7172, the two galaxies with relatively deep silicate features in absorption (NGC 5506 and NGC 7582), it is possible to do a simultaneous fit of the photometry and mid-IR spectroscopy, although it is not a good fit. Imanishi (2000) measured an unusual ratio between the depths of the m carbonaceous dust absorption and the m silicate dust in NGC 5506. He suggested that the obscuration towards the nucleus of NGC 5506 could be ascribed mostly to dust in this host galaxy (100-pc scale) and not to the obscuring torus. This may also reflect differences in grain populations (see Roche et al. 2007). The X-ray emission of NGC 7582 indicates the presence of at least two absorbers of columns densities of and , with the latter probably associated with large scale obscuration (Bianchi et al. 2009).
4.3. Fits to the silicate feature
The insets of the upper panels of Figures 4 to 6 show in detail the fits in the spectral region around the m silicate feature. For NGC 1068 we also show in Figure 5 the fit to the -band spectrum. It is clear that the interpolated version of the Nenkova et al. (2008a,b) clumpy torus models produce excellent fits to the -band silicate feature, and the m spectrum of NGC 1068. In particular for galaxies with low host galaxy extinctions and moderate silicate strengths (), the fits to the silicate feature spectral region are also compatible with those to the SED photometric points. This suggests that the data mostly correspond to the torus emission. These galaxies are all the pure Seyfert 1s (IC 4329A, NGC 3227, NGC 4151 and NGC 7469), and NGC 1068, IC 5063, MCG -23-16, and NGC 7674.
We now discuss the fits of those galaxies with deep silicate features. For the Circinus galaxy, which has a relatively deep silicate feature (, Roche et al. 2007 and Table 4), CLUMPY torus models with the parameters given in Table 5 plus a foreground absorbing screen with mag reproduce reasonably well the silicate feature and the photometric SED, except for the m flux. For the other galaxies (NGC 5506, NGC 7172 and NGC 7582), although the fits to the feature are qualitatively good, the models do not reproduce at the same time all the photometric points. One possibility for these three galaxies is that there is an important contamination from extended dust structures, while in Circinus, the closest galaxy in our sample (Mpc) this contamination is minimized.
Nenkova et al. (2008b) emphasized that the clumpy torus distributions produce more elaborate patterns of the m and the m silicate features (see also Hönig & Kishimoto 2010), while for smooth density models the silicate feature is always in emission for face-on views and in absorption for edge-on views. Besides, the CLUMPY torus models never produce very deep silicate features, in contrast with smooth density models (e.g., Pier & Krolik 1993; Efstathiou & Rowan-Robinson 1995). When fitted together with the photometric SEDs we expect the silicate feature to be mostly sensitive to the optical depth of the clouds , and the average number of clouds along radial equatorial rays . As an illustration of the complicated behavior of the silicate feature in terms of the torus model parameters, we can see that galaxies of the same type and with similar apparent depths of the m silicate feature (e.g., type 1s IC 4329A and NGC 7469, and type 2s MCG-23-16 and IC 5063, see Hönig et al. 2010) have different fitted values of and (see Table 5, and Appendix A).
A general result for our sample of Seyfert galaxies is that the average number of clouds along radial equatorial rays is never very low, and is in the range . This is in good agreement with the results of Nenkova et al. (2008b). However, Hönig et al. (2010) inferred fewer clouds along equatorial rays from their fits to the mid-IR spectroscopy of Seyfert galaxies, but we note these authors fixed the value of , among other parameters (see Appendix B for a more detailed discussion). We also note here, that the values of the optical depth of the clouds in the corrected version of the models (see Nenkova et al. 2010) only go up to 150, whereas the older version were up to 200. In some cases (e.g., NGC 3227, NGC 7469) it appears as if to compensate for limited values of , the fits are achieved with more clouds along radial equatorial rays, close to the maximum value allowed by the models of .
While for most Seyferts in our sample CLUMPY torus models with a typical value of produced good fits to the data, the Spitzer/IRS spectra of PG quasars were well fitted with torus models containing a mean value of (Mor et al. 2009). This is well understood because most PG quasars show the m silicate feature in emission (Shi et al. 2006; Hao et al. 2007), and the Nenkova et al. clumpy torus models with and almost always produce the feature in absorption, for all viewing angles (see also discussions by Nenkova et al. 2008b and Nikutta et al. 2009).
The optical depths of our sample of Seyferts show a broad distribution, , with no obvious dependence on other torus model parameters or AGN type (see also Mor et al. 2009). This result may be understood because the CLUMPY model near and mid-IR SEDs and the strength of silicate silicate feature vary only slightly with varying for a given set of and , at (see Nenkova et al. 2008b). The IR data of the PG quasars studied by Mor et al. (2009) were fitted with (Mor et al. 2009).
4.4. Comparison with fits of SEDs alone
In Figures 4-6 we also compare the fits done with SED+spectroscopy (blue lines and blue shaded regions) and SEDs alone (orange lines and orange shaded regions), except in cases of sparse SEDs. Some of our galaxies are in common with the works of Ramos Almeida et al. (2009, 2011). We have redone the SED alone fits for those galaxies to use consistent errors with our work. In general we find that the main difference is that fits to SEDs alone tend to infer broader probability distributions of these torus model parameters (see Appendix A). In particular, for galaxies with low foreground extinctions the fits with SEDs alone when compared to the fits with SED+spectroscopy produce compatible values (within the values of the probability distributions) of , , and .
Most disagreements in the fitted parameters tend to occur for , , and . Some of these differences are explicable. For instance, and may trade off to yield an approximately constant number of clouds in the inner region. Also, the optical depth of the individual clouds and the average number of clouds along an equatorial ray have a strong influence on the depth of the m silicate feature and the shape of the m emission. Note also that the SED alone fits of some pure type 1 Seyferts always tend to produce the m silicate feature in emission (see Figure 4), while the observations show an almost featureless spectrum (IC 4329A, NGC 3227) or the feature slightly in emission (NGC 4151). For the Seyfert 2s with low host galaxy foreground extinction there is a better agreement for these two parameters between fits with and without mid-IR spectroscopy.
The other important fact to note is that including mid-IR spectroscopy helps assess whether there is an important contribution from extended dust structures causing absorption (and possibly emission too). This is clearly the case for Circinus, NGC 5506, NGC 7172 and NGC 7582, which have relatively deep silicate features. Indeed, the fits to the SEDs alone of Seyfert 2s of RA09, which were done without foreground extinction, only predicted moderately deep silicate features for these galaxies. However, we reiterate that it is not always possible to produced good simultaneous fits to the SEDs and spectroscopy of Seyferts with deep silicate features even when the host galaxy foreground extinction is included. It is possible that for the Seyfert galaxies with the deepest silicate features a clumpy medium in a torus-like configuration may not be appropriate to explain the observations (see e.g., Levenson et al. 2007).
5. Properties of the torus and AGN
5.1. Torus size and Angular width
In this section we discuss the two torus model parameters that can be compared with observations, the torus size and the angular width.
For each AGN, using the parameter and the bolometric luminosity of the system derived from the fits, and Equation 1 we computed the physical radius of the torus. We used the median value of the fitted torus radial thickness and AGN bolometric luminosity. As can be seen from Table 6 the torus radii derived from our fits to the SED+spectroscopy are between and 6 pc. Our fitted physical sizes are consistent with the mid-IR interferometric results that the torus is relatively compact (Tristram et al. 2007, 2009; Burstscher et al. 2009; Raban et al. 2009).
Before we compare the torus radii with the m sizes inferred from mid-IR interferometric observations, it is necessary to discuss some caveats. First, the modelling of the m interferometric observations requires structures on different physical scales, as demonstrated for Circinus and NGC 1068 (see Tristram et al. 2007, 2009; Raban et al. 2009, and Table 1). However, the FWHM sizes of the cooler, more extended component could still be compared with model predictions. Second, Nenkova et al. (2008b) showed that for tori with and various viewing angles, at m of the total flux is enclosed within angular radii of . Here is the angular size at the inner radius of the torus. This is because the m emission traces warm dust, with K, and is rather insensitive to cooler material further from the nuclei. Finally the compact dusty torus is expected to blend into the galaxy disk (e.g., Shi et al. 2006; Packham et al. 2007; Nenkova et al. 2008b), and thus deriving the ¨true size¨ of the torus might not be straightforward.
With these considerations in mind, we can compare the sizes derived from the modelling of the m interferometric data may not be appropriate. However, values of larger than the m sizes from interferometric observations are a necessary, although not sufficient, condition for consistency between our modelling and the interferometric results. There are estimates of the m physical size of the torus through mid-IR interferometry for six galaxies in our sample (see Table 1 for sizes and corresponding references). We find a relatively good agreement, within a factor of two, between the fitted torus sizes444For comparison with the m sizes (FWHM) from mid-IR interferometric observations, the values given in Table 6 need to be multiplied by two. and the sizes inferred from mid-IR interferometry. The galaxy with the largest discrepancy is NGC 7469. Tristram et al. (2009) inferred pc, whereas our fitted torus size is about 5 pc. We note however, that the interferometric observations of NGC 7469 were affected by large uncertainties in the determination of the total flux that may have compromised the derived physical size of the torus of this galaxy.
The torus model width of the angular distribution of the clouds, , is related to the opening angle of the ionization cones, . The latter can be measured from emission line images, usually [O iii]5007 and/or H. Table 1 gives the measured opening angles (measured from the polar direction) for our sample and corresponding references. It is important to note that this comparison is not straightforward because the relation between the true opening angle of the cone and the measured opening angle from line emission depends on the gas distribution. For thin gas disks, Mulchaey, Wilson, & Tsvetanov (1996) simulations showed that cone-shaped emission can be produced for most viewing angles and that the observed angles are less than the true opening angle. We can try to make this comparison for galaxies with the observed widest ionization cones, for which we can set more meaningful upper limits to the widths of the torus. For the two galaxies with (NGC 5506 and NGC 7582, Table 1) the fitted are compatible with the approximate limits set by the observations (). Note however, the difficulties encountered for fitting the observations of these galaxies (Section 4.2).
5.2. AGN Escape Probability
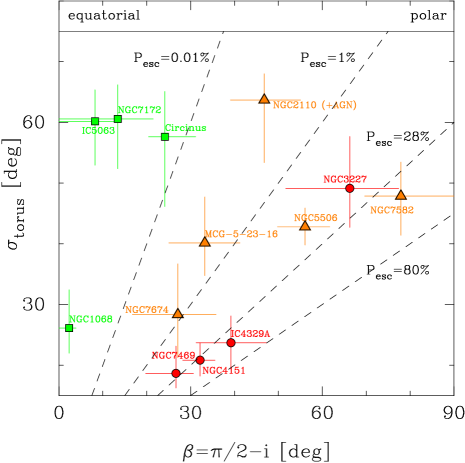
One of most salient properties of the clumpy torus models is that there is always a finite probability for an obscured view of the AGN, irrespective of the viewing angle (Nenkova et al. 2008a,b). While in the simplest version of the unified model type 1s would be observed in directions closer to the pole of the torus (low values of ) than type 2s, in a clumpy medium this is not necessarily so. Indeed, it is possible to have a type 1 viewed at a relatively high provided that the width of the angular size of the torus is small (for a given ), as is the case for NGC 4151 and IC 4329A. Note that two-dimensional posterior distributions of these two galaxies show that the fitted values of and are inversely correlated (Figures B3 and B4 in the Appendix.) Seyfert 2s can also be viewed from any angle, as long as there is at least one cloud along the line of sight. The probability of encountering a cloud is higher for increasing values of , , and . The fact that not all type 2s in our sample require very broad angular distributions (large , e.g., NGC 1068 in Figure 9), suggests that and must be high in those cases. In Figure 9 the error bars reflect the uncertainty around the median of the probability distributions of the fitted parameters.
A more relevant quantity for an AGN to be classified as a type 1 or a type 2 is the probability for an AGN-produced photon to escape unabsorbed (Equation 3). Since the escape probability is a highly non-linear function of , , and , we took full advantage of our Bayesian approach. We thus generated the posterior distributions for from the posterior distributions of the relevant fitted parameters given in Table 5. As can be seen from the values in Table 6, all pure type 1s and type 2s have respectively, relatively high () and low () AGN escape probabilities, as expected. The type 2 Seyferts with broad-lines detected in the near-IR show a range of escape probabilities. We note that these probabilities do not include the effects of foreground extinction.
5.3. Covering Factors and a Receding Torus?
Observational (e.g., Simpson 2005) and theoretical (e.g., Hönig & Beckert 2007) arguments provide evidence of the so-called receding torus (Lawrence 1991). In this scenario the higher fraction of type 1 AGN at high AGN luminosities is explained in terms of a decreasing covering factor of the torus. Furthermore, Hönig & Beckert (2007) and Nenkova et al. (2008b) argued that the decreasing fraction of type 2s at high luminosities not only arises from decreasing , but also from decreasing , or both.
In this work we calculated two different covering factors using our Bayesian approach. The first one is the geometrical covering factor , which does not depend on the viewing angle, and is derived by integrating the AGN escape probability (Equation 3) over all angles as put forward by Mor et al. (2009). If we define , then:
| (4) |
A related quantity is the the ratio between the torus luminosity integrated over the entire wavelength range covered by the torus models (m) and the inferred AGN bolometric luminosity:
| (5) |
This ratio is the apparent covering factor (see Mor et al. 2009), because it depends on the viewing angle (as well as on and ), and can be understood as a reprocessing efficiency. As we did for we generated the posterior distributions for and from the posterior distributions of the relevant fitted parameters given in Table 5. The median values and the values of the distributions of the geometrical covering factor and reprocessing efficiencies of our sample of Seyferts are given in Table 6.
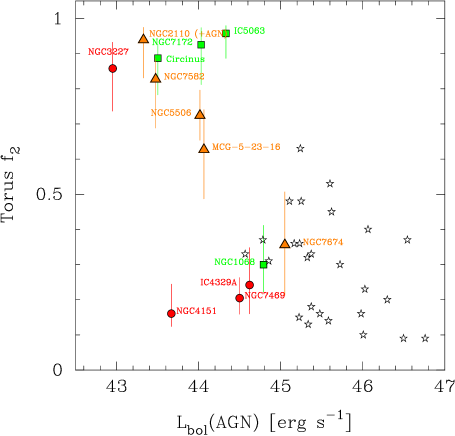
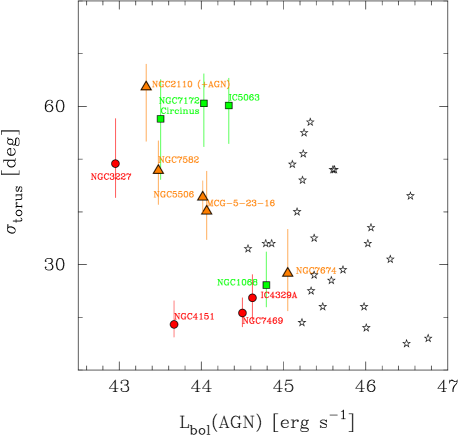
The galaxies in our sample show a range of reprocessing efficiencies, although in general there is no clear dependency with any torus model parameters. In contrast, the torus geometrical covering factor appears to depend on the AGN bolometric luminosity, as can be seen from Figure 10 (left panel). We also included in this comparison high luminosity AGN. These are PG quasars, for which Mor et al. (2009) computed the torus from and as inferred from fits to Spitzer/IRS spectroscopy. We note that these authors also used the Nenkova et al. (2008a,b) torus models, but added extra components to fit their data (see Section 4.1). Mor et al. (2009) calculated the PG quasars AGN bolometric luminosities using the observed optical luminosities (see Mor et al. 2009 for more details). For our sample of Seyfert galaxies the uncertainties in take into account the values around the median of the probability distribution of . When combining the PG quasars of Mor et al. (2009) and our sample of Seyferts, there is a tendency for the torus covering factor to decrease from at low AGN luminosities () to at high luminosities (). Such tendency for the torus covering factor to decrease with the bolometric luminosity of the AGN was already noted for PG quasars by Mor et al. (2009) when including an additional hot black-body component to fit their data.
A similar trend may also be present when comparing vs. , with high luminosity AGN having narrower cloud angular distributions (Figure 10, right panel) than low luminosity ones. We also found in Section 4 that on average Seyfert galaxies (with bolometric luminosities in the range ) are fitted with more clouds along a radial equatorial ray than PG quasars (bolometric luminosities ). Given these trends, it is not surprising that the torus geometrical covering factor , which depends on both and , tends to be lower in the most luminous objects in our sample than in the less luminous ones.
The decreased torus covering factor at high AGN luminosities may provide some support for a receding torus at high luminosities. We note however, that in these comparisons there are few type 2 objects at high AGN luminosities, so we cannot rule out a possible dependency of with the AGN type. That is, type 2s might have wider tori than type 1s as suggested by the results of RA11. Finally a note of caution. A large fraction of the low luminosity AGN in our sample with wide angular cloud distributions are in highly inclined galaxies. Therefore, we cannot exclude the possibility that contamination from extended dust features not directly related to the dusty torus has resulted in large fitted values of . Finally, as we explained in Section 2.1, our sample is not complete, and may not be representative, and thus this result needs to be explored for a complete sample.
6. Summary and Conclusions
This is the third paper in a series performing detailed fits to the unresolved IR emission of AGN using the clumpy torus models of Nenkova et al. (2008b). In the first two papers of the series (RA09 and RA11) we fitted only the photometric SEDs, while in this paper we also included high angular resolution () ground-based mid-IR spectroscopy. The sample in this work is composed of 13 nearby (at a median distance of 31 Mpc) Seyfert galaxies with bolometric luminosities . The sample contains pure type 1 and type 2 Seyferts, as well as Seyfert 2s with broad-lines detected in the near-IR. The galaxies also span a range in the observed strength of the m silicate feature, going from mild emission to deep absorption, and in X-ray column densities, from Compton thin to Compton thick objects.
We compiled near and mid-IR imaging and spectroscopy data taken with high-angular resolution (). We also presented new ground-based mid-IR spectroscopic observations in the -band of NGC 4151 and in the -band of NGC 1068. We have used an interpolated version of the clumpy torus models of Nenkova et al. (2008a,b and 2010) and a Bayesian approach to fit together the photometric SEDs and mid-IR spectroscopy. The fits provided the probability distributions for the six torus model parameters that describe the CLUMPY models (see Table 3), plus the AGN bolometric luminosity. We included the effects of foreground extinction in the host galaxy for galaxies with evidence of extended dust structures and mag. When compared to fits done using SEDs alone, the fits to the SED+spectroscopy data result in smaller uncertainties (narrower probability distributions) for the angular distribution of the clouds , torus radial thickness , and viewing angle .
The interpolated version of the Nenkova et al. (2008a,b; 2010) clumpy torus models provided good fits to the photometric SEDs and mid-IR spectroscopy of our sample, and in particular for those Seyfert galaxies with low or moderate foreground extinctions (mag). For three AGN with relatively deep m silicate features and hosted in inclined galaxies with prominent dust lanes (NGC 5506, NGC 7172, and NGC 7582), we were not able to fit simultaneously the photometric SEDs and mid-IR spectroscopy. These three galaxies show evidence of extended dust structures on tens of parsec scales, not directly related to the dusty torus. In contrast, we were able to fit reasonably well the data of Circinus. One possibility is that because Circinus is the closest galaxy in our sample (distance of 4 Mpc), the contamination by extended dusty structures is reduced.
CLUMPY models with small tori (torus radial thickness in the range ) provided adequate fits to the data. Combining the modelled AGN bolometric luminosities and the values of , we inferred that the physical radii of the tori of Seyfert galaxies are between pc and 6 pc. For the six galaxies in our sample with m sizes derived in the literature from the modelling of mid-IR interferometric observations, we found a reasonably good agreement.
The Nenkova et al. (2008b) models were also able to produce good fits to mid-IR high angular resolution spectroscopy, in terms of the shape of the silicate feature and continuum slope and not only the apparent strength of the feature. When combined with the photometric SEDs, the mid-IR spectroscopy allowed us to constrain the number of clouds along radial equatorial rays and the optical depth of the individual clouds . We find that the tori of Seyfert galaxies have typically , and the optical depth of the clouds are in the range . By comparison the tori of PG quasars () appear to contain fewer clouds along radial equatorial rays, typically , with optical depths of (Mor et al. 2009).
From the scaling of the models to the data we derived the AGN bolometric luminosities, which were in good agreement with those derived with other methods in the literature. As also found by RA11, the viewing angle is not the only parameter controlling the classification of a galaxy into a type 1 or a type 2. For instance, type 2s tend to be viewed at directions closer to the equatorial plane of the torus, but small values of are permitted as long as there is one cloud along the LOS. This is because in clumpy media, there is always a finite probability for an AGN photon to escape absorption, and this probability is a function of , , and . From our fits, we found that this probability is relatively high in type 1s (), while it is found to be low in pure type 2s ().
We finally discussed the possibility of a receding torus. We compared the results for our sample of relatively low luminosity AGN with those of the PG quasars analyzed by Mor et al. (2009). Both samples combined together span a range of . We found that high luminosity AGN () tend to have lower torus covering factors ( because they have narrower tori (smaller ) and contain fewer clouds along radial equatorial rays . In contrast lower luminosity ones (at ) tend to have high covering factors (). This might explain the decreased observed fraction of type 2 AGN at high luminosities. We note however, that this result may be subject to some caveats. In particular most of the AGN in our sample at the low end of are hosted in highly inclined galaxies, and it is possible that contamination by extended dust components not related to the dusty torus results in larger fitted values of . Also, as discussed in Section 2.1, our sample is not complete, and in particular there are very few type 2s at high AGN luminosities. Therefore our results need to be explored further, and to this end we have been allocated time on the Gran Telescopio Canarias with the mid-IR instrument CanariCam (Telesco et al. 2003) for a large mid-IR survey of AGN (Levenson et al. 2008).
Appendix A Marginal Posterior Distributions
Here we present the marginal posterior distributions of the fits to the SED+spectroscopy and SED alone for all the galaxies in the sample except for IC 4329A, which is shown in Figure 7.
![[Uncaptioned image]](/html/1105.2368/assets/x22.png)
Fig. A1.— Marginal posterior distributions of the free parameters that describe the CLUMPY models resulting from fitting the data for NGC 3227. The SED alone fits are shown in orange and the SED+spectroscopy fits are shown in blue. The solid and dashed lines indicate the MAP and median values of the distributions, and the shaded areas are the values. We did not use a foreground extinction.
![[Uncaptioned image]](/html/1105.2368/assets/x23.png)
Fig. A2.— Same as Figure A1 but for NGC 4151.
![[Uncaptioned image]](/html/1105.2368/assets/x24.png)
Fig. A3.— Same as Figure A1 but for NGC 7469.
![[Uncaptioned image]](/html/1105.2368/assets/x25.png)
Fig. A4.— Same as Figure A1 but for Circinus. We fixed the foreground extinction to mag (Maiolino et al. 2000). We restricted the viewing angle to the range .
![[Uncaptioned image]](/html/1105.2368/assets/x26.png)
Fig. A5.— Same as Figure A1 but for IC 5063. We did not restrict any of the torus model parameters. The foreground extinction was fixed to Amag based on results by Heisler & de Robertis (1999).
![[Uncaptioned image]](/html/1105.2368/assets/x27.png)
Fig. A6.— Same as Figure A1 but for NGC 1068. We restricted the viewing angle to the range (see Section 3.3).
![[Uncaptioned image]](/html/1105.2368/assets/x28.png)
Fig. A7.— Same as Figure A1 but for NGC 7172. Only the SED+spectroscopy fit is shown due to the limited number of photometric points in the near-IR. We did not restrict any of the torus model parameters. The foreground extinction was fixed to mag.
![[Uncaptioned image]](/html/1105.2368/assets/x29.png)
Fig. A8.— Same as Figure A1 but for MCG 5-23-16. The viewing angle was restricted to a Gaussian distribution centered at with a 10° width (see Section 3.3). The foreground extinction was fixed to Amag based on results by Veilleux et al. (1997).
![[Uncaptioned image]](/html/1105.2368/assets/x30.png)
Fig. A9.— Same as Figure A1 but for NGC 2110. The viewing angle was restricted to a Gaussian distribution centered at with a 10° width (see Section 3.3). Only the SED+spectroscopy fit is shown due to the limited number of photometric points in the near-IR. The foreground extinction was fixed to mag (Storchi-Bergman et al. 1999).
![[Uncaptioned image]](/html/1105.2368/assets/x31.png)
Fig. A10.— Same as Figure A1 but for NGC 5506. The viewing angle was restricted to a Gaussian distribution centered at with a 10° width (see Section 3.3). The foreground extinction was fixed to mag (Goodrich et al. 1994).
![[Uncaptioned image]](/html/1105.2368/assets/x32.png)
Fig. A11.— Same as Figure A1 but for NGC 7582. We did not restrict any of the torus model parameters. The foreground extinction was fixed to mag (Winge et al. 2000).
![[Uncaptioned image]](/html/1105.2368/assets/x33.png)
Fig. A12.— Same as Figure A1 but for NGC 7674. Model fits are for torus emission alone. We did not restrict any of the torus model parameters. The foreground extinction was fixed to mag.
Appendix B Notes on individual sources
In this section we discuss in detail the fits to individual sources and compare them with similar fits done in the literature with clumpy dusty torus models. We also show in Figures B1 to B4 the two-dimensional marginal distributions of four selected sources: Circinus, NGC 1068, NGC 4151, and IC 4239A. In these figures the contours indicate the and confidence regions. These two-dimensional distributions can be used to assess whether or not certain torus model parameters are correlated.
Circinus. Circinus is a Seyfert 2 galaxy located at a distance of 4 Mpc. The water maser observations of this galaxy (Greenhill et al. 2003) trace a warped edge-on disk, thus indicating that the torus is seen at a high inclination. We then used the viewing angle as a prior for our fits and restricted it to the range . The fit to the photometric SED and mid-IR spectroscopy is shown in Figure 5, while the marginal posterior distributions are in Figure A4. As can be seen from the latter figure all the torus model parameters are nicely constrained and our estimated value of the AGN bolometric luminosity is in excellent agreement with that of Moorwood et al. (1996). Figure B1 shows that the fitted torus model parameters of Circinus are not degenerate at the 68% confidence level
Schartmann et al. (2008) fitted the photometric SED and mid-IR spectroscopy of Circinus using their clumpy torus models, although due to long computational times they did not explore the entire parameter space of their models. They found an appropriate fit for the SED+spectroscopy as well as for the mid-IR interferometric visibilities with , (this is equivalent to our parameter) and ( is equivalent to our parameter). These are in excellent agreement with our fits using the interpolated version of the Nenkova et al. (2008b) models of , , and (see Table 5). The largest disagreement is in the torus size since their modelling favors an outer radius of 30 pc. Our fitted AGN bolometric luminosity sets the dust sublimation radius (see Equation 1) of Circinus at pc, whereas the fitted radial extent of the torus translates into an outer radius of pc (see Table 5).
NGC 1068. NGC 1068 is a Seyfert 2 galaxy at a distance of 15 Mpc. As with Circinus, the water maser observations (Greenhill et al. 1996) suggest that the torus is viewed at a high inclination. We used as a prior for our fits. The fit to the photometric SED and mid-IR spectroscopy is shown in Figure 5. We note that the Nenkova et al. (2008a, b) models provide an excellent fit to the photometric SED as well as to the -band and the -band spectroscopy of this galaxy. The marginal posterior distributions of NGC 1068 are shown in Figure A6, while the the two-dimensional marginal distributions are shown in Figure B2. These figures indicate that all the fitted torus model parameters for NGC 1068 are nicely constrained. From our fits we derived an AGN bolometric luminosity of , which is in good agreement with the estimates of Bock et al. (2000) and Vasudevan et al. (2010).
Hönig, Prieto, & Beckert (2008) modelled the IR SED and VLTI/MIDI data using the Hönig et al. (2006) models. Their modeled torus was found to have a line-of-sight inclination of with the clouds are distributed according to a power law of , a half opening angle of the torus of . The average number of clouds, which obscure the AGN along the line of sight towards the observer, was . Their fitted torus model parameters are in a relatively good agreement with our fitted values of , , , and (see Table 5). Hönig et al. (2008) also estimated the diameter of the dust torus to be pc, depending on wavelength and orientation, whereas our fitted diameter is 4 pc.
![[Uncaptioned image]](/html/1105.2368/assets/x34.png)
![[Uncaptioned image]](/html/1105.2368/assets/x35.png)
![[Uncaptioned image]](/html/1105.2368/assets/x36.png)
Fig. B1. — Circinus. Two-dimensional marginal posterior distributions (joint distributions) for all combinations of the six torus model parameters for the SED+spectroscopy fit. The contours indicate the regions at (solid lines) and (dashed lines) confidence levels. See Asensio Ramos & Ramos Almeida (2009) for more details.
![[Uncaptioned image]](/html/1105.2368/assets/x37.png)
![[Uncaptioned image]](/html/1105.2368/assets/x38.png)
![[Uncaptioned image]](/html/1105.2368/assets/x39.png)
Fig. B2.— As Figure B1 but for NGC 1068.
![[Uncaptioned image]](/html/1105.2368/assets/x40.png)
![[Uncaptioned image]](/html/1105.2368/assets/x41.png)
![[Uncaptioned image]](/html/1105.2368/assets/x42.png)
Fig. B3.— As Figure B1 but for NGC 4151.
![[Uncaptioned image]](/html/1105.2368/assets/x43.png)
![[Uncaptioned image]](/html/1105.2368/assets/x44.png)
![[Uncaptioned image]](/html/1105.2368/assets/x45.png)
Fig. B4.— As Figure B1 but for IC 4329A.
Type 1s: IC 4329A, NGC 3227, and NGC 7469. These three Seyfert 1s are in common with the work of Hönig et al. (2010). They modelled the mid-IR spectroscopy of a sample of AGN using their newest clumpy torus models (Hönig & Kishimoto 2010). Hönig et al. (2010) showed that the mid-IR spectroscopy provides sensitive constraints to the number of clouds along the equatorial direction and the index of power law ( in their notation) of the cloud distribution. They fixed other torus parameters such as the opening angle (), the radial extent to , (see Hönig & Kishimoto 2010 for a detailed discussion). We note that their model parameters were also chosen to provide good estimates of the VLTI/MIDI observed visibilities (see Hönig et al. 2010 for more details). For the three Seyfert 1 galaxies in common with our study they find indexes of the power law distribution of and , for their assumed typical viewing angles of . These compare well with our fitted values of , although we tend to find slightly more clouds along the equatorial line of sight (see Table 5).
Type 2s: IC 5063, MCG 5-23-16, NGC 2110, and NGC 7674. These four type 2 galaxies in our sample are in common with the work of Hönig et al. (2010). They modelled the mid-IR spectroscopy of these galaxies with the same parameters as the type 1s in the previous section but with typical viewing angles of . Their modelling finds indexes of the power law distribution of the clouds and . More clouds along the equatorial line of sight are allowed in their modelling if the viewing angles for Seyfert 2s are smaller (). Our fitted values of , except for NGC 2110, are consistent with their highest values of , whereas we find (median values, see Table 5).
References
- Alloin et al. (2000) Alloin, D., Pantin, E., Lagage, P. O., & Granato, G. L. 2000, A&A, 363, 926
- Alonso-Herrero et al. (1996) Alonso-Herrero, A., Ward, M. J., & Kotilainen, J. K. 1996, MNRAS, 278, 902
- Alonso-Herrero et al. (1997) Alonso-Herrero, A., Ward, M. J., & Kotilainen, J. K. 1997, MNRAS, 288, 977
- Alonso-Herrero et al. (1998) Alonso-Herrero, A., Simpson, C., Ward, M. J., & Wilson, A. S. 1998, ApJ, 495, 196
- Alonso-Herrero et al. (2001) Alonso-Herrero, A., Quillen, A. C., Simpson, C., Efstathiou, A., & Ward, M. J. 2001, AJ, 121, 136
- Alonso-Herrero et al. (2003) Alonso-Herrero, A., Quillen, A. C., Rieke, G. H., Ivanov, V. D., & Efstathiou, A. 2003, AJ, 126, 81
- Alonso-Herrero et al. (2006) Alonso-Herrero, A., Colina, L., Packham, C., Díaz-Santos, T., Rieke, G. H., Radomski, J. T., & Telesco, C. M. 2006, ApJ, 652, L83
- Antonucci & Miller (1985) Antonucci, R., & Miller, J. 1985, ApJ, 297, 621
- Antonucci (1993) Antonucci, R. 1993, ARA&A, 31, 473
- Asensio Ramos & Ramos Almeida (2009) Asensio Ramos, A., & Ramos Almeida, C. 2009, ApJ, 696, 2075
- Barvainis (1987) Barvainis, R. 1987, ApJ, 320, 537
- Beckmann et al. (2005) Beckmann, V., et al. 2005, ApJ, 634, 939
- Bianchi et al. (2009) Bianchi, S., Piconcelli, E., Chiaberge, M., Jiménez Bailón, E., Matt, G., & Fiore, F. 2009, ApJ, 695, 781
- Blanco et al. (1990) Blanco, P. R., Ward, M. J., & Wright, G. S. 1990, MNRAS, 242, 4
- Bock et al. (2000) Bock, J. J. et al. 2000, AJ, 120, 2904
- Bohlin et al. (1978) Bohlin R. C., Savage B. D., & Drake J. F., 1978, ApJ, 224, 132
- Burtscher et al. (2009) Burtscher, L. et al. 2009, ApJ, 705, L53
- Chiar & Tielens (2006) Chiar, J. E., & Tielens, A. G. G. M. 2006, ApJ, 637, 774
- Colina et al. (1991) Colina, L., Sparks, W. B., & Macchetto, F. 1991, ApJ, 370, 102
- Colling et al. (2009) Colling, M. D., Roche, P. F., & Mason, R. E. 2009, MNRAS, 394, 2043
- Davies et al. (2006) Davies, R. I. et al. 2006, ApJ, 646, 754
- Davies et al. (2007) Davies, R. I. et al. 2007, ApJ, 671, 1388
- de Vaucouleurs et al. (1991) de Vaucouleurs, G., de Vaucouleurs, A., Corwin, H. G. Jr., Buta, R. J., Paturel, G., & Fouque, P. 1991, in Third Reference Catalogue of Bright Galaxies, Volume 1-3, XII, 2069 pp. 7 figs.. Springer-Verlag Berlin Heidelberg New York
- Deo et al. (2009) Deo, R. P., Richards, G. T., Crenshaw, D. M., & Kraemer, S. B. 2009, ApJ, 705, 14
- Efstathiou & Rowan-Robinson (1995) Efstathiou, A., & Rowan-Robinson, M. 1995, MNRAS, 273, 649
- Elitzur (2008) Elitzur, M. 2008, NewAR, 52, 274
- Elvis et al. (1994) Elvis, M., et al. 1994, ApJS, 95, 1
- Gallimore & Matthews (2003) Gallimore, J. F., & Matthews, L. D. 2003, ASPC, 290, 501
- Glass (2004) Glass, I. S. 2004, MNRAS, 350, 1049
- Glasse et al. (1997) Glasse, A. C., Atad-Ettedgui, E. I., & Harris, J. W. 1997, in Proc. SPIE 2871, Optical Telescopes of Today and Tomorrow, ed.A. L.Ardeberg (Bellingham, WA: SPIE), 1197–1203
- Goodrich et al. (1994) Goodrich, R. W., Veilleux, S., & Hill, G. J. 1994, ApJ, 422, 521
- Granato & Danese (1994) Granato, G. L., & Danese, L. 1994, MNRAS, 268, 235
- Greenhill et al. (1996) Greenhill, L. J., Gwinn, C. R., Antonucci, R., & Barvainis, R. 1996, ApJ, 472, L21
- Greenhill et al. (2003) Greenhill, L. J., et al. 2003, ApJ, 590, 162
- Guainazzi et al. (1994) Guainazzi, M. et al. 1999, ApJ, 436, L35
- Guainazzi et al. (2005) Guainazzi, M., Matt, G., & Perola, G. C. 2005, A&A, 444, 119
- Guainazzi et al. (2010) Guainazzi, M., et al. 2010, MNRAS, 406, 2013
- Hao et al. (2007) Hao, L., Weedman, D. W., Spoon, H. W. W., Marshall, J. A., Levenson, N. A., Elitzur, M., & Houck, J. R. 2007, ApJ, 655, L77
- Heisler & de Robertis (1999) Heisler, C. A., & de Robertis, M. M. 1999, AJ, 118, 2023
- Hicks et al. (2009) Hicks, E. K. S. et al. 2009, ApJ, 696, 448
- Hönig & Kishimoto (2010) Hönig, S. F., & Kishimoto, M. 2010, A&A, 523, 27
- Hönig et al. (2010) Hönig, S. F., Kishimoto, M., Gandhi, P., Smette, A., Asmus, D., Duschl, W., Polletta, M., & Weigelt, G. 2010, A&A, 515, 23
- Hönig et al. (2008) Hönig, S. F., Prieto, M. A. & Beckert, T. 2008, A&A, 485, 33
- Hönig & Beckert (2007) Hönig, S. F., & Beckert, T. 2007, MNRAS, 380, 1172
- Hönig et al. (2006) Hönig, S. F., Beckert, T., Ohnaka, K., & Weigelt, G. 2006, A&A, 452, 459
- Horst et al. (2008) Horst, H., Gandhi, P., Smette, A., & Duschl, W. J. 2008, A&A, 479, 389
- Imanishi (2000) Imanishi, M. 2000, MNRAS, 313, 165
- Jaffe et al. (2004) Jaffe, W. et al. 2004, Nature, 429. 47
- Jarrett et al. (2003) Jarrett, T. H. et al. 2003, AJ, 125, 525
- Koshida et al. (2009) Koshida, S. et al. 2009, ApJ, 700, L109
- Kishimoto et al. (2007) Kishimoto, M., Hönig, S. F., Beckert, T., & Weigelt, G. 2007, A&A, 476, 713
- Kishimoto et al. (2009) Kishimoto, M., Hönig, S. F., Antonucci, R., Kotani, T., Barvainis, R., Tristram, K. R. W., & Weigelt, G. 2009, A&A, 507, L57
- Kotilainen et al. (1992) Kotilainen, J. K., Ward, M. J., Boisson, C., Depoy, D. L., Smith, M. G., & Bryant, L. R. 1992, MNRAS, 256, 125
- Kulkarni et al. (1998) Kulkarni, V. et al. 1998, ApJ, 492, L121
- Lawrence et al. (1985) Lawrence, A., Ward, M., Elvis, M., Fabbiano, G., Willner, S. P., Carleton, N. P., & Longmore, A. 1985, ApJ, 291, 117
- Lawrence (1991) Lawrence, A. 1991, MNRAS, 252, 586
- Leinert et al. (2003) Leinert, C. et al. 2003, ApSS, 286, 73
- Levenson et al. (2007) Levenson, N. A., Sirocky, M. M., Hao, L., Spoon, H. W. W., Marshall, J. A., Elitzur, M., & Houck, J. R. 2007, ApJ, 654, L45
- Levenson et al. (2008) Levenson, N. A. et al. 2008, SPIE, 7014, 83
- Lira et al. (2011) Lira, P., et al. 2011, ApJ, in preparation
- Maiolino et al. (1994) Maiolino, R., Stanga, R., Salvati, M., & Rodríguez Espinosa, J. M. 1994, A&A, 290, 40
- Maiolino & Rieke (1995) Maiolino, R., & Rieke, G. H. 1995, ApJ, 454, 95
- Maiolino et al. (2000) Maiolino, R., Alonso-Herrero, A., Anders, S., Quillen, A., Rieke, M. J., Rieke, G. H., & Tacconi-Garman, L. E. 2000, ApJ, 531, 219
- Malaguti et al. (1998) Malaguti, G. et al. 1998, A&A, 331, 519
- Malkan et al. (1998) Malkan, M. A., Gorjian, V., & Tam, R. 1998, ApJS, 117, 25
- Marco & Alloin (2000) Marco, O., & Alloin, D. 2000, A&A, 353, 465
- Martini et al. (2001) Martini, P., Pogge, R. W., Ravindranath, S., & An, J. H. 2001, ApJ, 562, 139
- Martini et al. (2003) Martini, P., Regan, M. W., Mulchaey, J. S., & Pogge, R. W. 2003, ApJ, 589, 774
- Mason et al. (1996) Mason, R. E., Geballe, T. R., Packham, C., Levenson, N., Elitzur, M. et al. 2006, ApJ, 640, 612
- Mason et al. (2007) Mason, R. E., Levenson, N. A., Packham, C., Elitzur, M., Radomski, J., Petric, A. O., & Wright, G. S. 2007, ApJ, 659, 241
- Mason et al. (2009) Mason, R. E., Levenson, N. A., Shi, Y., Packham, C., Gorjian, V., Cleary, K., Rhee, J., & Werner, M. 2009, ApJ, 693, L136
- Matt et al. (1999) Matt, G. et al. 1999, A&A, 341, L39
- Matt et al. (2000) Matt, G. et al. 2000, MNRAS, 318, 173
- Moorwood et al. (1996) Moorwood, A. F. M. et al. 1996, A&A, 315, L109
- Mor et al. (2009) Mor, R., Netzer, H., & Elitzur, M. 2009, ApJ, 705, 298
- Mulchaey et al. (1994) Mulchaey, J. S. et al. 1994, ApJ, 436, 586
- Mulchaey et al. (1996) Mulchaey, J. S., Wilson, A. S., & Tsvetanov, Z. 1996, ApJ, 467, 197
- Mundell et al. (1995) Mundell, C. G. et al. 1995, MNRAS, 275, 67
- Nagar et al. (1999) Nagar, N. M., Wilson, A. S., Mulchaey, J. S., & Gallimore, J. E. 1999, ApJS, 120, 209
- Nagar et al. (2002) Nagar, N. M., Oliva, E., Marconi, A. & Maiolino, R. 2002, A&A, 391, L21
- Nenkova et al. (2002) Nenkova, M., Ivezic, Z., & Elitzur, M. 2002, ApJ, 570, L9
- Nenkova et al. (2008a) Nenkova, M., Sirocky, M. M., Ivezić, Z., & Elitzur, M. 2008a, ApJ, 685, 145
- Nenkova et al. (2008b) Nenkova, M., Sirocky, M. M., Nikkuta, R., Ivezić, Z., & Elitzur, M. 2008b, ApJ, 685, 160
- Nenkova et al. (2010) Nenkova, M., Sirocky, M. M., Nikkuta, R., Ivezić, Z., & Elitzur, M. 2010, ApJ, 723, 1827
- Nikutta et al. (2009) Nikutta, R., Elitzur, M., & Lacy, M. 2009, ApJ, 707, 1550
- Oliva et al. (1994) Oliva, E., Salvati, M., Moorwood, A. F. M., & Marconi, A. 1994, A&A, 288, 457
- Ossenkopf et al. (1992) Ossenkopf, V., Henning, T., & Mathis, J. S. 1992, A&A, 261, 567
- Osterbrock & Martel (1993) Osterbrock, D. E. & Martel, A. 1993, ApJ, 414, 552
- Packham et al. (1997) Packham, C., Young, S., Hough, J. H., Axon, D. J., & Bailey, J. A. 1997, MNRAS, 288, 375
- Packham et al. (2005) Packham, C. et al. 2005, ApJ, 618, L17
- Packham et al. (2007) Packham, C. et al. 2007, ApJ, 661, L29
- Perola et al. (2002) Perola, G. C. et al. 2002, A&A, 389, 802
- Pier & Krolik (1993) Pier, E. A., & Krolik, J. H. 1993, ApJ, 418, 673
- Pogge (1989) Pogge, R. W. 1989, ApJ, 345, 730
- Polletta et al. (2008) Polletta, M., Weedman, D., Hönig, S., Lonsdale, C. J., Smith, H. E., & Houck, J. 2008, ApJ, 675, 960
- Pott et al. (2010) Pott, J.-U., Malkan, M. A., Elitzur, M., Ghez, A. M., Herbst, T. M., Schödel, R., & Woillez, J. 2010 ApJ, 715, 736
- Prieto et al. (2010) Prieto, M. A., Reunanen, J., Tristram, K. R. W., Neumayer, N., Fernandez-Ontiveros, J. A., Orienti, M., & Meisenheimer, K. 2010, MNRAS, 402, 724
- Quillen et al. (1999) Quillen, A. C., Alonso-Herrero, A., Rieke, M. J., Rieke, G. H., Ruiz, M., & Kulkarni, V. 1999, ApJ, 527, 696
- Quillen et al. (2000) Quillen, A. C., Shaked, S., Alonso-Herrero, A., McDonald, C., Lee, A., Rieke, M. J., & Rieke, G. H. 2000, ApJ, 532, L17
- Quillen et al. (2001) Quillen, A. C., McDonald, C., Alonso-Herrero, A., Lee, A., Shaked, S., Rieke, M. J., & Rieke, G. H. 2001, ApJ, 547, 129
- Raban et al. (2009) Raban, D. et al. 2009, MNRAS, 394, 1325
- Radomski et al. (2003) Radomski, J. T. et al. 2003, ApJ, 587, 117
- Ramos Almeida et al. (2009a) Ramos Almeida, C., Pérez-García, A. M., & Acosta-Pulido, J. A. 2009, ApJ, 694, 1379
- Ramos Almeida et al. (2009b) Ramos Almeida, C., Levenson, N. A., Rodríguez Espinosa, J. M., Alonso-Herrero, A., Asensio Ramos, A., Radomski, J., T., Packham, C., Fisher, R. S., & Telesco, C. M. 2009, ApJ, 702, 1127 (RA09)
- Ramos Almeida et al. (2011) Ramos Almeida, C., Levenson, N. A., Alonso-Herrero, A., Asensio Ramos, A., Rodríguez Espinosa, J. M., Pérez-García, A. M., Packham, C., Mason, R., Radomski, J. T., & Díaz-Santos, T. 2011, ApJ, 731, 92 (RA11)
- Reeves et al. (2007) Reeves, J. N. et al. 2007, PASP, 59, 301
- Regan & Mulchaey (1999) Regan, M. W., & Mulchaey, J. S. 1999, AJ, 117, 2676
- Reunanen et al. (2003) Reunanen, J., et al. 2003, MNRAS, 343, 192
- Reunanen et al. (2010) Reunanen, J., Prieto, M. A., & Siebenmorgen, R. 2010, MNRAS, 402, 879
- Riffel et al. (2006) Riffel, R., Rodríguez-Ardila, A., & Pastoriza, M. G. 2006, A&A, 457, 61
- Risaliti et al. (1999) Risaliti, G., Maiolino, R., & Salvati, M. 1999, ApJ, 522, 157
- Roche et al. (1991) Roche, P. F., Aitken, D. K., Smith, C. H., & Ward, M. J. 1991, MNRAS, 248, 606
- Roche et al. (2006) Roche, P. F., Packham, C. Telesco, C. M., Radomski, J. T., Alonso-Herrero, A., Aitken, D. K., Colina, L., & Perlman, E. 2006, MNRAS, 367, 1689
- Roche et al. (2007) Roche, P. F., Packham, C. Aitken, D. K., & Mason, R. E. 2007, MNRAS, 375, 99
- Ruiz et al. (1994) Ruiz, M., Rieke, G. H., & Schmidt, G. D. 1994, ApJ, 423, 608
- Schartmann et al. (2008) Schartmann, M., Meisenheimer, K., Camenzind, M., Wolf, S., Tristram, K. R. W., & Henning, T. 2008, A&A, 482, 67
- Schmitt et al. (2003) Schmitt, H.R. et al. 2003, ApJS, 148, 327
- Shi et al. (2006) Shi, Y., et al. 2006, ApJ, 653, 127
- Siebenmorgen et al. (2004) Siebenmorgen, R., Krügel, E., & Spoon, H. W. W. 2004, A&A, 414, 123
- Simpson (2005) Simpson, C. 2005, MNRAS, 360, 565
- Sirocky et al. (2008) Sirocky, M. M., Levenson, N., A., Elitzur, M., Spoon, H. W. W., & Armus, L. 2008, ApJ, 678, 729
- Storchi-Bergman et al. (1999) Storchi-Bergman, T., Winge, C., Ward, M. J., & Wilson, A. S. 1999, MNRAS, 304, 25
- Suganuma et al. (2006) Suganuma, M. et al. 2006, ApJ, 639, 46
- Telesco et al. (1998) Telesco, C. M., Pina, R. K., Hanna, K. T., Julian, J. A., Hon, D. B., & Kisko, T. M., 1998, Proc. SPIE, 3354, 534
- Telesco et al. (2003) Telesco, C. M. et al. 2003, SPIE, 4841, 913
- Thompson et al. (2009) Thompson, G. D., Levenson, N. A., Uddin, S. A., & Sirocky, M. M. 2009, ApJ, 697, 182
- Tomono et al. (2001) Tomono, D., Doi, Y.,Usuda, T., & Nishimura, T. 2001, ApJ, 557, 637
- Tran et al. (1992) Tran, H. D., Miller, J. S., & Kay, L. E. 1992, ApJ, 397, 452
- Tristram et al. (2007) Tristram, K. R. W. et al. 2007, A&A, 474, 837
- Tristram et al. (2009) Tristram, K. R. W. et al. 2009, A&A, 502, 67
- Vasudevan et al. (2010) Vasudevan, R. V., Fabian, A. C., Gandhi, P., Winter, L. M., & Mushotzky, R. F. 2010, MNRAS, 402, 1081
- Veilleux et al. (1997) Veilleux, S., Goodrich, R. W., & Hill, G. J. 1997, ApJ, 477, 631
- Veron-Cetty & Veron (2006) Véron-Cetty, M.-P., & Véron, P. 2006, A&A, 455, 773
- Videla et al. (2011) Videla, L., et al. 2011, ApJ, in preparation
- Ward et al. (1987) Ward, M., Elvis, M., Fabbiano, G., Carleton, N. P., Willner, S. P. & Lawrence, A. 1987, ApJ, 315, 74
- Weaver & Reynolds (1998) Weaver, K. A., & Reynolds, C. S. 1998, ApJ, 503, L39
- Wilson et al. (1985) Wilson, A. S., Baldwin, J. A., & Ulvestad, J. S. 1985, ApJ, 291, 627
- Wilson & Tsvetanov (1994) Wilson, A. S. & Tsvetanov, Z. I. 1994, ApJ, 107, 1227
- Winge et al. (2000) Winge, C., Storchi-Bergmann, T., Ward, M. J., & Wilson, A. S. 2000, MNRAS, 316, 1
- Woo & Urry (2002) Woo, J.-H., & Urry, C. M. 2002, ApJ, 579, 530
- Young et al. (2007) Young, S., Packham, C., Mason, R. E., Radomski, J. T., & Telesco, C. M. 2007, MNRAS, 378, 888