Separation of VUV/UV photons and reactive particles in the effluent of a He/O2 atmospheric pressure plasma jet
Abstract
Cold atmospheric pressure plasmas can be used for treatment of living tissues or for inactivation of bacteria or biological macromolecules. The treatment is usually characterized by a combined effect of UV and VUV radiation, reactive species, and ions. This combination is usually beneficial for the effectiveness of the treatment but it makes the study of fundamental interaction mechanisms very difficult. Here we report on an effective separation of VUV/UV photons and heavy reactive species in the effluent of a micro scale atmospheric pressure plasma jet (-APPJ). The separation is realized by an additional flow of helium gas under well-defined flow conditions, which deflects heavy particles in the effluent without affecting the VUV and UV photons. Both components of the effluent, the photons and the reactive species, can be used separately or in combination for sample treatment. The results of treatment of a model plasma polymer film and vegetative Bacillus subtilis and Escherichia coli cells are shown and discussed. A simple model of the He gas flow and reaction kinetics of oxygen atoms in the gas phase and at the surface is used to provide a better understanding of the processes in the plasma effluent. The new jet modification, called X-Jet for its appearance, will simplify the investigation of interaction mechanisms of atmospheric pressure plasmas with biological samples.
I Introduction
Cold atmospheric pressure plasmas (CAP) are increasingly in the focus of researchers investigating their possible applications in medicine or the food packaging industry Kong2009 (1, 2). CAP jets are able to inactivate bacteria Daeschlein2010 (3), fungi Daeschlein2010a (4), or bio-macromolecules Deng2007 (5) and offer an alternative to standard sterilization methods, where thermo-labile and vacuum-sensitive objects (plastics or living tissues) have to be treated. In addition, several studies indicate that CAP treatment can accelerate wound healing or influence cancer cells Fridman2007 (6, 7). These plasmas can be filamentary or glow dielectric barrier discharges (DBD) with few kV voltages, usually pulsed at kHz frequencies Dobrynin2009 (8, 9), DBD based jets with so called plasma bullets Cao2009 (10, 11, 12), or homogeneous glow discharges generated in RF-MW frequencies in form of plasma jets Schulz-vonderGathen2007 (13, 2, 14). The term ”cold” refers to temperatures in the plasma effluent close to room temperature allowing direct treatment for instance of skin or thermolabile polymers. These plasmas are operated in air or air-containing gas mixtures. Alternatively they use only He with or without admixture of some molecular gas (usually O2). These plasmas produce positive and negative ions, (V)UV radiation, and reactive radical species, which interact with the treated surface. The effects of different plasma-generated species on the treated systems are a topic of current scientific discussions Kong2009 (1). The role of reactive oxygen species (ROS) has been stressed by several authors as a key factor influencing vegetative prokaryotic and eukaryotic cells Goree2006 (15, 16). More recently, the combination of ions and ROS has also been discussed Dobrynin2009 (8, 2).
Atmospheric pressure plasma jet (APPJ) sources operated with He with some addition of O2 ( 1%) are known to be efficient sources of ROS, particularly oxygen atoms, ozone molecules (O3), or singlet delta oxygen metastables O2 (a). Measurements and modelling have been reported for a coaxial jet with 1 cm diameter inner electrode and 1 mm electrode gap Jeong98 (17), parallel plate jet with 1 mm electrode separation and 1 mm electrode width Schulz-vonderGathen2007 (13), or for sources with electrode width larger than 1 mm Schulz-vonderGathen2007 (13, 18). The plasma dynamics and plasma chemistry in these discharges have also been modelled by several authors Waskoenig2010 (19, 20). These works show that densities of above mentioned ROS are around 1015 cm-3 in the effluent of these jets and can be tuned by adjusting O2 concentration, applied power, gas flow, and jet-substrate distance. This kind of plasma is a promising tool for treatment of living tissues or for antibacterial treatment of surfaces at atmospheric pressure. The knowledge of ROS densities and, therefore, also the fluxes could be used to evaluate quantitatively the effects of ROS for example on vegetative bacteria. An unknown factor in these studies is the amount of VUV and UV photons, which are produced next to ROS in the plasma. These photons propagate unabsorbed through He atmosphere, irradiate the treated surface and can induce uncontrolled radiation damage. We report in this article a method, in which plasma generated VUV and UV photons and heavy reactive particles are effectively separated from each other and can be used separately for the surface treatment.
The manuscript is organized as follows. First, the microplasma jet used for the plasma generation is described and its modification allowing the separation is introduced. Second, the fluid dynamic model for the simulation of the gas flow and reaction kinetics of O atoms and ozone is described and discussed. Third, the performance of the X-Jet is tested by measuring the light emission in the 115-875 nm wavelength region and by analyzing the etching profiles of a model polymer film. Finally, the study of the interaction of plasma effluent with bacteria is presented.
II Experimental Setup
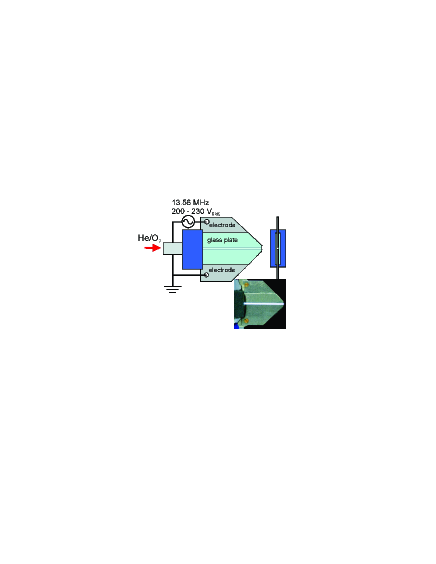
Two different jets are used in this work. The first plasma source is a parallel plate microscale atmospheric pressure plasma jet (-APPJ) and the second source is its modification with two gas channels at the jet nozzle. The -APPJ is a capacitively coupled microplasma jet consisting of two stainless steel electrodes (length 30 mm, thickness 1 mm) with a separation of 1 mm, and two glass plates, which confine the inter electrode volume on the sides (cf. Fig.1). One electrode is connected to a power supply (13.56 MHz, applied root-mean-square voltage 200-230 V, absorbed power 1 W) through a matching network and the other one is grounded. The volume of the plasma is 1 x 1 x 30 mm3. The -APPJ used here equals the -APPJ described elsewhere Knake08 (21, 22). The He gas flow through the jet is 1.4 slm with a small admixture of molecular oxygen (8.4 sccm, 0.6). It has been shown that this microplasma jet is a typical -mode discharge Schulz-vonderGathen2007 (13) and quantitative measurement of O and O3 densities as function of O2 concentration, applied power, and distance to the jet are available Knake08 (21, 22). For example, the densities (concentrations) of O and O3 measured by molecular beam mass spectrometry at 4 mm distance from the jet under conditions used in this work are 71014 cm-3 (28 ppm) and 51014 cm-3 (20 ppm) respectively Ellerweg2010 (22). The concentration of ozone increases with the distance and reaches 56 ppm at 50 mm. The substrate to be treated is placed perpendicular to the jet axis at a distance of 4 mm.
The gas temperature can be an issue for treatment of bacteria. The gas temperature in the effluent has been measured for 1 of O2 admixture and it was below 34∘C under these conditions Schulz-vonderGathen2007 (13). The temperature is slightly higher at lower O2 concentrations. It is around 44∘C at 4 mm distance from the jet nozzle in the free flowing effluent when 0.6 of O2 are admixed. The gas temperature at the surface placed at 4 mm distance from the nozzle is smaller then this value as verified by the treatment of skin, which does not cause any pain or discomfort.
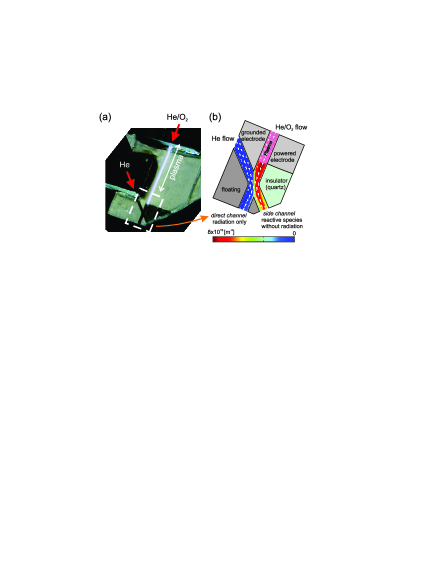
The transport of atoms and molecules (heavy particles) in the plasma jets with substantial gas flows of several liters/min under atmospheric pressure conditions is mainly controlled by convection. The typical diffusion times from a 1 mm diameter gas stream are comparable or longer than the transport time due to convection, which is typically few hundred microseconds. On the other hand, the plasma generated photons propagate in the direction of line-of-sight regardless of the gas flow in the plasma effluent. This difference can be used to separate spatially the VUV and UV photons generated in the plasma from heavy particles in the effluent. An additional flow of helium gas crossing the plasma effluent with comparable or larger flow rate will divert plasma effluent in another direction, while the photons will propagate undisturbed. However, care has to be taken to prevent formation of turbulent flow and to avoid admixture of ambient atmosphere (air) into the flow. This admixture could result in uncontrolled absorption of VUV and UV photons as well as in the change of ROS densities due to reactions of radicals or metastables with O2, N2, or H2O molecules from air. To prevent this admixture we have extended the nozzle of the -APPJ from Fig.1 by two crossed channels as shown in a photograph in Fig.2(a). We call this jet modification an X-Jet and the two channels direct channel and side channel. The plasma channel is extended as the direct channel beyond the electrodes and is crossed under a 45 degree angle by the side channel with the same 1x1 mm2 cross section. Additional He flow is applied to the side channel to divert the plasma effluent from the direct channel into the side channel. VUV and UV emission, on the other hand, propagates further through the direct channel (also filled with He) and can be used for surface treatment. This emission contains all wavelengths emitted by the plasma including for example the He excimer continuum emission at 58-100 nm range Kurunczi2001 (23). This excimer emission is blocked, when a MgF2 filter (cutting wavelength 115 nm) is used to separate the VUV photons from heavy particles. The role of VUV radiation is often neglected in the discussion of the results obtained by atmospheric pressure plasmas. Alternatively, the treatment by the emission passed through a quartz window (cutting wavelength around 180 nm) is tested or only emission measured in the 200-1000 nm wavelength range was taken into account Perni2007 (24). The above mentioned He excimer continuum or strong atomic oxygen lines at 98 and 115 nm are neglected in these cases.
III Substrate preparation
A plasma polymer film has been used in etching experiments as a model layer of the organic material. We have used a hydrogenated amorphous carbon (a-C:H) film, which was deposited on a glass substrate in an inductively coupled plasma reactor vonKeudell2010 (25) from 2 Pa of CH4 gas at power of 200 W pulsed at 500 Hz with a duty cycle of 10. The a-C:H film had 45 atomic percent of hydrogen, density of 1 g/cm3 and the carbon was mainly sp3 bonded. The film thickness was 300 nm with root mean square surface roughness of 3.8 nm. The etched profile was recorded by a profilometer (Dek Tak Stylus Profiler 6M) by measuring a line across the center of the etched area. The same line was measured before etching (baseline measurement) to determine the curvature of the surface due to bending of the glass substrate. This baseline is subtracted from the measured etched profile.
Vegetative B. subtilis and E. coli cells have been treated by both types of the microplasma jets. The following procedure has been used to prepare and evaluate them. B. subtilis 168 and E. coli K12 liquid cultures were incubated for 18 hours over night at 37∘C in LB medium Sambrook1989 (26). The cultures were diluted to an optical density of 0.1 at 500 nm (B. subtilis) or 580 nm (E. coli) and were sprayed for 1 second onto LB agar plates. A monolayer surface coverage with 4.5103cm-2 cell density is achieved in this case. The plates were grown for 2 hours at 37∘C before plasma treatment. After plasma treatment, the sample plates were incubated over night for 18 hours at 37∘C to allow survivors to growth. Zone of inhibitions were observed where treatment was lethal. The diameter of the zone of inhibition is used as a simple measure of the effect of plasma on the bacteria. The shape of the zone of inhibition varies from circular to elliptic and the diameter is reported as an average of its major and minor diameters. Additionally, we have checked that treating of the agar plates with plasma before the application of cells had no effect on bacterial growth. Furthermore, no pH change of the medium occurred during plasma treatment.
IV Fluid model of plasma effluent
A fluid model of the gas flow combined with the basic kinetic model of the reaction of O atoms with O2 molecules has been created and solved (using commercial COMSOL 3.5 software) to get better insight into processes in the plasma effluent and to estimate the flux of atomic oxygen to the surface. Two geometries have been simulated. First, the crossing of the channels in the X-Jet has been modelled in a 2D geometry assuming for simplicity infinite thickness of electrodes. Second, the 2D axially symmetric geometry has been used to simulate the oxygen chemistry in the effluent and the flux of oxygen atoms to the surface at the jet surface distance of 4 mm. Governing equations and boundary conditions, which have been used in both models, will be discussed now.
The flow of He is described by incompressible momentum conservation and continuity equations:
| (1) | |||
| (2) |
with being He gas density (0.164 kg/m3 at 101325 Pa and 300 K), gas flow velocity, dynamic viscosity of He (210-5 Pa/s), and the pressure (101325 Pa). No volume force is assumed to work on the gas. As boundary conditions no slip has been selected for walls, the average velocity calculated from the gas flow and cross section of the channel has been applied to the gas inlets (25.6 m/s for 1.4 slm He flow through 1 mm2) and a constant pressure condition ( = 101325 Pa) has been chosen for any outlet boundary. 300 K gas temperature is assumed in the model.
The transport of O and O3 species has been simulated as a diffusion-convection transport with diffusion coefficients of 1.2910-4 m2s-1 and 0.71310-4 m2s-1 for O and O3, respectively (taken from ref. Waskoenig2010 (19)) and with velocities taken from the He flow simulation. The governing equation for species (i = O, O3) is:
| (3) |
The is the production or loss of particles due to gas phase reactions. The volume in both geometries is divided into two parts. A plasma region, where steady state conditions with constant densities of all species are assumed, and effluent, where the reactive species recombine. For simplicity, no reactions are assumed in the plasma region (the densities of O and O3 are taken from the literature and introduced into the model via boundary condition) and only three body reaction of atomic oxygen, O2, and He is considered in the effluent.
| (4) |
This is the dominant gas phase reaction in the plasma effluent, where negligible densities of ions or electrons can be assumed Waskoenig2010 (19). Reaction rate constant of this reaction is Stafford2004 (27). For simplicity, constant values of (101325 Pa) and (0.6% of 101325 Pa) are taken for the helium and molecular oxygen, respectively. The following boundary conditions have been used: the densities of O and O3 are set to and , respectively, at the gas inlet of the plasma channel. These values are extrapolated values from the experimental measurements in the effluent Ellerweg2010 (22). The convection flow is assumed for the outlet boundaries. The boundary conditions at any wall are different for O3 and O. Ozone is assumed to be unreactive at the wall with insulation/symmetry boundary condition at any solid surface. Oxygen can on the contrary recombine or react at the surface, which has to be considered in the model. The Neumann’s boundary condition is therefore used at any solid surface with normal flux of O atoms being lost at that boundary defined as Chantry87 (28):
| (5) |
where the minus sign indicates the loss process, is the surface reaction probability of O atoms at a given surface, and is the gas thermal velocity given by . The surface reaction probability depends on the surface. It can be very low for example for glass (10-5 to 10-3, Cartry99 (29)) and could be close to unity for very reactive surfaces. We take = 10-3 for glass surface of the channels and = 0.03 for the a-C:H surface. The variation of the former one in the above mentioned range does not modify significantly the results of the simulation and the choice of the latter one will be explained later in the text. The results of the simulation for the crossing of channels in the X-Jet are shown in Fig.2(b). The gas flow direction and velocity magnitude is indicated by the white arrows (maximum gas velocity on the axis of a single channel is around 33.8 m/s) and the color map represents the simulated density of atomic oxygen. It can be seen that majority of oxygen atoms are diverted into the side channel of the X-Jet. Only small amounts diffuse into the direct channel. This diffusion can be prevented by using higher He flow through the side channel. But we will demonstrate later that even with both He flows being the same the flux of any heavy reactive particle from the plasma to the surface under the direct channel is negligible.
The flux of atomic oxygen towards the surface can be modelled better with the 2D axially symmetric geometry. This model does not allow to model both channels at the same time. However, it describes more correctly the gas flow in a single channel (gas flow is surrounded by walls at each side) and after the channel nozzle. The square 11 mm2 channel is approximated by a cylinder with the radius of 0.564 mm giving the same cross section area. Fig.3 shows the geometry selected for the simulation. First, a 10 mm long cylinder represents the last 3 mm of plasma channel (no gas phase reaction simulating the plasma steady state) followed by 7 mm of gas flow in a channel without a plasma (taking into account the O recombination reaction (4)). These 7 mm represent the transport in one of the channels of the X-Jet. The effluent outside the channel is simulated as a 4 mm high cylinder with radius of 15 mm. Both top and bottom boundaries are assumed to be walls for simplicity. The top one is assumed to have properties of glass and the bottom one is assumed to be an a-C:H film with different O atom surface reaction probability. The outer wall of this cylinder serves as an outlet boundary in this case. The atomic oxygen and ozone densities in the volume and the flux of atomic oxygen to the surface can be estimated with this model.
The color map in Fig.3 shows the atomic oxygen density in the gas channel and in the region near the surface. The inset in Fig.3 shows the velocity field in the region where the gas stream hits the a-C:H surface. Additionally, three streamlines, along which the gas flow moves, are also shown in the inset. The prediction of the model can be validated by comparison with the experimental data. The densities of O and O3 have been measured as function of the distance from the jet nozzle for the experimental conditions simulated here. The MBMS and TALIF measurements show that O density decreases to 50 at the distance of 11 mm from the nozzle Ellerweg2010 (22). The simulation predicts a decrease to 65 after transport through the 7 mm tube and 4 mm gap. The simulated decrease is smaller than the measured one. However, it has to be taken into account that measurements were done with the free-standing effluent, without confining glass tube around it. The flow velocity drops without the glass tube confining the gas flow. Additionally, losses of O atoms due to the radial diffusion (which is hindered by the glass surface of the tube) will also cause the faster decrease of O density in the effluent. We performed the same simulation with ”free-standing” effluent without confining glass tube and the O density decreases to 55 of its original value, in a very good agreement with the measured data. It corroborates that reaction (4) is the dominant reaction in the plasma effluent. The simulation also predicts that the majority of O atoms reacts with O2 and is transformed into O3 molecules. This result is also in agreement with the experimental observations, where the drop of O density is accompanied by a similar increase of O3 density Ellerweg2010 (22).
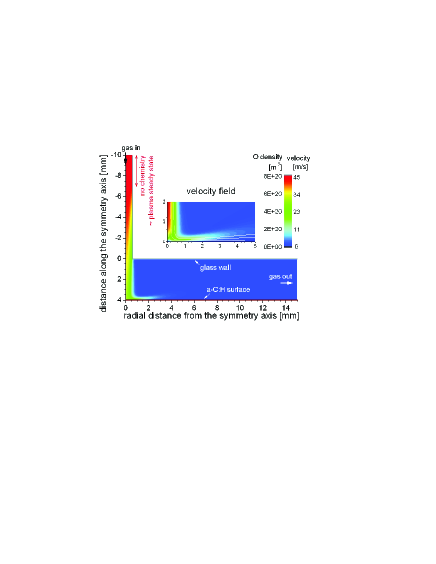
The model can help us now to understand the processes governing the spacial distribution of O densities in the effluent and to determine the O flux towards the surface. The O density is highest on the jet axis, where the gas velocity is the largest and the transport time from the plasma is the shortest. That is why the O density drops only to 65 of its original value in plasma. The larger the distance from the axis, the slower is the gas flow and the faster is the drop of the O density due to the three body gas phase reaction with O2 and He. The gas flow is redirected at the surface from the axial movement into the radial movement. The streamlines in Fig.3 show that mainly the gas from the axis and near axis region, where the O density is the highest, comes close to the substrate surface. That is why the surface reactions at the glass wall inside the jet or some impurities entering the gas channel near the wall, as it is the case in the direct channel of the X-Jet with additional He gas flow, do not play any significant role in the surface processes at the treated substrate. No significant change of the O flux to the surface is observed even if the surface reaction probability of O at the glass wall is set to 1. The O density in the gap between the jet and the substrate is high only at those places, where also the gas velocity is large (cf the distribution of the O density and the velocity field in Fig.3). It is again the consequence of fast gas phase reaction of O with O2. The O density is large only in those regions, where the transport time from the plasma is shorter or comparable with the reaction time of reaction (4). The surface loss of O atoms at the substrate only has a marginal effect on the bulk O density here because the diffusion is slow compared to gas phase reactions. Only a thin boundary layer just near the substrate is depleted if the surface reaction probability of O at a-C:H film surface is very large. The reaction probability will then influence the profile of the O flux to the substrate, as it is shown later in this article.
V Experimental results and discussion
The big advantage of the X-Jet is that it allows us to separate the effect of plasma generated VUV and UV photons from the effects induced by ROS (O3, O, impurities,…). The effects of VUV and UV photons only, ROS only, and photons and ROS together on a given sample (for example vegetative bacterial cells on agar plates) can be studied in the following ways: 1) radiation and ROS together: An X-Jet without additional He flow in the side channel will result in the transport of both ROS and (V)UV through the direct channel. 2) ROS only: The same He flow is used in both channels. The additional flow through the side channel will push the heavy particles from the plasma effluent into the side channel as demonstrated in Fig.2(b). The flow rates through both channels after the crossing will be the same due to the symmetry of this geometry. The flux of ROS at the exit of the side channel should be similar to the ROS flux at the direct channel in case 1). Some differences will occur due to a missing photo-dissociation and excitation of ROS and O2 after the crossing of both channels (see also discussion of E. coli treatment later) and due to a slightly asymmetric velocity field across the side channel. The plasma generated VUV and UV photons cannot enter directly into side channel due to geometry constrains, which was corroborated by measurements presented later in this article. 3) VUV and UV only: With additional He flow, only VUV and UV photons without ROS are at the exit of the direct channel. Higher He flow in the side channel can be used to make sure that no ROS from the plasma diffuse into the direct channel.
We report in the following results of several tests, which were carried out to demonstrate the performance of the X-Jet. Afterwards, results of treating bacteria with the unmodified -APPJ source in air followed by results of treating E. coli with the X-Jet in controlled He atmosphere will be presented and discussed.
V.1 Effectiveness of separation of heavy particles and photons
Measurements of emission intensity: The light emission from the side channel was compared to the emission emitted through the direct channel. First, the emission spectrum in the 200-875 nm wavelength range was measured (Ocean Optics USB4000 spectrometer, data not shown). The atomic oxygen lines at 777.4 and 844.7 nm dominated the spectrum, the third most intens line was the He line at 706.6 nm. Additionally, other He emission lines and emission band of OH around 309 nm were observed in the direct channel. Only the most intens 777.4 line was observed on axis of the side channel with intensity at 0.3 of the value observed in the direct channel. Slightly higher intensity (around 0.7) is observed slightly off axis of the side channel under the angle of 45 degree to the channel axis. This measurements show that the light emission through the side channel is reduced to less than 1 of the value in the direct channel and that reflections inside the channel structure are probably responsible for the residual emission. However, there is still a possibility that the VUV photons with wavelength below 200 nm will be emitted by some long-living excited species, or that VUV photons from the plasma will be reabsorbed and reemitted in the direction of the side channel. Therefore, the solar blind VUV and UV detector (PMT-142, effective in 115 - 450 nm wavelength range with maximum relative efficiency at around 220 nmBibinov1997 (30)) in the evacuated housing with MgF2 window has been used to measure the intensity of VUV and UV emission from both channels of the X-Jet and also from the -APPJ directly. A 1 mm diameter diaphragm was placed on the MgF2 window and the jet was always at 4 mm distance from the window to maintain the same acceptance angle for each measurement. The same experimental conditions with 0.6 of O2 were used again. Again, the emission from the side channel was significantly reduced, now to 0.7 on axis and to 1.5 off axis of the side channel. No equipment for measuring the complete emission spectrum including wavelengths below 115 nm is currently available in our lab so we cannot exclude that some emission at short wavelength range is emitted through the side channel. However, the fact that the emission above 115 nm was reduced below at least 1.5 and the observation, which will be shown and discussed later, that VUV and UV radiation from the direct channel has only a very small effect on bacteria, strongly indicate that VUV and UV radiation through the side channel is negligible. Additionally, the signal intensity of -APPJ and that of the direct channel of the X-Jet could be compared. The installation of the channel structure to the -APPJ reduced the emission intensity at 4 mm distance from the jet to approximately 17 percent.
Treatment of a model a-C:H film: A model polymer film, the plasma deposited a-C:H layer, was treated with different components of the plasma effluent separated in the X-Jet. Fig.4 shows the etching profiles induced by the treatment with the side channel and with additional He flow (further on called ROS-only treatment) and by the direct channel without additional He flow (further on called combined treatment). The gas channel used for the treatment was positioned perpendicular to the treated surface with the channel exit-substrate distance of 4 mm. These experiments were performed in He atmosphere to suppress possible admixture of surrounding air. The treatment time was 4 min with 0.6 of O2 in the gas mixture and RMS voltage of 230 V.
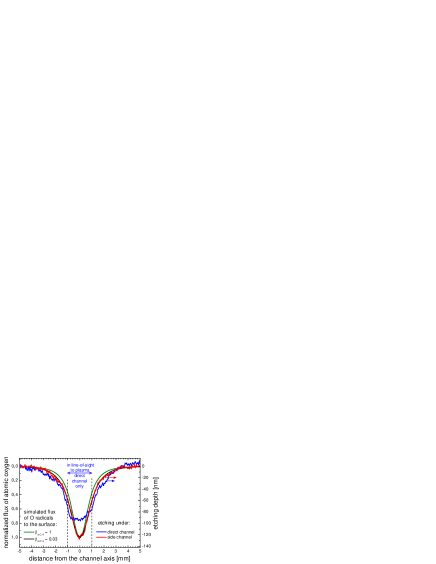
The etching profile after the ROS-only treatment was bell shaped with a maximum etch depth of 120 nm and a full width at half maximum of around 2 mm. It extended up to 4 mm from its symmetry axis (diameter 8 mm). This is an expected etching profile caused by reactive species like atomic oxygen, who’s density in the gas flow decreases with time (and therefore also with the distance from the jet axis) due to gas phase reactions and surface recombination. The flux of atomic oxygen to the substrate was also simulated by the 2D axially symmetric simulation as described above. The resulting normal flux of this reactive particles for two surface reaction probabilities of O at the a-C:H surface, = 1 and = 0.03, are compared to the etched profiles in Fig.4. It can be seen that the shape of the etched profile in the ROS-only treatment case matches perfectly the simulated flux of atomic oxygen to the surface when = 0.03 is used, which is a reasonable value between and 1. However, the profile simulated with = 1 is also very similar, just with a little bit smaller width. The small effect of on the profile is due to the fact that the fast gas phase reaction (4) determines the O density near the surface. Higher makes therefore only a small difference in the O depletion in the boundary layer close to the a-C:H surface. Additionally, the predicted absolute flux of 81016 of O atoms/cm2/s is higher than the measured etching rate of carbon atoms of 2.81015 of C atoms/cm2/s (calculated based on a-C:H film density of 1 kg/m3 and 45 atomic percent of hydrogen in the film). It can therefore explain the observed etch rate very well even assuming that two O atoms are needed per C to form CO2 and that some O atoms recombine with each other or react with hydrogen at the surface. We conclude therefore that most probably the atomic oxygen is responsible for the etching of the model a-C:H film and that the area reached by atomic oxygen has a diameter of no more than 10 mm.
The etching profile looked different after 4 minutes of the combined treatment (direct channel, X-Jet without additional He flow). The etched profile was similar only at a distance greater than 1 mm from the jet axis. However, the etching just underneath the jet, where the a-C:H film was in direct line-of-sight to plasma, was significantly slower than in the previous case. This difference in the etching profiles could be explained by hardening of the model a-C:H film by VUV and UV photons. The quanta of VUV and UV radiation have enough energy to break C-H and C-C bonds in the a-C:H film resulting in enhanced cross-linking and densification of the material, which makes it more difficult for atomic oxygen to etch it. The data presented in Fig.4 nicely demonstrates how important it is to consider VUV and UV radiation generated by the plasma in these experiments. The change of the surface profile of a-C:H film after the treatment with VUV and UV photons only (direct channel, X-Jet with additional He flow) has been checked as well and no etching has been observed after 4 or 20 minutes. This observation corroborates that O atoms do not reach the treated surface in this case even if the same fluxes of He are used in both channels, the case in which some ROS and O2 diffuse into the direct channel at the channel crossing. However, these species will not diffuse up to the axis of the direct channel and will, therefore, not be transported to the vicinity of the treated substrate (see the discussion of the 2D axially symmetric model and streamlines in Fig.3).
V.2 Treatment of bacteria with -APPJ
The bacteria on agar plates were treated with the effluent of the -APPJ source in ambient atmosphere. The jet was at 4 mm distance with He/O2 gas mixture (0.6 O2 in He) and RMS voltage of 230 V. The densities of the most dominant ROS species, atomic oxygen, and ozone, are around 61014 cm-3 at 4 mm distance under these conditions Ellerweg2010 (22). The plasma emission is localized between the electrodes and there is no direct contact of this active plasma region with the substrate. Fig.5 shows the diameter of the zone of inhibition as a function of treatment time. Additionally, the photograph shows the zone of inhibition for B. subtilis after 600 s of the treatment. The diameter is measured up to the region with the homogeneous density of bacteria.
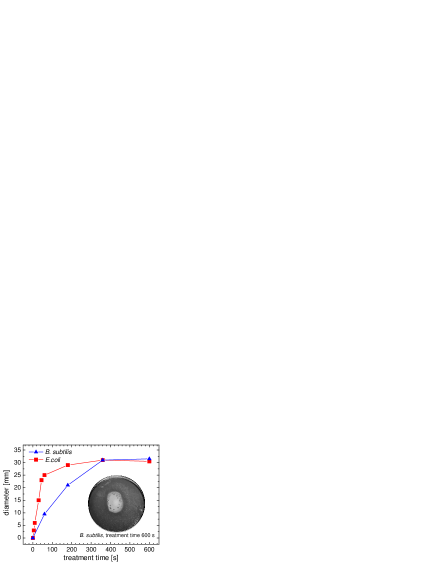
For both bacteria, the diameter of the zone of inhibition reached a final value of 30 mm (Fig.5). It indicates that the maximal distance on the surface from the jet axis, which the reactive species responsible for inactivation can reach (in the ambient air atmosphere) is 15 mm. We have already shown that the effective distance the atomic oxygen can reach was less than 5 mm. The flux of VUV and UV photons is the most intense just underneath the jet but will be absorbed by air at any radial distance from the jet axis larger than a few millimeters. Therefore, some long-living reactive species have to be responsible for bacterial inactivation at 15 mm distance. We propose that ozone is this reactive species. It is known for its bactericidal effects. Just 5 min treatment with 0.2 ppm of ozone in water is lethal for E. coli, B. cereus, or B. megaterium Broadwater1973 (31). Moreover, experiments in air with ozone have shown that it is also effective in killing bacteria laying on the agar plates. Ozone concentrations below 1 ppm and treatment times less than 100 min have been reported to be effective in killing Staphylococcus albus, Streptococcus salivarius, and B. prodigiosus Elford1942 (32). Ozone is produced effectively in the jet with concentrations at the surface higher than 20 ppm, well above the lethal limits reported in the literature. However, this does not explain why the zone of inhibition is limited to 30 mm diameter only. Moreover, the experiments performed in helium atmosphere, which are discussed in the next paragraph, do not exhibit this behavior. For example, the whole Petri dish with 80 mm diameter was affected after 3 minutes of combined treatment.
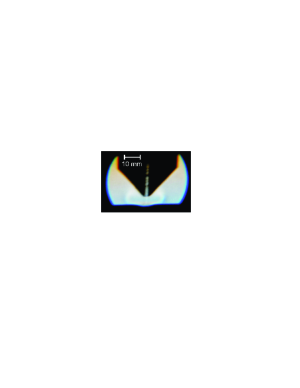
These observations can be explained as follows. Ozone is responsible for the inactivation at large distances from the jet. It is lethal in the concentrations generated in the jet and it is stable enough to survive the transport. The difference between the treatment in air and in He atmosphere is the buoyancy force acting on the He/O2/O3 gas mixture in the surrounding air. The O2 and O3 concentrations are so small that the average density of the mixture is very close to He density and the diffusion is slow preventing fast depletion of O2 and O3 densities from He and fast mixing with air. The buoyancy force lifts up the He/O2/O3 flow from the probe surface at some distance from the jet axis. Ozone is lifted up with the He flow and can therefore not reach the surface at a distance larger than 15 mm from the jet axis. The experimental evidence for this hypothesis is shown in Fig.6, which presents a schlieren image of the -APPJ with 1.4 slm He gas flow pointing downwards to the plane at 4 mm distance. The brighter and darker regions mark the presence of density gradients revealing in this case the boundary between He and air. It can be seen, that this boundary is around 12 mm from the jet axis. It corroborates that the He flow is indeed lifted from the surface. Moreover, this boundary moves a few millimeters over time indicating that turbulent or unstable flow takes place in this region. These observations can very well explain the maximum diameter of the zone of inhibition in the treatment with air as ambient atmosphere.
The buoyancy force is not present when He is used as the surrounding atmosphere and the flow of plasma effluent can spread undisturbed along the substrate surface. Ozone can therefore reach and inactivate the whole area of the Petri dish in this case.
Fig.5 also shows that the increase of diameter with the treatment time is 4 to 5 times faster for E. coli than for B. subtilis. The reason probably is that B. subtilis, as a Gram-positive bacterium, has a thicker cell wall and is protected better against the plasma treatment. B. subtilis is well known for its resistance against environmental stresses.
V.3 Treatment of bacteria with X-Jet
E. coli cells were exposed to the same treatment as a-C:H films. Fig.7 shows the resulting zone of inhibitions after 0.5, 1, 3, and 6 minutes of combined, ROS-only and radiation only treatments of E. coli. Again, the treatments were performed in a closed reactor filled with He. Because the O2 gas injected into the jet is depleted only up to several percent, the reactor is filled with a He/O2 gas mixture. We used an additional He gas flow into the reactor to further reduce the O2 concentration in the background atmosphere to below 0.2 . The second constituent of the background atmosphere with larger concentration was O3, which is produced in the jet.
The VUV and UV only experiment (direct channel, X-Jet with additional He flow) showed that these photons induce only a very small effect. No inactivation was observed up to 3 min of the treatment and two small zones of inhibition appeared after 6 min of treatment. One was located directly on the jet axis (diameter 1.5 mm) and was probably caused directly by VUV and UV photons. The other one was donut-shaped with a diameter of about 6 mm. This latter one was probably caused by admixture of O2 or O3 from the background gas into the effluent, their photo dissociation and reaction at the surface.
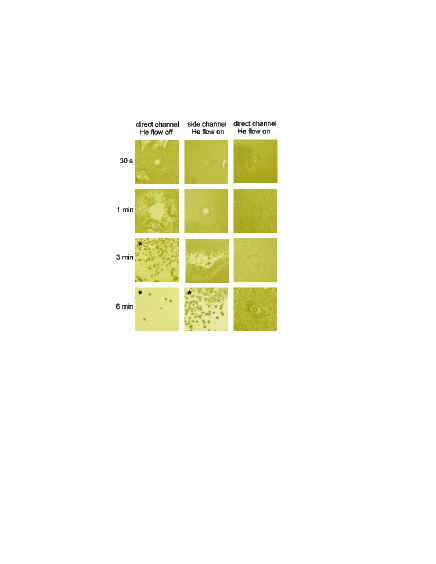
The combined treatment and ROS-only treatment showed typical dose-effect relationships. Elongated treatment times resulted in larger zones of inhibition and lower numbers of colony forming units. Contrary to the experiments in ambient air, where the maximum size of the zone of inhibition was limited to 30 mm, the whole area of the Petri dish is affected after 3 and 6 min of combined treatment and after 6 min of ROS-only treatment. The 40 by 40 mm areas (marked by asterisk in Fig.7) are representative for the whole area of the Petri dishes (diameter 80 mm) in these three cases. As already discussed above, ozone is the most probable candidate for the inactivation at large distance from the jet axis. VUV and UV photons generated in the plasma reach only a very small area (2 mm diameter) directly under the plasma jet and reactive atomic oxygen is depleted quickly from the gas phase as it was shown by the etching experiments and by the 2D axially symmetric simulation.
Surprisingly, the effect of the combined treatment was approximately twice as fast as the effect of the ROS-only treatment (cf Fig.7). We expected to see a synergistic effect between ROS and photons directly under the jet, where cells are exposed to both simultaneously. The diameter of this area is 2 mm only. We also expected that the effect outside of this area will be similar for both the combined and ROS-only treatments, in a similar way to that observed for the etching of a-C:H films. This, however, was not the case. The zone of inhibition of the combined treatment had a diameter of 5 mm after 30 s and the density of cells was decreased up to 20 mm from the jet axis after 1 min of treatment. The ROS-only treatment showed no zone of inhibition after 30 s and the visibly affected area only had a 5 mm diameter after a 1 min treatment. Additionally, the combined treatment at 3 min looks similar to the ROS-only treatment at 6 min. These observations indicate that the plasma effluent is changed by the presence of VUV and UV photons, some photochemistry takes place, and more reactive or excited species reach the substrate. Further investigations are planned to better understand this effect.
VI Conclusions
The modification of the microscale atmospheric pressure plasma jet (-APPJ) operated in He/O2, so called X-Jet, has been used to test the possibility of separating VUV and UV photons emitted by plasma from reactive particles transported by the gas flow in the plasma effluent. This separation provides the opportunity to study separately the effects of these components on living organisms, biological macromolecules or model films. We have shown that emission intensity of photons in the 115-875 nm wavelength region is reduced to less than 1.5 in the gas channel transporting the reactive oxygen species and we have demonstrated the performance of the X-Jet in etching experiments using a model a-C:H film as a substrate. Similar etching profiles were observed for both combined treatment and for ROS-only treatment. However, in the case of the combined treatment, the VUV and UV photons cause hardening of the model film on the area in line-of-sight to the plasma, which results into slower etch rates directly under the jet nozzle. The fluid model simulation of the gas flows and O reaction kinetics indicate that O atoms are responsible for the etching of the polymer film and that they can reach an area with maximum diameter of 10 mm.
The plasma effluent has been used for the treatment of bacteria. First, we have verified that the -APPJ can inactivate B. subtilis and E. coli. Treatment of several minutes leads to zones of inhibition with a diameter of 30 mm with faster inactivation of E. coli. Second, E. coli monolayers on agar plates were treated by the X-Jet in a controlled helium atmosphere. Under the conditions tested, the VUV and UV photons alone had only a small effect on the bacteria. In the ROS-only and combined treatments, the cells were most probably inactivated by ozone at larger distances from the jet and by combined effect of ozone, atomic oxygen, and some other possible impurities in the region close to the jet axis. We could show that the size of zone of inactivation is limited by the buoyancy force when working in ambient air. Furthermore, the results indicate that the VUV and UV photons can produce effectively reactive species in the gas phase, which leads to faster inactivation of E. coli.
We believe that the X-Jet is a powerful tool for the fundamental study of inactivation mechanisms by atmospheric pressure plasmas. Furthermore, this jet can also be used for any surface processing, which requires high fluxes of ROS without VUV and UV radiation, such as treatment of polymers or living tissues.
VII Acknowledgement
The authors thank Volker Schultz-von der Gathen for fruitful discussions about the operation of the -APPJ source and Henrik Böttner and Nick Knake for the help with Schlieren imaging of the jet. This work has been performed with the support of the research group FOR1123 approved by the German Research Foundation (DFG). This work has also been supported by the Research Department Plasmas with Complex Interactions of the Ruhr-Universität Bochum.
VIII References
References
- (1) M. G. Kong, G. Kroesen, G. Morfill, T. Nosenko, T. Shimizu, J. van Dijk, and J. L. Zimmermann, New J. Phys. 11, 115012 (2009).
- (2) E. Stoffels, Y. Sakiyama, and D. B. Graves, IEEE Trans. Plasma Sci. 36, 1441 (2008).
- (3) G. Daeschlein, T. von Woedtke, E. Kindel, R. Brandenburg, K.-D. Weltmann, and M. Jünger, Plasma Process. Polym. 7, 224 (2010a).
- (4) G. Daeschlein, S. Scholz, T. von Woedtke, M. Niggemeier, E. Kindel, R. Foest, R. Brandenburg, K.-D. Weltmann, and M. Jünger, IEEE Trans. Plasma Sci. p. DOI: 10.1109/TPS.2010.2063441 (2010b).
- (5) X. T. Deng, J. J. Shi, and M. G. Kong, J. Appl. Phys. 101, 074701 (2007).
- (6) G. Fridman, A. Shereshevsky, M. Jost, A. Brooks, A. Fridman, A. Gutsol, V. Vasilets, and G. Friedman, Plasma Chem. Plasma Process. 27, 163 (2007).
- (7) M. Vandamme, E. Robert, S. Pesnel, E. Barbosa, S. Dozias, J. Sobilo, S. Lerondel, and A. Le Pape, J. M. Pouvesle, Plasma Process. Polym. 7, 264 (2010).
- (8) D. Dobrynin, G. Fridman, G. Friedman, and A. Fridman, New J. Phys. 11, 115020 (2009).
- (9) G. Morfill, T. Shimizu, B. Steffes, and H.-U. Schmidt, New J. Phys. 11, 115019 (2009).
- (10) Z. Cao, Q. Nie, D. L. Bayliss, J. L. Walsh, C. S. Ren, D. Z. Wang, and M. G. Kong, Plasma Sources Sci. Technol. 19, 025003 (2009).
- (11) M. Laroussi and X. Lu, Appl. Phys. Lett. 87, 113902 (2005).
- (12) E. Robert, E. Barbosa, S. Dozias, M. Vandamme, C. Cachoncinlle, R. Viladrosa, and J. M. Pouvesle, Plasma Process. Polym 6, 795 (2009).
- (13) V. Schulz-von der Gathen, V. Buck, T. Gans, N. Knake, K. Niemi, S. Reuter, L. Schaper, and J. Winter, Contr. Plasma Phys. 47, 510 (2007).
- (14) J. Ehlbeck, U. Schnabel, M. Polak, J. Winter, T. von Woedtke, R. Brandenburg, T. von dem Hagen, and K.-D. Weltmann, J. Phys. D: Appl. Phys. 44, 013002 (2011).
- (15) J. Goree, B. Liu, and D. Drake, J. Phys. D: Appl. Phys. 39, 3479 (2006).
- (16) M. Hähnel, T. von Woedtke, and K.-D. Weltmann, Plasma Process. Polym. 7, 244 (2010).
- (17) J. Jeong, S. Babayan, A. Schütze, V. Tu, M. Morajev, G. Selwyn, and R. Hicks, Plasma Sources Sci. Technol. 7, 282 (1998).
- (18) J. Laimer and H. Störi, Plasma Process. Polym. 3, 573 (2006).
- (19) J. Waskoenig, K. Niemi, N. Knake, L. M. Graham, S. Reuter, V. Schulz-von der Gathen, and T. Gans, Plasma Sources Sci. Technol. 19, 045018 (2010).
- (20) D.-X. Liu, M.-Z. Rong, X.-H. Wang, F. Iza, M. G. Kong, and P. Bruggeman, Plasma Process. Polym. 7, 846 (2010).
- (21) N. Knake, S. Reuter, K. Niemi, V. Schulz-von der Gathen, and J. Winter, J. Phys. D: Appl. Phys. 41, 194006 (2008).
- (22) D. Ellerweg, J. Benedikt, A. von Keudell, N. Knake, and V. Schulz-von der Gathen, New J. Phys. 12, 013021 (2010).
- (23) P. Kurunczi, J. Lopez, H. Shah, and K. Becker, Int. J. Mass Spec. 205, 277 (2001).
- (24) S. Perni, G. Shama, J. L. Hobman, P. A. Lund, C. J. Kershaw, G. A. Hidalgo-Arroyo, C. W. Penn, X. T. Deng, J. L. Walsh, and M. G. Kong, Applied Physics Letters 90, 073902 (2007).
- (25) A. von Keudell, P. Awakowicz, J. Benedikt, V. Raballand, A. Yanguas-Gil, J. Opretzka, C. Flötgen, R. Reuter, L. Byelykh, H. Halfmann, K. Stapelmann, B. Denis, J. Wunderlich, P. Muranyi, F. Rossi, O. Kylián, N. Hasiwa, A. Ruiz, H. Rauscher, L. Sirghi, E. Comoy, C. Dehen, L. Challier, and J. P. Deslys, Plasma Process. Polym. 7, 327 (2010).
- (26) J. Sambrook, E. Fritsch, and T. Maniatis, Molecular Cloning: A Laboratory Manual, Volume 1 to 3, 2nd edition (Cold Spring Harbor Laboratory Press, 1989).
- (27) D. S. Stafford and M. J. Kushner, J. Appl. Phys. 96, 2451 (2004).
- (28) P. Chantry, J. Appl. Phys. 62, 1141 (1987).
- (29) G. Cartry, L. Magne, and G. Cernogara, J. Phys. D 32, L53 (1999).
- (30) N. K. Bibinov, D. O. Bolshukhin, D. B. Kokh, A. M. Pravilov, I. P. Vinogradov, and K. Wiesemann, Measurement Science and Technology 8, 773 (1997).
- (31) W. T. Broadwater, R. C. Hoehn, and P. H. King, Appl. Microbiol. 26, 391 (1973).
- (32) W. J. Elford and J. van den Ende, J. Hygiene 42, 240 (1942).