Magneto-optical trapping of bosonic and fermionic neon isotopes and their mixtures: isotope shift of the transition and hyperfine constants of the state of 21Ne
Abstract
We have magneto-optically trapped all three stable neon isotopes, including the rare 21Ne, and all two-isotope combinations. The atoms are prepared in the metastable state and manipulated via laser interaction on the transition at 640.2 nm. These cold ( mK) and environmentally decoupled atom samples present ideal objects for precision measurements and the investigation of interactions between cold and ultracold metastable atoms. In this work, we present accurate measurements of the isotope shift of the transition and the hyperfine interaction constants of the state of 21Ne. The determined isotope shifts are MHz for 20Ne 22Ne, MHz for 20Ne 21Ne, and MHz for 21Ne 22Ne. The obtained magnetic dipole and electric quadrupole hyperfine interaction constants are MHz and MHz, respectively. All measurements give a reduction of uncertainty by about one order of magnitude over previous measurements.
I Introduction
Cold and ultracold atoms prepared by laser cooling and trapping techniques Metcalf and van der Straten (1999) present an almost ideal sample of atomic systems, confined effectively in vacuum with vanishing interactions to the environment. Such ensembles have been used successfully for a variety of high-precision measurements, such as the determination of atomic and fundamental constants, or atom-atom interaction strengths. In addition, laser prepared atoms have been further cooled to quantum degeneracy Pitaevskii and Stringari (2003), opening a new field of research with high impact.
Although initiated by work on alkali atoms, in recent years a continuously growing selection of atomic species have been investigated. A special class of atoms is given by metastable rare gas atoms, since their high internal energy makes it possible to investigate specific interaction processes and to apply specific detection techniques (for a review see Vassen et al. (2011)). Important recent progress has led to the simultaneous trapping of different isotopes of metastable helium Stas et al. (2004), the observation of Bose-Einstein Condensation (BEC) of metastable 4He Robert et al. (2001); Pereira Dos Santos et al. (2001); Tychkov et al. (2006); Dall and Truscott (2007) and the observation of quantum degenerate Bose-Fermi mixtures of 3He and 4He McNamara et al. (2006). In our work, we aim at extending this type of investigations to metastable neon atoms.
In neon, there exist two stable bosonic isotopes, 20Ne (natural abundance: 90.48%) and 22Ne (9.25%), and one stable fermionic isotope, 21Ne, which is rather rare (0.27%) Rosman and Taylor (1998). The bosonic isotopes have no nuclear spin, whereas 21Ne has a nuclear spin of causing a hyperfine structure of the atomic states (see Fig. 1). The atoms are excited to the metastable state by electron bombardment. This state has a lifetime of 14.73 s which has been measured with high precision in a laser-cooled sample Zinner et al. (2003). For laser manipulation, the closed transition is used. Although expected to be more demanding than for metastable helium, Bose-Einstein condensation of metastable neon is pursued in our work.
In this paper, we report on the laser cooling and trapping of all stable neon isotopes Shimizu et al. (1989) and, for the first time, of all two-isotope combinations in a magneto-optical trap (MOT). We present the first measurements of the isotope shift of the (pair-coupling notation: ) transition at 640.2 nm and the hyperfine structure of the level for 21Ne performed on a laser-cooled neon sample. All measurements give a reduction of uncertainty by about one order of magnitude over previous measurements.
II Multi-isotope trapping
The experimental apparatus is essentially the same as used in our previous work Zinner et al. (2003); Spoden et al. (2005): a beam of neon atoms is excited to the metastable state in a dc discharge and collimated using curved light fields. The atoms are then decelerated in a Zeeman slower and trapped in a MOT. The different laser fields for trapping, cooling, and detecting the atoms are derived from a dye laser using several acousto-optic frequency shifters.

In agreement with Shimizu et al. Shimizu et al. (1989), we find that additional laser frequencies are needed in order to trap 21Ne. The hyperfine structure of the transition is shown in Fig. 1. In addition to the cooling light, we superimpose “repumping” light with a frequency resonant to the transition on all laser beams. This light pumps atoms that have been off-resonantly excited to and spontaneously decayed to back into the cooling cycle. Without this additional light, trapping of 21Ne atoms is not possible. The intensity of the repumping light is typically 18% of the cooling light. To further increase the number of trapped 21Ne, we optimized the loading process by pumping atoms excited to the or state in the discharge source into the cooling cycle by an additional laser beam in the optical collimation zone between discharge source and Zeeman slower. This beam has a frequency tuned between the ones of the closely spaced and transitions and typically has an intensity of 20% of the main beam used for collimation. This increases the number of trapped 21Ne atoms by about 25%.
The light of an additional dye laser is available for trapping a second neon isotope. By combining the light of both lasers, all two-isotope combinations can be trapped in fast succession, alternately, or simultaneously. The number of trapped atoms is determined using absorption imaging. In case of two-isotope MOTs the absorption images are taken using light resonant with the cooling transition of only one isotope. Since the isotope shift of the cooling transition is several hundreds of MHz, the presence of another isotope does not influence the imaging. Typical atom numbers are presented in Table 1. In two-isotope traps, the atom number is about 30% less than in the single isotope cases. The temperature is typically about 1 mK in all cases. The number of 20Ne and 22Ne atoms is limited by inelastic collisions between trapped atoms Spoden et al. (2005); Kuppens et al. (2002); Matherson et al. (2008) while the number of 21Ne atoms is limited by the maximum available loading duration of 0.7 s in our setup.
The frequency of the 22Ne Zeeman slowing beam is only 45 MHz detuned from the 21Ne transition and, thus, this beam pumps 21Ne atoms out of the cooling cycle. Therefore, in order to trap 21Ne in combination with 22Ne, we increase the repumper power and reduce the loading duration of 22Ne.
| Isotope | Atoms | Isotopes | Atoms |
|---|---|---|---|
| 20Ne | 600 | 20Ne + 22Ne | 400 + 150 |
| 21Ne | 3 | 20Ne + 21Ne | 400 + 2 |
| 22Ne | 200 | 22Ne + 21Ne | 100 + 2 |
III Isotope shift of the cooling transition
We used these atom samples to determine the isotope shift of the laser-cooling transition with high precision. Since our approach allows for a very precise control of experimental conditions and an almost complete elimination of Doppler and collisional shifts and broadenings, our measurements are more accurate than earlier measurements using gas discharge cells Julien et al. (1980); Guthöhrlein and Windholz (1994); Basar et al. (1997) or atomic beams Odintsov (1965); Konz et al. (1992). Two techniques, one based on absorption imaging and one based on imaging of the MOT fluorescence Walhout et al. (1993), are used and compared to each other.
In order to determine the nominal isotope shift of the transition for 21Ne, also the hyperfine structure of the involved energy levels has to be known. The hyperfine interaction constants of the metastable state have already been measured with high accuracy Grosof et al. (1958). An accurate measurement of the hyperfine constants is presented in Section IV and the final results of the resulting isotope shift determination are presented in Section V.
III.1 Absorption measurement

(MHz)
Absorption (arb.u.)
(MHz)
(MHz)
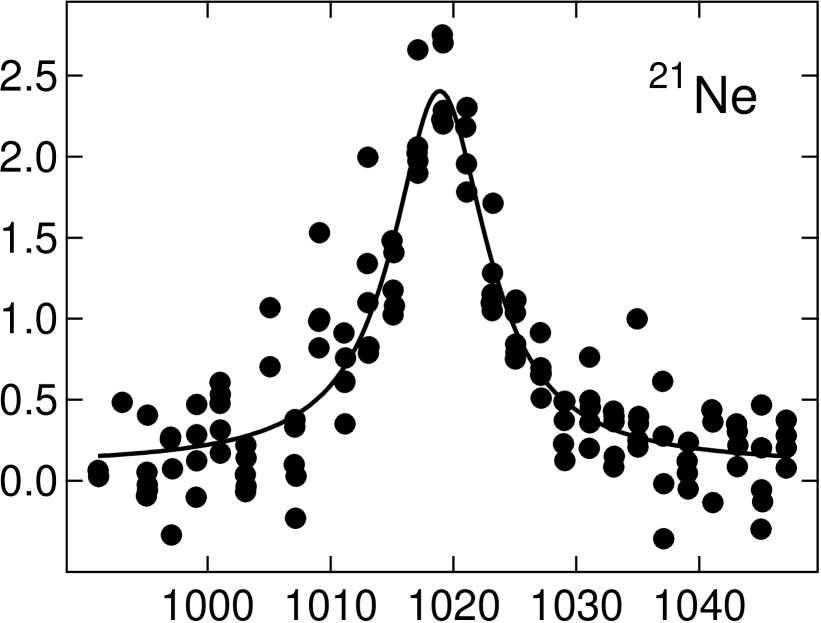
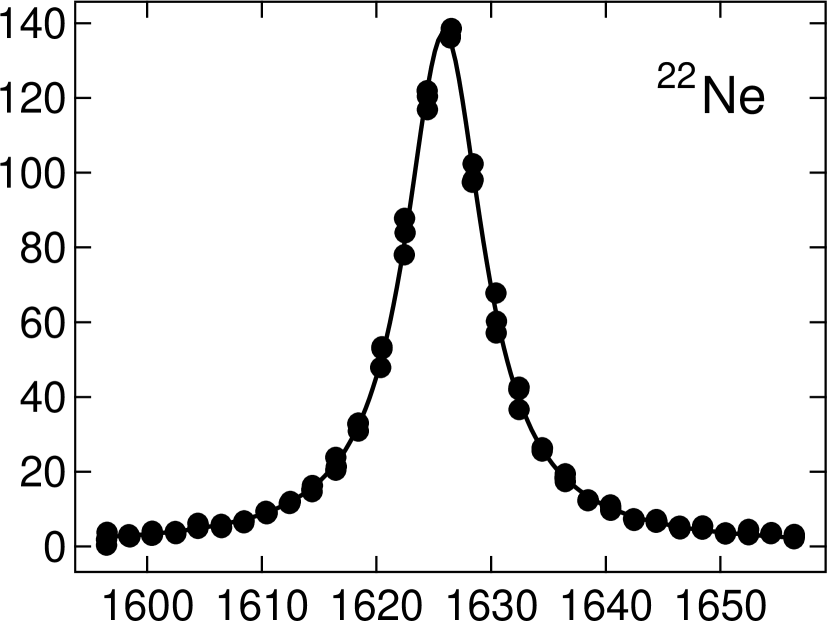
In a first set of experiments, the isotope shift was determined by exploring the frequency dependence of absorption imaging. Direct measurements have been performed for the two-isotope combinations 20Ne + 22Ne and 20Ne + 21Ne, using both dye lasers which were stabilized independently to the cooling transition of each respective isotope by saturated absorption in an ac discharge cell. In each experimental run, the frequency offset between the two lasers was determined by measuring the beat frequency of two superimposed laser beams with a spectrum analyzer in order to eliminate fluctuations and drifts of the stabilization. Both isotopes were trapped alternately in direct succession to minimize effects of frequency or atom number drifts during the experimental runs, but only one isotope was trapped at a time to avoid inter-isotopic influences.
The resulting absorption lines are shown in Fig. 2 together with Lorentzian fits. For each data point, the frequency of the absorption beam was tuned to the designated value by an acousto-optic frequency shifter and, after the MOT beams and MOT magnetic field had been turned off, an absorption image was taken. Comparing the center frequencies of the Lorentzian lines yields the isotope shift of the cooling transition. The results are given in Table 2. No direct measurements where performed for the 21Ne 22Ne isotope shift in absorption, but the respective shift of the cooling transition can be calculated from the other two measurements to be MHz.
The frequency shift between the cooling transitions of the bosonic isotopes was measured with high precision, whereas the measurement involving 21Ne is less precise due to the lower number of trapped 21Ne atoms. The uncertainties taken into account are summarized in Table 3. The statistical errors of the center frequencies were calculated for each absorption line individually accounting for fit errors as well as atom number drifts. Laser drifts were deduced from the temporal drift of the beat frequency. Long-term stability and accuracy of the spectrum analyzer were tested using a rubidium frequency standard.
| Frequency (MHz) | |
| Absorption measurement | |
| 20Ne 22Ne | 1625.9 0.15 |
| 20Ne 21Ne | 1018.9 0.45 |
| Fluorescence measurement | |
| 20Ne 22Ne | 1626.0 0.22 |
| 20Ne 21Ne | 1018.8 0.25 |
| 21Ne 22Ne | 607.2 0.25 |
| Statistics | Laser drift | Spectrum | |
| analyzer | |||
| Absorption | |||
| 20Ne 22Ne | 0.14 MHz | 0.02 MHz | 0.05 MHz |
| 20Ne 21Ne | 0.42 MHz | 0.15 MHz | 0.05 MHz |
| Fluorescence | |||
| 20Ne 22Ne | 0.07 MHz | 0.20 MHz | 0.05 MHz |
| 20Ne 21Ne | 0.15 MHz | 0.20 MHz | 0.05 MHz |
| 21Ne 22Ne | 0.15 MHz | 0.20 MHz | 0.05 MHz |
III.2 Fluorescence measurement

(MHz)
Fluorescence (arb.u.)
(MHz)
Fluorescence (arb.u.)
(MHz)
(MHz)
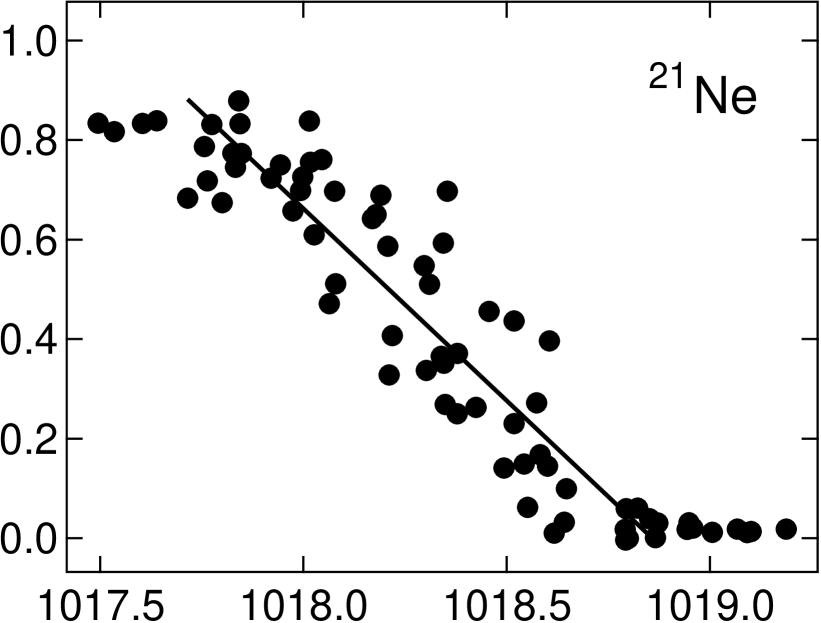
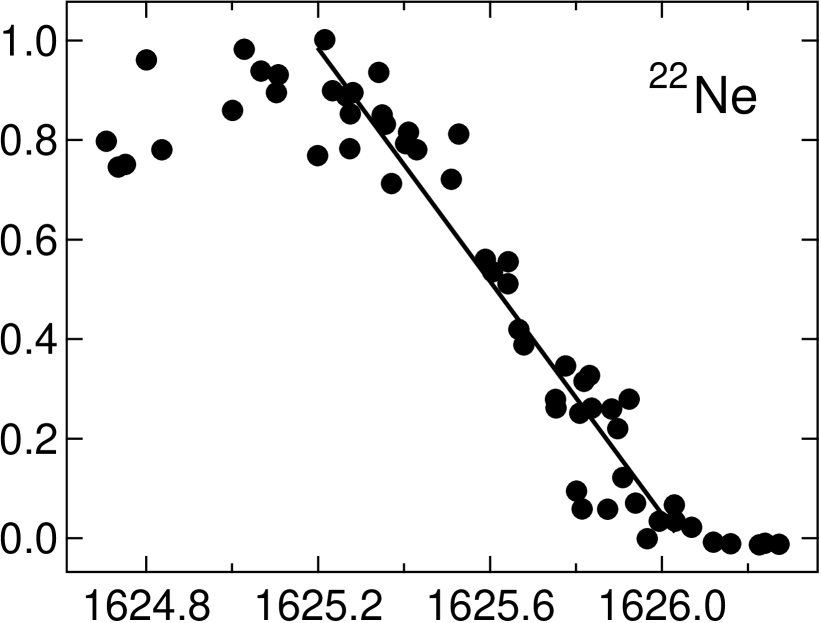
A second determination of the cooling transition isotope shift was performed by measuring the frequency dependence of the MOT fluorescence for each isotope. When the detuning of the MOT laser beams is varied from red- () to blue-detuning (), the MOT fluorescence rapidly decreases close to resonance Walhout et al. (1993). As can be seen in Fig. 3, the falling edge of the fluorescence signal is only about 500 kHz wide as compared to the 8.2 MHz natural line width of the transition. Since the fluorescence signal is well pronounced even for small and dilute atomic samples, this method is especially suitable for measurements including the rare 21Ne.
The measurement was performed for the three isotopes consecutively using the same laser. The second dye laser was locked to the 20Ne cooling transition as a stable frequency reference. In each experimental run, the MOT was loaded under constant conditions. To minimize density dependent effects, a similar number of atoms was trapped for all isotopes by blocking the optical collimation and reducing the loading time for 20Ne and 22Ne. After loading, the frequency of the MOT beams was tuned to the designated value using an acousto-optic frequency shifter and, after a waiting time of 50 ms, the MOT fluorescence was recorded with a CCD camera for 50 ms. In case of 21Ne the repumper was switched off during the fluorescence measurement.
The resulting fluorescence signals are shown in Fig. 4. A linear function is fitted to the falling edge of the signals. Isotope shifts are determined using the frequency values of the zero crossings of these fits. As can be seen in Fig. 3, these frequencies are about 7 MHz below the resonance frequency for each isotope. Since we are only interested in frequency differences between isotopes, this constant offset cancels for the isotope shift determination. The values for the isotope shift of the cooling transition measured in this way are given in lower part of Table 2. The sources of uncertainties which have to be taken into account are the same as for the absorption measurements with the respective values presented in the lower part of Table 3. The statistical errors, especially for 21Ne, are smaller than for the absorption measurements due to the better signal-to-noise ratio for low atom numbers and the narrow falling edge of the fluorescence signal. The cooling transition isotope shifts determined with both methods agree well within the error margins.
IV Hyperfine interaction constants
To obtain the nominal isotope shift of 21Ne not only the shift of the cooling transition but also the hyperfine splitting of the and states have to be known (cf. Fig. 1). With magnetic dipole and electric quadrupole interaction constants and , the splitting of the states can be calculated according to
| (1) |
with
| (2) |
where , , and denote the electronic, nuclear, and total angular momentum quantum numbers. The hyperfine interaction constants have been measured with high accuracy by Grosof et al. Grosof et al. (1958) as MHz and MHz. The hyperfine constants had been known only to MHz accuracy Julien et al. (1980) and, therefore, have been also determined in this work.
| Hyperfine splitting | Frequency (MHz) |
|---|---|
| 721.7 0.5 | |
| 1182.5 0.5 |
| Statistics | 0.40 MHz | 0.36 MHz |
|---|---|---|
| Laser drift | 0.20 MHz | 0.20 MHz |
| Spectrum analyzer | 0.05 MHz | 0.05 MHz |
| Magnetic field | 0.23 MHz | 0.25 MHz |
| This work | Ref. Julien et al. (1980) | Ref. Guthöhrlein and Windholz (1994) | Ref. Basar et al. (1997) | Ref. Odintsov (1965) | Ref. Konz et al. (1992) | |
| (MHz) | (MHz) | (MHz) | (MHz) | (MHz) | (MHz) | |
| HFS constants | ||||||
| Isotope shift | ||||||
| 20Ne 22Ne | ||||||
| 20Ne 21Ne | ||||||
| 21Ne 22Ne |
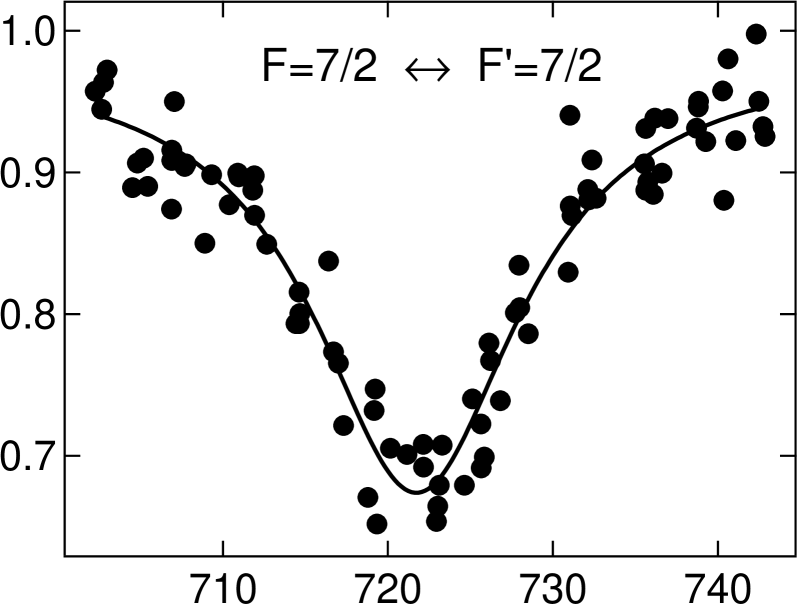
To obtain the hyperfine interaction constants, we measured the splittings between the , 7/2, and 5/2 levels of the state. For this purpose, we measured the trap loss caused by an additional probe beam resonant to the or transition which pumps atoms out of the cooling cycle. In each experimental run about atoms in the state were loaded into the MOT which was then switched off. After 1.5 ms waiting time to allow for magnetic fields to vanish, the probe pulse was applied for 360 s and the beat frequency between probe and cooling laser light was determined using a spectrum analyzer. The MOT was then switched on again without repumping light to retrap all atoms remaining in . The MOT fluorescence was measured with the CCD camera for 50 ms in order to determine the number of the retrapped atoms. In addition, the frequency of the transition was measured using absorption imaging as described in Section III.1. The trap loss as a function of probe pulse frequency for the and transitions are shown in Fig. 5. The center frequencies were determined by least square fits of Lorentzian functions. The measured splittings are given in Table 4.
(MHz)
Fluorescence (arb.u.)

(MHz)
The hyperfine interaction constants calculated according to Eq. 1 are MHz and MHz. The sources of uncertainties are the same as described in Section III.1 plus an additional uncertainty taking into account the effect of imperfect compensation of magnetic fields since transitions involving states with different g-factors have been measured. The remaining magnetic field was found to be less than 17 T (170 mG) which leads to a frequency shift of 0.15 MHz to 0.20 MHz, depending on the transition. The resulting uncertainties caused by the magnetic field were evaluated by averaging the shifts of all possible transitions assuming an equal initial distribution between states. All contributing uncertainties are summarized in Table 5.
V Final results and discussion
The final results for the nominal isotope shift of the transition and the hyperfine interaction constants of the level of 21Ne are compiled in Table 6 together with previous experimental results of Refs. Julien et al. (1980); Guthöhrlein and Windholz (1994); Basar et al. (1997); Odintsov (1965); Konz et al. (1992). Due to the smaller uncertainty, the 20Ne 22Ne isotope shift is taken from the absorption imaging results (Section III.1). The values for isotope shifts involving 21Ne are based on the fluorescence imaging results (Section III.2), the hyperfine interaction constants from Ref. Grosof et al. (1958), and the hyperfine constants from Section IV.
Compared to previous measurements Julien et al. (1980); Guthöhrlein and Windholz (1994); Basar et al. (1997); Odintsov (1965); Konz et al. (1992), our results are a factor of 7 to 10 more precise, which demonstrates the advantage of using laser cooled and trapped atoms for precision measurements. Our and the previous results agree well within the error margins, except for the 20Ne 22Ne isotope shift which is found to be about 4 MHz smaller in our work. While the reason for this discrepancy is unknown, our results obtained for several independent measurement runs and by using two independent methods (absorption and fluorescence method) agree well within our small error margins. We have checked our methods very carefully for additional systematic errors but could not identify any significant additional sources of uncertainty. To our knowledge, no ab initio calculations for a comparison to our results are available in the literature. The high-precision results presented here should trigger respective calculations and should help to improve the determination of the mass and charge radii of 17-22Ne including the proton-halo candidate 17Ne Geithner et al. (2008).
We would like to thank Alexander Martin, Norbert Herschbach, and Gabriele Jenny-Deußer for helpful discussions. This work was supported in part by the Deutsche Forschungsgemeinschaft (DFG), by the BMBF (contract numbers 06DA9019I and 06DA9020I), and by the European Science Foundation (ESF) within the CRP CIGMA of EuroQUAM.
References
- Metcalf and van der Straten (1999) H. Metcalf and P. van der Straten, Laser cooling and trapping (Springer Verlag, New York, 1999).
- Pitaevskii and Stringari (2003) L. Pitaevskii and S. Stringari, Bose-Einstein Condensation (Oxford University Press, Oxford, 2003).
- Vassen et al. (2011) W. Vassen, C. Cohen-Tannoudji, M. Leduc, D. Boiron, C. Westbrook, A. Truscott, K. Baldwin, G. Birkl, P. Cancio, and M. Trippenbach, submitted to Rev. Mod. Phys. (2011).
- Stas et al. (2004) R. J. W. Stas, J. M. McNamara, W. Hogervorst, and W. Vassen, Phys. Rev. Lett. 93, 053001 (2004).
- Robert et al. (2001) A. Robert, O. Sirjean, A. Browaeys, J. Poupard, S. Nowak, D. Boiron, C. I. Westbrook, and A. Aspect, Science 292, 461 (2001).
- Pereira Dos Santos et al. (2001) F. Pereira Dos Santos, J. Léonard, J. Wang, C. J. Barrelet, F. Perales, E. Rasel, C. S. Unnikrishnan, M. Leduc, and C. Cohen-Tannoudji, Phys. Rev. Lett. 86, 3459 (2001).
- Tychkov et al. (2006) A. S. Tychkov, T. Jeltes, J. M. McNamara, P. J. J. Tol, N. Herschbach, W. Hogervorst, and W. Vassen, Phys. Rev. A 73, 031603 (2006).
- Dall and Truscott (2007) R. G. Dall and A. G. Truscott, Opt. Commun. 270, 255 (2007).
- McNamara et al. (2006) J. M. McNamara, T. Jeltes, A. S. Tychkov, W. Hogervorst, and W. Vassen, Phys. Rev. Lett. 97, 080404 (2006).
- Rosman and Taylor (1998) K. J. R. Rosman and P. D. P. Taylor, J. Phys. Chem. Ref. Data 27, 1275 (1998).
- Zinner et al. (2003) M. Zinner, P. Spoden, T. Kraemer, G. Birkl, and W. Ertmer, Phys. Rev. A 67, 010501 (2003).
- Shimizu et al. (1989) F. Shimizu, K. Shimizu, and H. Takuma, Phys. Rev. A 39, 2758 (1989).
- Spoden et al. (2005) P. Spoden, M. Zinner, N. Herschbach, W. J. van Drunen, W. Ertmer, and G. Birkl, Phys. Rev. Lett. 94, 223201 (2005).
- Kuppens et al. (2002) S. J. M. Kuppens, J. G. C. Tempelaars, V. P. Mogendorff, B. J. Claessens, H. C. W. Beijerinck, and E. J. D. Vredenbregt, Phys. Rev. A. 65, 023410 (2002).
- Matherson et al. (2008) K. J. Matherson, R. D. Glover, D. E. Laban, and R. T. Sang, Phys. Rev. A 78, 042712 (2008).
- Julien et al. (1980) L. Julien, M. Pinard, and F. Laloë, J. Phys. Lett. 41, L479 (1980).
- Guthöhrlein and Windholz (1994) G. Guthöhrlein and L. Windholz, J. Opt. Research 2, 171 (1994).
- Basar et al. (1997) G. Basar, G. Basar, S. Büttgenbach, S. Kröger, and H.-D. Kronfeldt, Z. Phys. D 39, 283 (1997).
- Odintsov (1965) V. I. Odintsov, Opt. Spectrosc. 18, 205 (1965).
- Konz et al. (1992) E. Konz, T. Kraft, and H.-G. Rubahn, Appl. Opt. 31, 4995 (1992).
- Walhout et al. (1993) M. Walhout, H. J. L. Megens, A. Witte, and S. L. Rolston, Phys. Rev. A 48, R879 (1993).
- Grosof et al. (1958) G. M. Grosof, P. Buck, W. Lichten, and I. I. Rabi, Phys. Rev. Lett. 1, 214 (1958).
- Geithner et al. (2008) W. Geithner, T. Neff, G. Audi, K. Blaum, P. Delahaye, H. Feldmeier, S. George, C. Guénaut, F. Herfurth, A. Herlert, S. Kappertz, M. Keim, A. Kellerbauer, H.-J. Kluge, M. Kowalska, P. Lievens, D. Lunney, K. Marinova, R. Neugart, L. Schweikhard, S. Wilbert, and C. Yazidjian, Phys. Rev. Lett. 101, 252502 (2008).