Implications of high-precision spectra of thermonuclear X-ray bursts for determining neutron star masses and radii
Abstract:
X-ray burst spectra have long been used to estimate neutron star masses and radii. These estimates assumed that burst spectra are accurately described by the model atmosphere spectra developed over the last three decades. We compared RXTE data from a superburst with these spectra and found that the spectra predicted by previously published model atmospheres are strongly inconsistent with these high-precision measurements. In contrast, a simple Bose-Einstein spectrum is fully consistent with the data, as are recently published model atmosphere spectra. We discuss the implications of our results for determinations of neutron star masses and radii via constraints on their surface gravity and redshift, as originally suggested by Majczyna and Madej.
1 Introduction
A few years after the discovery of thermonuclear X-ray bursts from accreting neutron stars, Jan van Paradijs proposed a method for using observations of thermonuclear X-ray bursts to constrain both the masses and radii of the stars and hence to provide key information on the properties of cold high-density matter [12]. In brief, the argument was that (1) if the luminosity of a source during the so-called touchdown phase of photospheric radius expansion bursts was the Eddington luminosity of the neutron star, and (2) if during the cooling phase of the bursts the entire surface of the star emits uniformly, then a combination of the observed touchdown flux and area normalization plus knowledge of the distance to the source and the composition of its atmosphere suffices to determine the star’s mass and radius.
The first applications of this method yielded puzzling results. Burst spectra are very close to Planck spectra, but the fitted Planck temperatures are commonly keV at the peaks of bursts, which is higher than is possible if the atmosphere is purely gravitationally confined [8]. Also, in many cases application of this method leads to estimates of the stellar radius that are implausibly small ( km). It was then pointed out that although the shape of the spectrum may be qualitatively similar to a Planck spectrum, atmospheric opacity effects can shift the peak of the spectrum so that Planck fits of X-ray data yield a fitted temperature that can be up to times the surface effective temperature. It has been largely accepted that such models describe the spectra correctly, but prior to our work no comparison had been made with data that are capable of distinguishing between simple Planck or Bose-Einstein spectra and model atmosphere spectra; the differences are subtle, and require data taken with the best available instrument (the Rossi X-ray Timing Explorer Proportional Counter Array [RXTE PCA]) from long bursts that maintain steady spectra for tens of seconds as opposed to the tenths of a second that are usual for typical bursts.
Here we describe and elaborate on the comparisons we first reported in [1]. We find, surprisingly, that although a simple Bose-Einstein function fits the highest-precision single spectra available in the RXTE archive, the most commonly used atmospheric spectral models are inconsistent with such spectra. This calls into question inferences made using these models. In Section 2 we give an overview of the principles behind atmospheric spectral models and why they shift the spectral peak. In Section 3 we discuss our comparisons with RXTE data and what they imply. Finally, in Section 4 we discuss ongoing work in which we compare new atmospheric spectral models with the data, and in particular the indications that these models may fit long data sets better than Bose-Einstein models. We discuss the implications of such fits, particularly that they may yield constraints on the mass and radius via joint constraints on the surface gravity and redshift, but caution that the approximations in current models do not yet allow us to draw robust conclusions.
2 The Principles of Burst Model Atmosphere Spectra
In the past three decades, many groups have calculated model atmosphere spectra relevant for bursts (e.g., [4, 5, 7]). The high temperatures of the bursts mean that unless the atmosphere has unexpectedly large metallicity, atoms will be fully ionized. The only opacity sources are then free-free absorption (important at sufficiently low photon energies) and Compton scattering (expected to dominate over most or all of the observed PCA energy range).
In an idealized situation where the only opacity is energy-independent scattering, we can understand the shift in the peak of the spectrum caused by the scattering using a simple thought experiment. Suppose that the atmosphere has a net surface radiative flux , where is the Stefan-Boltzmann constant and is the effective temperature. Suppose also that it is in complete thermal balance and hence emits a Planck spectrum, but that on top of the atmosphere is a scattering layer that lets an energy-independent fraction of the photons through, the rest being reflected and rethermalized in the atmosphere. Because the flux must emerge, the atmosphere heats up, still in thermal equilibrium, to a temperature . The net flux is still , so the effective temperature (defined as ) is unchanged and the emergent spectrum is still a perfect Planck spectrum, but its temperature is times the effective temperature. Figure 1 shows a typical example [7] of how model atmospheres shift the peak of the spectrum upward.
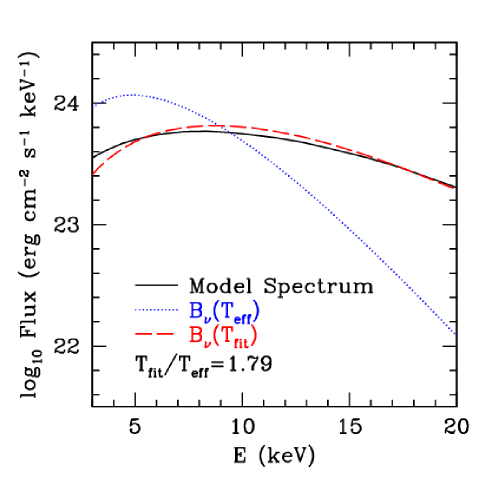
Figure 1 also shows how model atmosphere spectra typically deviate from the Planck spectrum that best fits them. The deviation at low energies is caused primarily by the energy-dependence of the free-free opacity whereas the deviation at high energies is due primarily to the energy-dependent Klein-Nishina correction to the Thomson scattering cross section. Thus although the model atmosphere spectra have shapes that are close to the shape of a Planck spectrum, there are deviations that can in principle be observed.
3 Comparison of Models with Data
Prior to our work in [1], very few comparisons had been made of model spectra with burst data, and none used data with enough counts to distinguish between qualitatively different models (e.g., Planck spectra fitted at least as well as model atmosphere spectra in the work of [2]). It is therefore critical to use long stretches of data taken with the RXTE PCA during intervals when the temperature is nearly constant.
Most thermonuclear X-ray bursts last only a few seconds, during which time the temperature changes rapidly enough that a single-temperature fit is only appropriate for data segments shorter than a few tenths of a second. However, we found that around the peak of the superburst from 4U 1820–30 (see [10]), there was a 64-second segment with counts that had a nearly constant temperature. This is the most precise available data set. We note that although the nuclear processes in superbursts and canonical bursts are different, their atmospheric processes are the same and hence for the purpose of spectral fitting this is a representative data set. We also note that in the later portions of this burst, high time resolution data show no evidence that the spectrum changes on time scales s, supporting our expectation that the time scale of variability is much longer in superbursts than in canonical bursts.
Our first comparison was with a Bose-Einstein spectral model, in which the continuum is
| (1) |
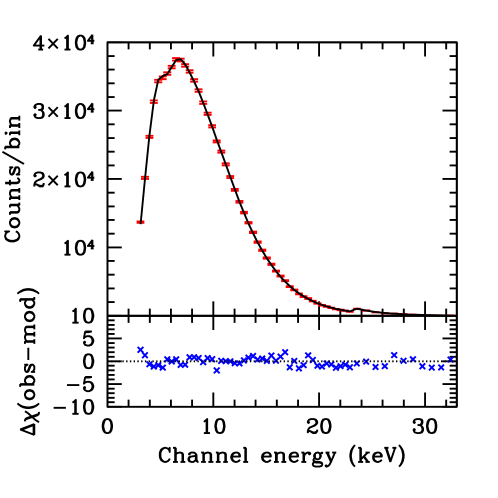
Here is the photon energy, is the temperature, and is the chemical potential. This spectrum, which generalizes and is more physically realizable than a Planck spectrum, is the equilibrium spectrum for fully saturated Comptonization; it could thus be a reasonable approximation to the spectrum produced in a scattering-dominated atmosphere [1]. In addition to the continuum component, we follow [10] in adding as additional components that originate far from the star a zero-redshift iron emission line, an edge, and photoelectric absorption.
We show the result in Figure 2. Remarkably, the simple Bose-Einstein form fits this 800,000 count spectrum extremely well, with /dof=55.8/50 over the 3–32 keV range of our fit. The best-fit temperature and chemical potential are keV and keV. The data here are from where the flux measured with RXTE is % of the peak flux of the burst, but we also find good fits to data at 100%, 80%, and 25% of the peak measured flux. The excellent fit of the Bose-Einstein shape is therefore not confined to the peak.
The high quality of this fit suggests challenges for spectral modelers. In particular, two questions emerge: why are the spectra so close to Bose-Einstein, and why is the magnitude of the chemical potential much less than ? To elaborate on the latter point: if there were a significant deficit of photons compared to what would be expected for a Planck spectrum at , then , so implies that the supply of photons is close to what is needed to fill a Planck spectrum. Ongoing work by Fred Lamb and Ka Ho Lo suggests that these requirements can be met in extended atmospheres with appropriate densities (low enough that scattering dominates, but high enough that photons can be supplied at the required rate). It is an open question whether these requirements are met in realistic models.
Although a Bose-Einstein model fits the highest-precision PCA data well, the implications are difficult to establish with certainty. This is because, as we indicated earlier, Thomson scattering in the outer atmosphere can in principle impose a large dilution factor without causing any deviation from a nearly-perfect Planck or Bose-Einstein spectrum established at larger optical depths. In this case the efficiency of the emission can be less than unity by a significant factor. If the emission efficiency is high, the spectrum we have measured implies that the surface radiative flux is significantly super-Eddington and extra confinement is required (e.g., [1] explored confinement by a tangled magnetic field generated during bursts). If instead the efficiency is low, the surface radiative flux could be sub-Eddington. For conventional, gravitationally-confined atmospheres to be favored would require the spectra they predict to fit much better than a Bose-Einstein spectrum, but this is not possible for single data segments because our fits of Bose-Einstein models to such segments yield . It is, nonetheless, important to determine whether published model atmosphere spectra also yield , because such models are only viable if this is the case.
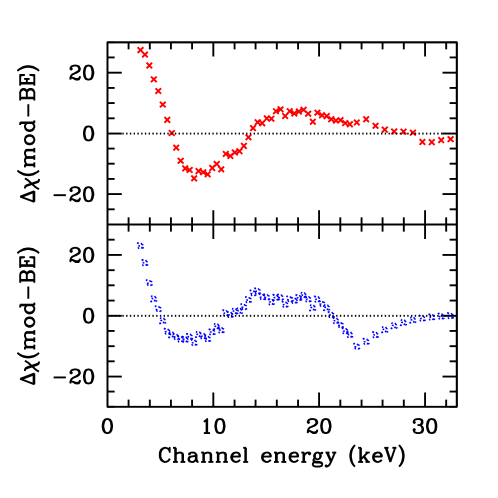
We show such a comparison in Figure 3, where we compare representative models from [5, 7] with the same 64 seconds of data from the 4U 1820–30 superburst that we used previously. A direct fit of the data is not possible, because the available grids of these models are not fine enough and the relevant composition (pure helium) is not computed. Therefore, as we did in [1], we compare the shape of the model spectra with the shape of Bose-Einstein spectra. That is, starting from our observation that the observed spectra are very close to Bose-Einstein in form, we produce synthetic RXTE data using the model spectra and fit those data with a Bose-Einstein model. As can be seen from Figure 3, there are strong and systematic deviations between these shapes. These deviations are similar for different compositions (H/He with no metals versus a solar composition), surface gravities ( versus 14.3), effective temperatures ( K versus K), and surface radiative fluxes relative to the Eddington flux ( versus ). We conclude that the spectral shape predicted by these models is significantly different from what is observed. We also found this to be true in a later segment of data where the observed flux was % of the maximum, versus % in our primary data set.
Given that use of spectral models that are inconsistent with the best data may introduce systematic errors in estimates of neutron star masses and radii, caution seems warranted. An additional indicator of possible biases in such estimates was mentioned briefly by [3], and in more detail by [9]. When the standard assumptions of Eddington luminosity at touchdown and full-surface uniform emission in the burst tail are employed along with the best measurements of quantities such as the distance, touchdown flux, and area normalization, the derived mass and radius are not real but are instead complex quantities, an obvious impossibility. Indeed, [9] find that only a fraction of the prior probability distribution of these quantities employed by [3] allow a solution for 4U 1820–30. Such a small allowed region in parameter space produces small error bars on the mass and radius, but may indicate that the assumptions on which the analysis is based are incorrect.
Although previously published models differ strongly from the most precise data, more recent models show promise of much better fits. We discuss these in the next section.
4 More Recent Models and Future Directions
Recently, new burst model atmosphere spectra have been calculated [11]. These spectra were computed using an approximate scattering integral (e.g., the Fokker-Planck approximation was made), but a fine enough grid was constructed with enough different compositions (including pure helium) that they could be fit directly to PCA data. Our preliminary results using these spectra are very encouraging; for example, a pure helium atmosphere with fits our 64-second segment of data with . This is better, but not significantly, than the best fit of Bose-Einstein spectra to the same data. These new models provide comparably good fits to data later in the burst, when the observed flux is half the maximum and previously published models still have shapes strongly discrepant with what is observed.
This is encouraging, and one might at first imagine that this would allow us to apply the van Paradijs [12] method using the models reported in [11] or new ones computed without some of the current approximations. Unfortunately, this appears not to be the case. We fit 102 consecutive 16-second data segments near the beginning of the 4U 1820–30 superburst (but after apparent touchdown) using the models from [11], and found that even when we fixed the surface gravity and surface redshift (hence fixing the radius of the emitting surface) the inferred size of the emitting area changes systematically by % over the data segments. One might wonder whether the whole star is, in fact, emitting but the photospheric or thermalization radius is changing. But a change of the amount observed would require a surface radiative flux very close to Eddington to achieve the necessary large scale height, and such fluxes are highly inconsistent with the observed spectra. Instead, it appears that the fraction of the surface that emits changes systematically, in conflict with the standard simplifying assumption of the van Paradijs method.
The encouragingly good fits using the models from [11] do suggest an alternative method for determining the mass and radius, originally suggested in [6]. In addition to composition and surface radiative flux, the surface gravity is a parameter in the models and to relate the surface spectrum to what we see at infinity we must also include the surface redshift in the fit. The surface gravity and surface redshift depend differently on the gravitational mass and circumferential radius ; for example, for a nonrotating star whose exterior spacetime is therefore Schwarzschild, and . Inverting then gives us
| (2) |
where is the speed of light and is Newton’s constant. Thus, if the surface redshift and surface gravity can be constrained separately, we can constrain and .
To do this requires fits to the data that (1) are dramatically better than Bose-Einstein fits, so that we have some confidence in the inferences we draw from model atmosphere spectra, and (2) distinguish between compositions, surface gravities, and surface redshifts. Our work on this program, which we are undertaking in collaboration with Valery Suleimanov and Juri Poutanen, has yielded good initial results. We find that when we fit the 102 contiguous 16-second segments of data from the 4U 1820–30 superburst mentioned previously, assuming that the composition, surface gravity, and surface redshift remain the same for all segments but that the surface radiative flux can change, one example fit of the Suleimanov et al. models gives . In contrast, the best Bose-Einstein joint fit to the data, where we allow the temperature and chemical potential to vary independently between segments, gives . This comparison strongly favors the model atmosphere spectra, and there are preliminary indications that composition, surface gravity, and surface redshift can be constrained. However, we caution that because the current models are known to make approximations compared to the exact scattering kernel, any conclusions are premature at this point. Nonetheless, this approach seems promising.
In summary, we have recently performed the first comparison of predicted spectra with the highest-precision data available from the RXTE PCA. We found that although a Bose-Einstein spectrum fits all individual segments well, previously published model atmosphere spectra have shapes strongly inconsistent with the observed spectra. This suggests caution in inferences made using these spectra. New spectral models provide promising descriptions of the highest-precision data and may restrict the mass and radius via constraints on the surface gravity and redshift, once they have been made more accurate.
These results are based on research supported by NSF grant AST0708424 at Maryland and by NSF grant AST0709015 and the Fortner Chair at Illinois.
References
- [1] S. Boutloukos, M. C. Miller, & F. K. Lamb, Super-Eddington Fluxes During Thermonuclear X-ray Bursts, ApJ, 720, L15 (2010).
- [2] A. J. Foster, A. C. Fabian, & R. R. Ross, Neutron star model atmospheres - A comparison with MXB 1728–34, MNRAS, 221, 409 (1986).
- [3] T. Güver, P. Wroblewski, L. Camarota, & F. Özel, The Mass and Radius of the Neutron Star in 4U 1820–30, ApJ, 719, 1807 (2010).
- [4] R. A. London, W. M. Howard, & R. E. Taam, The spectra of X-ray bursting neutron stars, ApJ, 287, L27 (1984).
- [5] J. Madej, P. C. Joss, & A. Różańska, Model atmospheres: Hydrogen-Helium Comptonized Spectra, ApJ, 602, 904 (2004).
- [6] A. Majczyna & J. Madej, Mass and radius determination for the neutron star in X-ray burst source 4U/MXB 1728-34, Act. Astr., 55, 349 (2005)
- [7] A. Majczyna, J. Madej, P. C. Joss, & A. Różańska, Model atmospheres and X-ray spectra of bursting neutron stars. II. Iron rich comptonized spectra, A&A, 430, 643 (2005).
- [8] H. L. Marshall, Constraints on the parameters of X-ray burster emission regions, ApJ, 260, 815 (1982).
- [9] A. W. Steiner, J. M. Lattimer, & E. F. Brown, The Equation of State from Observed Masses and Radii of Neutron Stars, ApJ, 722, 33 (2010).
- [10] T. E. Strohmayer & E. F. Brown, A Remarkable 3 Hour Thermonuclear Burst from 4U 1820-30, ApJ, 566, 1045 (2002).
- [11] V. Suleimanov, J. Poutanen, & K. Werner, X-ray bursting neutron star atmosphere models: spectra and color corrections, A&A, 527, 139 (2011)
- [12] J. van Paradijs, Possible observational constraints on the mass-radius relation of neutron stars, ApJ, 234, 609 (1979)