Gemini/GMOS Imaging of Globular Cluster Systems in Five Early-type Galaxies††thanks: Based on observations obtained at the Gemini Observatory, which is operated by the Association of Universities for Research in Astronomy, Inc., under a cooperative agreement with the NSF on behalf of the Gemini partnership: the National Science Foundation (United States), the Science and Technology Facilities Council (United Kingdom), the National Research Council (Canada), CONICYT (Chile), the Australian Research Council (Australia), Ministério da Ciência e Tecnologia (Brazil) and Ministerio de Ciencia, Tecnología e Innovación Productiva (Argentina).
Abstract
This paper presents deep high quality photometry of globular cluster (GC) systems belonging to five early-type galaxies covering a range of mass and environment. Photometric data were obtained with the Gemini North and Gemini South telescopes in the filter passbands g′, r′, and i′. The combination of these filters with good seeing conditions allows an excellent separation between GC candidates and unresolved field objects. In fact, our previously published spectroscopic data indicates a contamination level of only 10 percent in our sample of GC candidates. Bimodal GC colour distributions are found in all five galaxies. Most of the GC systems appear bimodal even in the (g′-r′) vs (r′-i′) plane. A population of resolved/marginally resolved GC and Ultra Compact Dwarf candidates was found in all the galaxies. A search for the so-called “blue tilt” in the colour-magnitude diagrams reveals that NGC 4649 clearly shows that phenomenon although no conclusive evidence was found for the other galaxies in the sample. This “blue tilt” translates into a mass-metallicity relation given by Z . This dependence was found using a new empirical (g′-i′) vs [Z/H] relation which relies on an homogeneous sample of GC colours and metallicities. This paper also explores the radial trends in both colour and surface density for the blue (metal-poor) and red (metal-rich) GC subpopulations. As usual, the red GCs show a steeper radial distribution than the blue ones. Evidence of galactocentric colour gradients is found in some of the GC systems, being more significant for the two S0 galaxies in the sample. Red GC subpopulations show similar colours and gradients to the galaxy halo stars in their inner region. A GC mean colour-galaxy luminosity relation, consistent with [Z/H] , is present for the red GCs. An estimate of the total GC populations and specific frequency SN values is presented for NGC 3115, NGC 3923 and NGC 4649.
keywords:
galaxies: elliptical and lenticular, cD -galaxies: star clusters: general -globular clusters: general1 Introduction
The idea that globular clusters (GCs) are good tracers of very early events in the lives of galaxies was put forward many years ago (e.g. Eggen, Lynden Bell & Sandage 1962; Searle & Zinn 1978). A thorough description of all the important aspects is given, for example, in Brodie & Strader (2006). However, some key issues, such as the relation between GCs and galaxy field stars, still remain as open questions (see Kissler-Patig 2009). If such a relation does exist, some galaxy properties could be described in terms of the characteristics of their globular cluster systems (GCS). A tentative approach in this direction (Forte, Faifer & Geisler 2007, 2009) assumes that GCs formation efficiency depends on chemical abundance, and leads to a quantitative connection between field stars and GCs. In turn, this type of connection allows further analysis of the different GCs-galaxy formation scenarios found in the literature (e.g. Ashman & Zepf 1992; Forbes et al. 1997; Beasley et al. 2002; Muratov & Gnedin 2010).
In this work we present new photometry for the GCS of five early-type galaxies, using the imaging capabilities of the GMOS instruments on the Gemini telescopes. This is part of a long term study to obtain both imaging and spectra for these GCS. Our first spectroscopic results were published for NGC 3379 (Pierce et al. 2006a), NGC 3923 (Norris et al. 2008) and NGC 4649 (Pierce et al. 2006b; Bridges et al. 2006). In particular, we aim at a detailed characterization of the most relevant photometric features of each GCS, such as colour bimodality, galactocentric colour gradients, spatial distributions, and the presence (or absence) of the so called “blue tilt” in the colour-magnitude diagrams of the GCS. All of these results will be later analyzed in combination with the final spectroscopic sample. Additionally, a search for Ultra Compact Dwarf (UCD) candidates was performed in each galaxy.
The paper is organized as follows. The galaxy sample is described in section 2, photometric observations and data handling in section 3, results in terms of colour-magnitude and colour-colour diagrams, colour histograms, spatial distributions, galactocentric colour gradients and GC integrated luminosity functions are presented in section 4 and, finally, a summary is given in section 5.
2 The galaxy sample
Our sample consists of five nearby early-type galaxies that cover a range of mass. These galaxies have been imaged in several filters over multiple pointings with the GMOS instrument on the Gemini telescopes. Basic data for the sample studied in this paper, ordered by decreasing luminosity (and presumably decreasing mass) are listed in Table 1. The sample comprises two S0 and three ellipticals (E), with B band luminosities in the range MB = –19.94 to –21.43. They are located in field (NGC 3115), group (NGC 3923, NGC 524 and NGC 3379) and cluster (NGC 4649) environments. In this work we have adopted the distance modulus from the surface brightness fluctuation method presented by Tonry et al. (2001). This provides an homogeneous source which can easily be converted to other distance scales, such as that of Jensen et al. (2003). In the following we give a short description of each galaxy with references to earlier work pertaining to their GCS.
| Galaxy | l | b | Type | B | MB | AB | (m–M)0 | Log LX | Environ | ||
|---|---|---|---|---|---|---|---|---|---|---|---|
| (h:m:s) | () | () | () | (mag) | (mag) | (mag) | (mag) | (erg/s) | |||
| NGC 4649 | 12:43:39.7 | +11:33:09.4 | 295:52:10.2 | 74:19:3.36 | E2 | 9.70 | 21.43 | 0.116 | 31.130.15 | 41.28 | Cluster |
| NGC 3923 | 11:51:01.8 | 28:48:22.0 | 287:16:34.0 | 32:13:21.4 | E4-5 | 10.62 | 21.18 | 0.362 | 31.800.28 | 40.66 | Group |
| NGC 524 | 01:24:47.7 | +09:32:20.0 | 136:30:20.2 | 52:27:05.4 | S0 | 11.17 | 20.73 | 0.362 | 31.900.20 | 40.53 | Group |
| NGC 3115 | 10:05:14.1 | 07:43:07.0 | 247:46:58.8 | 36:46:53.0 | S0 | 9.74 | 20.19 | 0.207 | 29.930.09 | 39.72 | Field |
| NGC 3379 | 10:47:49.6 | +12:34:54.0 | 233:29:24.7 | 57:37:58.4 | E1 | 10.18 | 19.94 | 0.107 | 30.120.11 | 39.52 | Group |
| Comparison | 22:37:24.2 | 22:48:20.5 | 86:44:10.8 | 30:29:07.5 | |||||||
| WHDF | 00:22:32.8 | 00:21:07.5 | 107:34:49.5 | 61:39:20.7 |
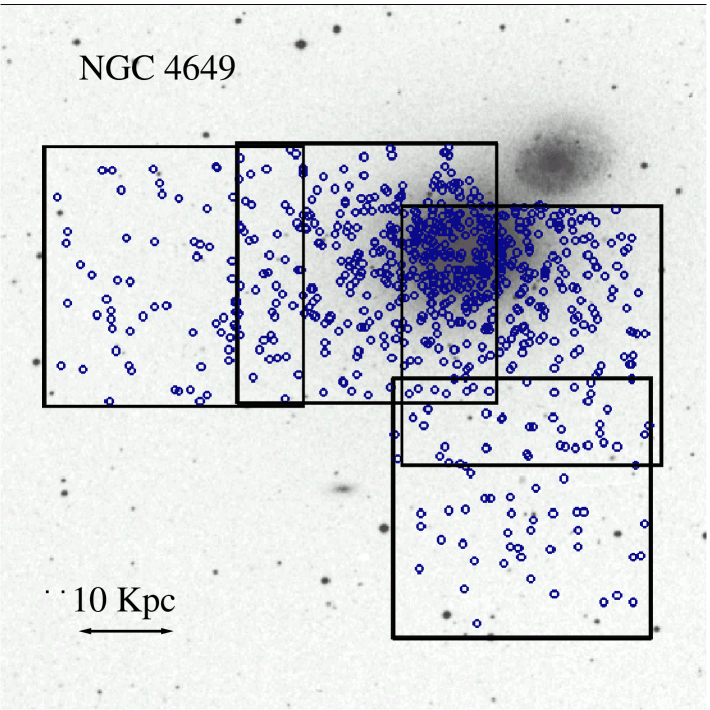
NGC 4649 Also known as M60, this Virgo Cluster member is a giant elliptical (E2) within the Virgo cluster and located in a sub-group to the East of the main cluster concentration. NGC 4647, a spiral some 2.5 arcmin to the NW of NGC 4649, appears to be a background object since there is no evidence of reddening produced by this spiral on NGC 4649 (White, Keel & Conselice 2000) and no evidence of interaction between them. The GMOS fields presented here, and in our earlier work (Forbes et al. 2004), were chosen to minimize the effect of possible contamination of the NGC 4649 GC system by NGC 4647 GCs.
With a luminosity of MB = –21.43, NGC 4649 is the most massive galaxy in our sample. Based on spectra of the central region, Terlevich & Forbes (2002) used Lick indices to measure an old age of 11 Gyr and a metallicity of [Fe/H] = 0.3. NGC 4649 shows strong X-ray emission arising from a hot gas halo (O’Sullivan et al. 2001). Chandra observations reveal the presence of numerous discrete sources that are mostly identified as low mass binaries (LXMBs) within NGC 4649’s globular clusters (Sarazin et al. 2003; Randall, Sarazin & Irwin 2004). Using the XMM satellite, Randall, Sarazin & Irwin (2006) present a hot gas density profile of slope –1.5 0.1, determined between radii of 10 and 300 arcsec. Fukazawa et al. (2006) included this galaxy in their study of 53 ellipticals using archival Chandra X-ray data. Fitting a model to the X-ray surface brightness profile they obtained a value of =0.512, corresponding to a power-law slope of –2.07.
The NGC 4649 GCS was studied by Couture, Harris & Allwright (1991) in the B and V bands. Within the small CCD (2.1 x 3.4 arcmin) area, no bimodality was detected and the authors derived a mean colour of (B-V) = 0.75 based on 82 globular cluster candidates.
Bimodality in the GCs colour distribution was detected by Larsen et al. (2001) on the basis of HST/WFPC2 observations that found colour peaks at (V-I)0 = 0.95 and 1.26. This bimodality was confirmed by Forbes et al. (2004) in the g′ and i′ bands using Gemini/GMOS imaging. These authors estimated a total GC population of 3700 900, giving a specific frequency SN = 4.1 1. These values are in good agreement with those presented by Lee et al. (2008) in their Washington CT1 photometric study. Pierce et al. (2006b) found that most of their 38 spectroscopically-confirmed GCs are old ( 10 Gyr), but they found some young and super-solar metallicity GCs. This sample was used by Bridges et al. (2006) to analyze the GC kinematics and dark matter content of NGC 4649 within 3.5 effective radii (20 kpc). No rotation of the GCS was detected, and both isotropic and axisymmetric orbit-based models gave support for the presence of a dark matter halo in NGC 4649.
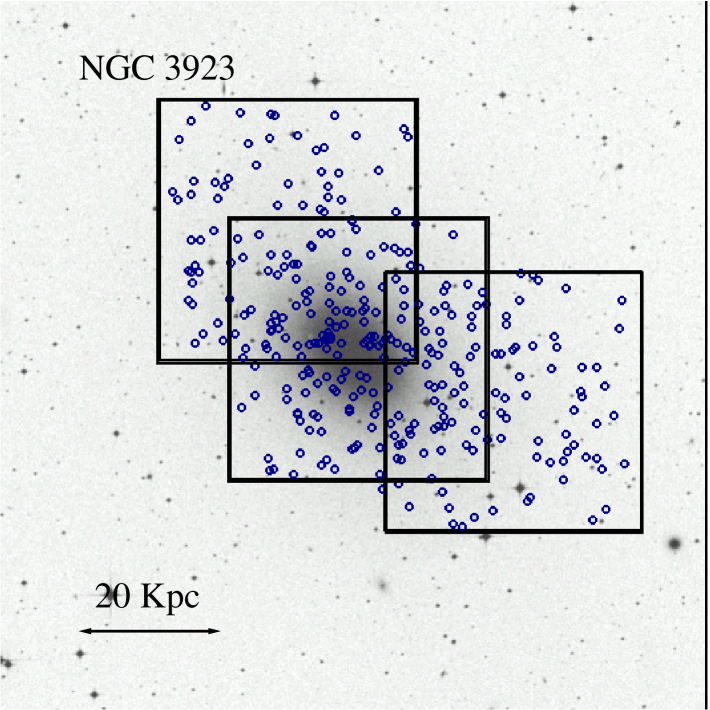
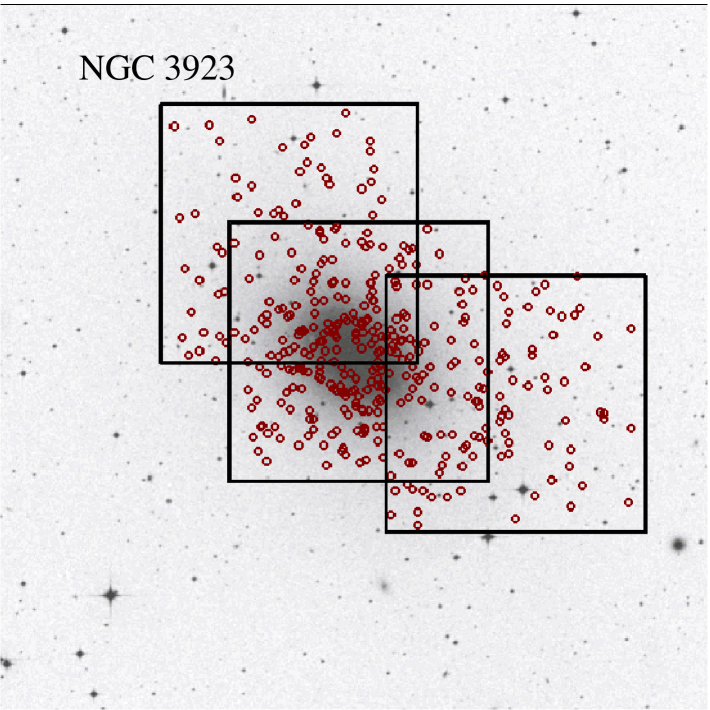
NGC 3923 This is an E4-5 galaxy within a small group and exhibits a well known shell structure (Malin & Carter 1980). These kind of structures are frequent in ellipticals and S0 galaxies not belonging to galaxy clusters (Schweizer & Seitzer 1992), and they are usually identified as the result of an interaction or merger (e.g. Thomson & Wright 1990; Quinn 1984). These shell structures may be long-lived and therefore an interaction/merger event may have occurred long time ago.
From spectroscopic data, Thomas et al. (2005) and Denicoló et al. (2005) derive a central galaxy age of 3.4 and 2.6 Gyrs respectively. Thus about 3 Gyrs ago, the galaxy appears to have experienced a central starburst (perhaps induced by the same event that created the shells). The galaxy has a halo of hot gas (e.g. O’Sullivan et al. (2001)). Using the ROSAT satellite, Buote & Canizares (1999) fit a model to the X-ray surface density profile out to 500 arcsec and derived a power-law slope of –1.76 0.02. Fukazawa et al. (2006) fitted a double model to the X-ray surface brightness and found values of 0.598/0.314 for the less/more extended component. These values correspond to power-law slopes of –2.54/–0.88.
Two previous photometric studies (Zepf, Geisler & Ashman 1994; Zepf, Ashman & Geisler 1995) using ground-based Washington C and T1 photometry, noted the presence of colour peaks at (C-T1) = 1.47 and 1.87, somewhat redder than typical values. This led these authors to suggest a higher than average metal content for the NGC 3923 GCs. The total globular cluster population was estimated to range from 2000 to 7000 and the SN, from 4.4 to 7.3. More recently Sikkema et al. (2006) using HST/ACS imaging measured similar blue and red GC projected density slopes of –0.87. However, their fits were obtained within the central 100 arcsec and could be affected by the flattening of the inner GC profiles as seen in many other galaxies. They obtained a SN value of 5.6, and concluded that NGC 3923 has the highest SN of any isolated elliptical.
Norris et al. (2008) found that the GCs spectroscopically examinated are old ( 10 Gys) with -1.8 to 0.35. Additionally, they show that the diffuse light of the galaxy at is found to have ages, metallicities and [/Fe] abundance ratios indistinguishable from those of the red GCs.
There are two spectroscopically confirmed UCDs in this galaxy, found by Norris & Kannappan (2011).
NGC 524 This galaxy is part of a group that includes at least eight smaller galaxies known as CfA 13 (Geller & Huchra 1983). This group was detected in the X-ray study by Mulchaey et al. (2003). The parameter fitted to this galaxy is 0.410.02, which translates into a power-law slope of –1.460.12. The galaxy nucleus appears to be chemically decoupled from its bulge, being about 0.5–0.6 dex more metal-rich according to Sil’chenko, Afanasiev & Vlasyuk 1992 and Sil’chenko (2000), who also find evidence for a dusty disk and ionized gas within 3 kpc of the galaxy centre.
Harris & Hanes (1985) found a rich and extended GCS with some 2830 880 clusters. Larsen et al. (2001) used a KMM analysis on HST/WFPC2 data to find colour peaks at (V-I)0 = 0.98 and 1.19 mag. More recently, Beasley et al. (2004) found a broad (V-I) colour distribution and the possible existence of peaks at (V-I)0 = 0.9 and 1.1. However, none of these results are conclusive. Beasley et al.’s Keck/LRIS spectra of a small sample of GCs points to a metallicity range from [Fe/H] = –2.0 to 0.0 and a decreasing trend of the [/Fe] ratio with metallicity. The GCs are generally consistent with being old. Regarding UCDs, there is one confirmed object by Norris & Kannappan (private communication).
NGC 3115 This is a relatively isolated S0 galaxy with a dominant bulge, located to the South of the Leo group. The X-ray emission from NGC 3115 is low, contained within 10 kpc, and probably dominated by discrete sources (Fukazawa et al. 2006). Its GC system is bimodal with colour peaks at (V-I)0 = 0.96 and 1.17, and has a low local SN value of 1.3 within the inner region of the galaxy (Kundu & Whitmore 1998). These authors also find that while the red GCs subpopulation has a spatial distribution comparable to that of the thick disk, the blue GCs exhibit a distribution more similar to the bulge/halo.
Selecting from the Kundu & Whitmore (1998) GCs sample, Kuntschner et al. (2002) derived spectroscopic ages and metallicities for 17 GCs, finding both subpopulations to be 12 Gyr old and coeval within 2 to 3 Gyr. This result is consistent with Puzia et al. (2002) who also find coeval ages within 3 Gyr.
From GMOS spectroscopy of the galaxy halo, Norris, Sharples & Kuntschner (2006) calculated an age of 10 to 12 Gyr, similar to that of the GCs. They also obtain an [/Fe] ratio of 0.2–0.3, consistent with the typical GC values.
NGC 3379 This galaxy is the dominant object of the nearby Leo group. Terlevich & Forbes (2002) derive an old central age of 9.3 Gyr, consistent with ages larger than 8 Gyr determined through HST-NICMOS observations of resolved stars by Gregg et al. (2004). The galaxy contains a very modest hot gas halo, and Revnivtsev et al. (2008) suggest that a significant contribution to the observed X-ray flux of the galaxy comes from unresolved point sources.
From a CCD study of the NGC 3379 GC system, Ajhar et al. (1994) detected 60 GCs but no evidence of bimodality. Using HST/WFPC2, Larsen et al. (2001) confirmed that NGC 3379 contains a poor GCS. Both Whitlock, Forbes & Beasley (2003) and Rhode & Zepf (2004) found evidence of bimodality using broad band colours. These last authors estimated a total GC population of 270 clusters giving a low SN value of 1.2 0.3.
In their spectroscopic study, Pierce et al. (2006a) found the GCs to be consistent with old ages, i.e. 10 Gyr, with a wide range of metallicities.
3 Data
3.1 Observations and Data Reduction
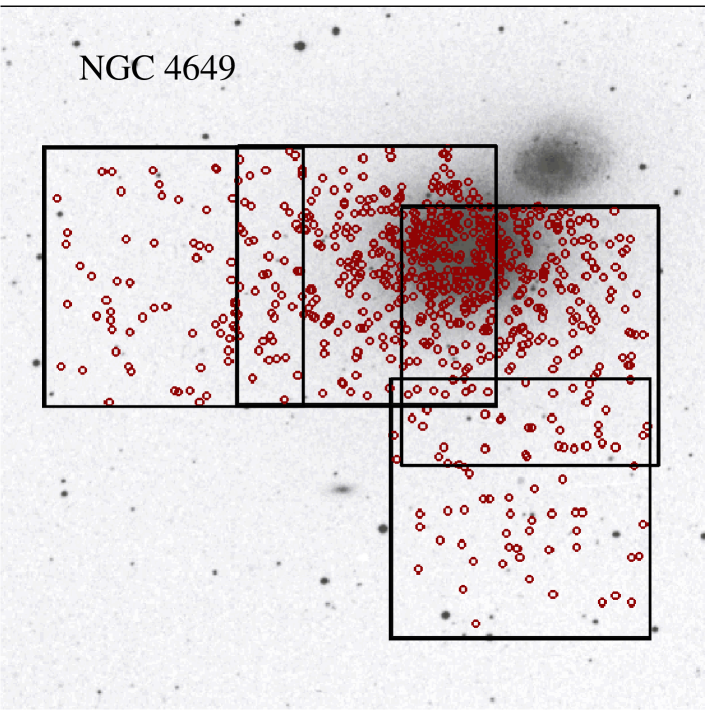
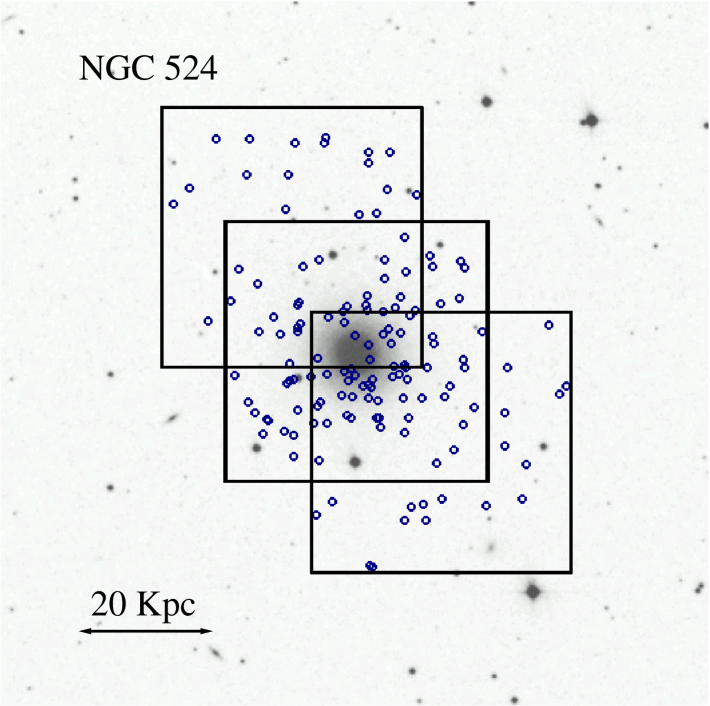
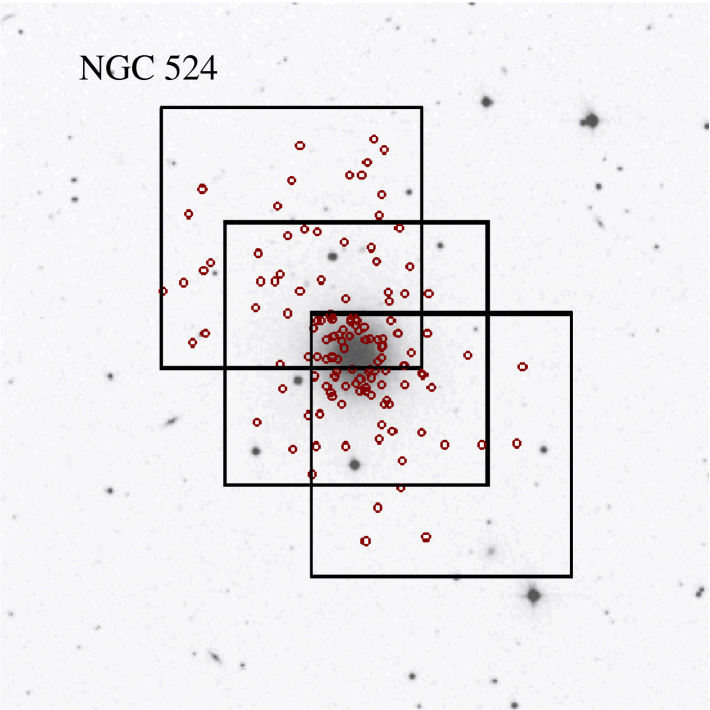
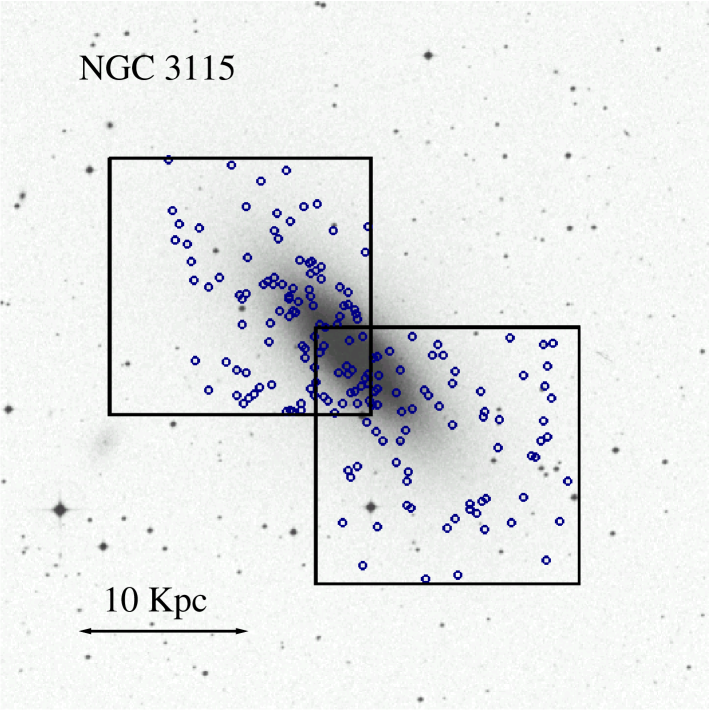
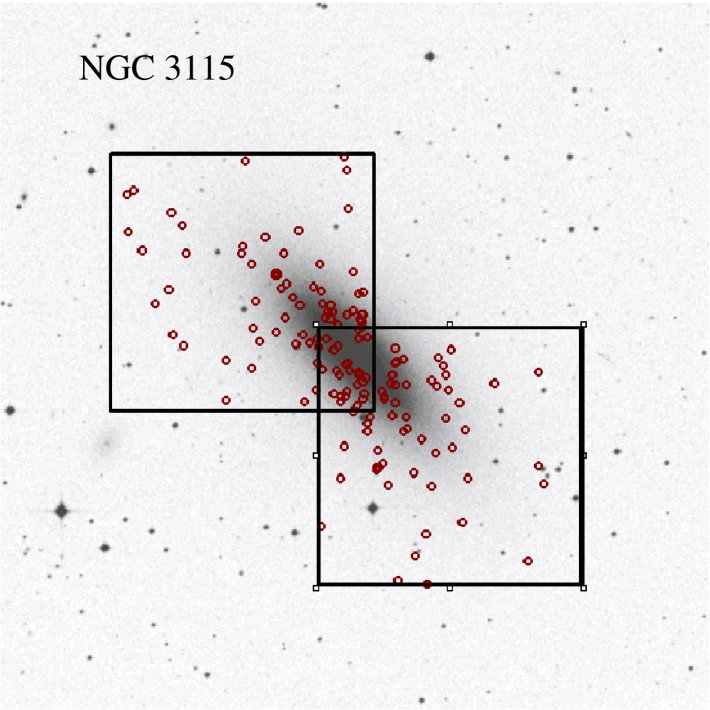
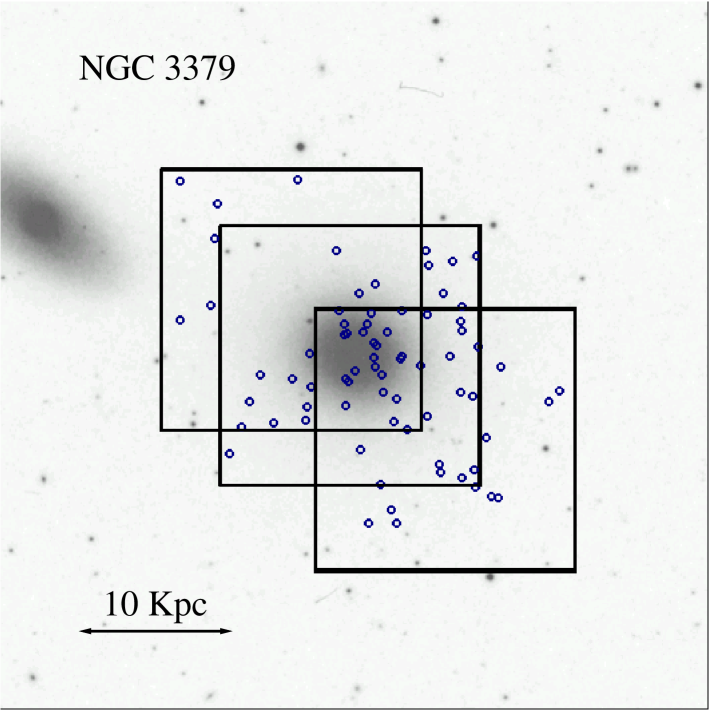
The images presented here were taken using GMOS (Hook et al. 2004)111Further information on GMOS can be found on the instrument homepage (http://www.gemini.edu/sciops/instruments/gmos/) in imaging mode on both the Gemini South and Gemini North telescopes. The instruments consist of three pixel CCDs, with a scale of 0.0727 arcsec pixel-1. We used binning, yielding a 0.146 arcsec pixel-1 scale. The GMOS camera has a field-of-view of . Except for NGC 524 and our Comparison Field (where we had to reject and repeat some bad images), four images per field were taken for each of the three SDSS filters g′, r′ and i′ (Fukugita et al. 1996). The telescope was dithered between exposures to facilitate cosmic-ray removal and to fill the gaps between the CCD chips. Details of the observational parameters are given in Table 2. In addition, we make use of the William Herschel Deep Field to help estimate contamination (see Sec 3.4). Fig. 1 shows the positions of the GMOS fields around each galaxy superimposed on Digital Sky Survey images.
With the aim of obtaining a homogeneous photometric sample, we re-reduced the images provided by Gemini. The raw images were processed using the Gemini GMOS package within IRAF 222IRAF is distributed by the National Optical Astronomical Observatories,which are operated by the Association of Universities for Research in Astronomy, Inc., under cooperative agreement with the National Science Foundation (GPREPARE, GBIAS, GIFLAT, GIREDUCE, GMOSAIC). In all cases we chose suitable sets of raw bias and flat-field frames from the available data in the Gemini Science Archive (GSA). The images taken with the i′ band filter on Gemini South show considerable fringing. We therefore built suitable fringe images from seven exposures of blank sky regions taken as part of the baseline calibration the night after the observations of NGC 3923 and NGC3115. These frames were used to correct i′ images (listed in table 2) by means of the GIFRINGE and GIRMFRINGE tasks. The resulting images for each filter were then co-added and cosmic-ray cleaned using IMCOADD. Because the images were taken in queue mode, some of them were obtained under slightly different sky conditions. As a consequence, we set “fl_scale = yes” in order to combine images with different FWHM and signal. In this step, we tuned some IMCOADD parameters such as “aperture”, “statsec”, and set “scalenoise ” in order to avoid losing good pixels and spurious zero points offsets during the adding process. These final co-added images were then used for all the subsequent data analysis.
3.2 Photometry
Galaxy light subtraction was done using an iterative combination of the SExtractor background modelling approach (Bertin & Arnouts 1996) and median filtering, in a similar way to that presented in Puzia et al. (2004). This procedure was implemented in a script which yields a catalogue of all the objects detected by SExtractor and a galaxy light subtracted image. This software gives better results than IRAF tasks such as DAOFIND. As in Forbes et al. (2004), the i′ band objects list was adopted as input for the subsequent photometry. At the distance of the targets listed in Table 1 most of the GCs would be expected to be unresolved (starlike) sources. The Daophot package (Stetson 1987) within IRAF was used to obtain psf magnitudes for all objects detected by SExtractor, and they were then separated into resolved and unresolved objects following the outline presented in Section 3.3. After that, aperture photometry was obtained for all the resolved objects. For this purpose we have used the PHOT task with a fixed 2 arcsecond aperture. This means that we have good photometry for unresolved and marginally resolved objects. A “master” catalogue of resolved and unresolved objects was built by combining photometry of objects successfully measured in all three filters.
We searched in the GSA for standard star fields observed during the same nights as our targets and the Comparison Field. They were re-reduced using the same biases and flats applied to our science frames. The synthetic transformation from Fukugita et al. (1996) was adopted to obtain the g′, r′, i′ standard magnitudes. Because of the small number of the available standards, usually 3-4 stars, and their very limited range in airmass, this calibration was suitable only for establishing a mean zero-point value for our frames, and not for a more complete evaluation of the coefficients in airmass or colour (see Table 3). Thus, we measured these zero points, and we used the atmospheric extinction coefficients given by the Gemini web page.
NGC 4649 is an exception because standards were not observed at the same night as our program fields. So, in this case, we adopted the mean zero points obtained from the three sets of standards (about five stars per field) observed during the Gemini North GMOS run of March 2007.
For each galaxy, the field with the best overall seeing in the three filters and having a corresponding standard stars field, was adopted as the reference for the photometry. A list of common objects in each field was used to obtain any small zero point differences among the pointings. Finally, we applied the galactic extinction coefficients given by Schlegel, Finkbeiner & Davis (1998), and used their Table 6 to transform them into A, A and A. Thus we quote extinction corrected magnitudes and colours in this paper.
| Galaxy | Gemini ID | Fields | Texp.(s) | FWHM (arcsec) |
|---|---|---|---|---|
| g′ r′ i′ | g′ r′ i′ | |||
| NGC 4649 | GN-2007A-Q-37 | 1 | 4x120 4x120 4x120 | 0.48 0.49 0.48 |
| 2 | 4x120 4x120 4x120 | 0.48 0.45 0.45 | ||
| GS-2007A-Q-49 | 3 | 4x120 4x120 4x120 | 1.11 1.05 1.12 | |
| GN-2007A-Q-37 | 4 | 4x120 4x120 4x120 | 0.51 0.51 0.47 | |
| NGC 524 | GN-2002B-Q-25 | 1 | 4x150 4x100 4x100 | 0.67 0.60 0.65 |
| 2 | 6x150 4x100 5x100 | 0.85 0.76 0.72 | ||
| 3 | 4x100 4x100 5x100 | 0.79 0.81 0.84 | ||
| NGC 3379 | GN-2003A-Q-22 | 1 | 4x200 4x100 4x100 | 1.03 0.99 0.84 |
| 2 | 4x200 4x100 4x100 | 0.54 0.54 0.52 | ||
| 3 | 4x200 4x100 4x100 | 0.93 0.98. 0.90 | ||
| NGC 3115 | GS-2004A-Q-9 | 1 | 4x200 4x100 4x100 | 0.77 0.65 0.53 |
| 2 | 4x200 4x100 4x100 | 0.80 0.84 0.70 | ||
| NGC 3923 | GS-2004A-Q-9 | 1 | 4x200 4x100 4x100 | 0.79 0.68 0.67 |
| 2 | 4x200 4x100 4x100 | 0.72 0.62 0.55 | ||
| 3 | 4x200 4x100 4x100 | 0.72 0.63 0.59 | ||
| Comp. Field | GN-2003A-Q-22 | 1 | 3x200 3x100 3x100 | 0.64 0.55 0.50 |
| WHDF | GN-2001B-SV-104 | 1 | 6x300 6x300 6x300 | 0.86 0.67 0.67 |
| Blank-sky | GS-CAL20040120 | 1 | 7x300 | 0.47 |
3.3 Object classification and completeness


The classification between resolved and unresolved sources was carried out using the same procedure as in Forbes et al. (2004). Briefly, we used a combination of SExtractor Stellarity Index (0 for resolved objects and 1 for unresolved ones), and the positions of each object in the aperture minus PSF magnitude vs. PSF magnitude diagram (Forte et al. 2001, and see Fig. 1 and 2 from Forbes et al. 2004). This approach has been tested using our follow-up spectroscopic studies (Pierce et al. 2006a; Bridges et al. 2006; Norris et al. 2008), and combined with three-colour selection, has been very successful in giving a low contamination rate by background galaxies.
In order to quantify the detection limits of our photometry a series of completeness tests were carried out on each field using the ADDSTARS task. The i′ band magnitude range from 18.5 to 26.5 mag was divided into intervals of 0.1 mag. Then, trying to avoid crowding effects, 200 point sources were added to the original i′ images in each magnitude bin and the same procedure of galaxy light subtraction, detection and classification was followed to recover and classify the added sources. The positions of the artificial objects were created using a stochastic-generating Fortran program that follows the slope of the GC system spatial distribution. A total of 32000 artificial objects were added in two independent experiments per field.
As an example, Fig. 2 shows a typical result of this procedure. In this case, the results for each of the i′ fields of NGC 3923 are plotted. The left panel shows the fraction of artificial objects recovered versus the input magnitude for each field. The right panel shows the completeness as a function of Rgal for three different magnitude bins in field 1. If a global completeness level is selected from the left plot, the right one shows that most of the objects are lost at small Rgal. That is, the completeness has a strong spatial dependence in the sense that the loss of objects is always larger at small radii. Taking this into account, and in order to ensure completeness levels greater than 50% and 90% for R arcsecs, we selected the i′ band limits listed in Table 3. The 50% level was used to define a sample of GC candidates, but we used the 90% level in the subsequent analysis.
3.4 Comparison Fields
| Galaxy | Completeness | |||||||||
|---|---|---|---|---|---|---|---|---|---|---|
| 90% | 50% | |||||||||
| NGC 4649 | 19.5-24.3 | 0.40-1.45 | 0.35-0.95 | 0.0-0.60 | 27.8850.005 | 28.2680.004 | 28.1900.006 | 23.90 | 24.30 | |
| NGC 3923 | 20.0-23.7 | 0.40-1.40 | 0.30-0.90 | 0.0-0.60 | 28.2390.006 | 28.1280.008 | 27.7110.009 | 23.30 | 23.70 | |
| NGC 524 | 20.4-23.5 | 0.40-1.40 | 0.30-0.90 | 0.0-0.60 | 27.6300.018 | 27.9920.028 | 27.7770.030 | 23.00 | 23.50 | |
| NGC 3115 | 18.4-23.5 | 0.40-1.40 | 0.30-0.90 | 0.0-0.60 | 28.2390.006 | 28.1280.008 | 27.7110.009 | 23.00 | 23.50 | |
| NGC 3379 | 18.6-23.2 | 0.40-1.40 | 0.30-0.90 | 0.0-0.60 | 27.9850.006 | 28.2150.005 | 27.9610.004 | 22.90 | 23.20 | |
| Comp. Field | 27.9050.017 | 28.1890.028 | 27.9770.017 | 24.00 | 24.33 | |||||
| WHDF | 27.9340.020 | 28.1840.029 | 27.9420.030 | 24.75 | 25.05 | |||||
In addition to the galaxy sample listed in Table 1, we include two comparison fields. One of them is the same as in Forbes et al. (2004). However, here we present re-reduced and re-calibrated data for this field.
We have applied the same object detection and classification procedures as for our program images. Fig. 3 shows, in the upper panel, the colour-magnitude diagrams for the unresolved and resolved objects in this field. For unresolved objects, we used psf magnitudes, while for resolved objects we used aperture photometry with 2 arcsec apertures. Most of the objects with magnitudes i and colours within the ranges adopted for GC candidates are resolved and were correctly classified (see Sec 4.1). However, for i the situation is very different and there are many point sources displaying (g′–i′) colours similar to those of GCs. Most of them are probably distant background galaxies.


In order to test the results obtained with our Comparison Field (CF), we applied our classification recipe on the William Herschel Deep Field (WHDF, Metcalfe et al. 2001). This field was observed with the same instrument and filters as our CF. The seeing in both fields is similar, so the only difference are the total exposure times (see Table 2). The 90% and 50% completeness levels obtained for our comparison field and the WHDF are listed in Table 3.
Fig. 3 shows, in the bottom panel, the colour-magnitude diagrams for unresolved and resolved objects detected in the WHDF. Clearly, there are two main differences between the two CMDs in Fig 3. First, the numbers of star-like objects brighter than i present in these fields are different. There are more stars in our CF than in the WHDF. This is easily seen in the red side of the CMD of the unresolved objects ((g′–i′) ).
The other difference is the appearance of the CMD at the low brightness extreme. The number of unresolved objects in the CF drops steeply at i , whereas in the WHDF it does not happen until i . The reason for this behaviour is that the process of classification improves with better S/N (i.e. with the deeper WHDF exposures we can make a better classification), and that the stellar content is not the same in both fields, as is to be expected given their different galactic latitudes. However, we note that the number of stars with colours adopted here for GC candidates is only 30% larger in the CF than in the WHDF. Comparing the star counts in this field with the number from the Besancon Galaxy models (Robin et al. 2003) we found a very good agreement for i . For fainter magnitudes the Besancon star counts are always smaller than the observed counts, possibly indicating a very strong contamination by unresolved background galaxies.
The analysis given in Fukugita et al. (1995) suggests that low redshift S, S0 and E galaxies and medium redshift Irr galaxies can show colours in the ranges adopted for the GC candidates. However, under good imaging conditions (i.e., sub-arcsecond FWHM) and making a careful image analysis, most of them are correctly classified as extended sources. The medium and high redshift galaxies are difficult to resolve from ground-based observation. However, most of these objects can be rejected by using (g′–i′), (g′–r′) and (r′–i′) colours.
This means that, for i, the nature of the contamination is mainly stellar. At fainter magnitudes, the contamination arising from faint background galaxies increases steeply.
In the subsequent analysis, we adopt an average of the counts in both fields to obtain the contamination levels of our photometry in NGC 3923, NGC 524, NGC 3115 and NGC 3379. In the case of NGC 4649, we chose to use only the WHDF as a comparison field for two reasons. The first is that the photometry in the CF is not deep enough. The second reason is that, as we will see in Section 4, the colour-magnitude diagrams of the objects detected in our four NGC 4649 fields show a very small number of objects outside the regions occupied by GC candidates. The main difference between the WHDF and our CF is the red side of the colour distribution.
4 Results
4.1 Color-magnitude and colour-colour diagrams
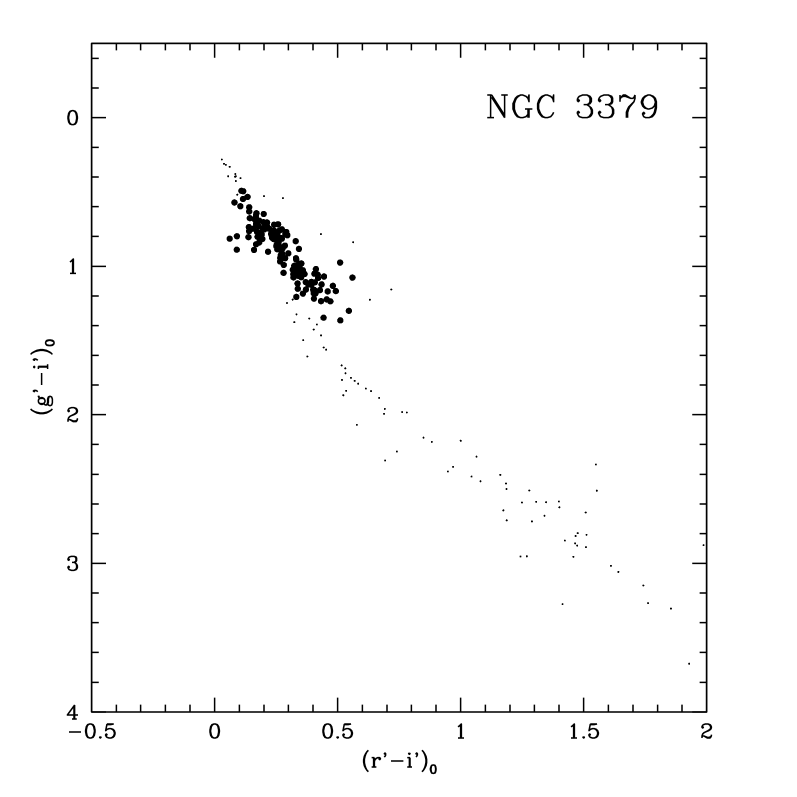
The colour-magnitude (CMDs) and colour-colour diagrams are presented in Fig. 4 for all point sources detected in our GMOS fields (small dots), ordered by decreasing BT brightness of the host galaxy. Magnitudes and colours were corrected for galactic extinction as indicated in Section 3.2. The mean (g′–i′) photometric errors are shown as small bars at (g′–i′)0. The dotted and long-dashed lines indicate the 50% and 90% completeness limits from our completeness tests, respectively.
In all diagrams the GCs can be easily seen as a group of objects clustered around (g′–i′)0 , (g′–r′)0 and (r′–i′)0 . In order to obtain a clean sample of GC candidates (rejecting MW stars and unresolved background galaxies), but allowing a reasonable range of GCs colours, we adopted the limits listed in Table 3. Regarding the magnitude limits, cuts were applied only on the i′ band magnitudes. The low brightness ends were defined by the 50% completeness level in the case of our photometric sample definition, and by the 90% completeness level for the analysis sample (that was used in the analysis presented in the following Sections).
For the high brightness end, the cuts were chosen in order to include all GC candidates with absolute magnitudes fainter than MI . The most massive galactic GC-like object, Cen, has an integrated magnitude of MI . However, M31’s most massive GC, G1, is considerably more luminous. Also, this upper limit is in agreement with the MV value suggested by Mieske et al. (2006a) to separate bright GCs from UCDs, and is similar to that found by Wehner & Harris (2007) for the Hydra UCD candidates. Adopting this upper limit, and utilizing common objects between our GMOS photometry and that of Larsen et al. (2001) from HST data, we obtain the (g′,i′)–(V,I) transformations:
| (1) |
| (2) |
| (3) |
Taking into account the distance modulus from Table 1 we obtain the upper cut values listed in Table 3, which roughly correspond to MI in each galaxy. Fig. 4 shows as filled circles all the point sources falling in the colour and magnitude ranges listed in Table 3 which we take as our GC candidates.
Most of the unresolved objects in our sample define clear sequences consistent with the locus of MW stars. The sparser appearance of the colour diagrams corresponding to NGC 524 is probably due to the slightly lower quality of the photometry. In the case of NGC 4649, we have higher quality and deeper photometry. The 50% completeness level is fainter than that in any other galaxy and therefore we expect a slightly higher level of contamination by faint background objects (as shown in Section 3.4, the number of background objects grows steeply for i).
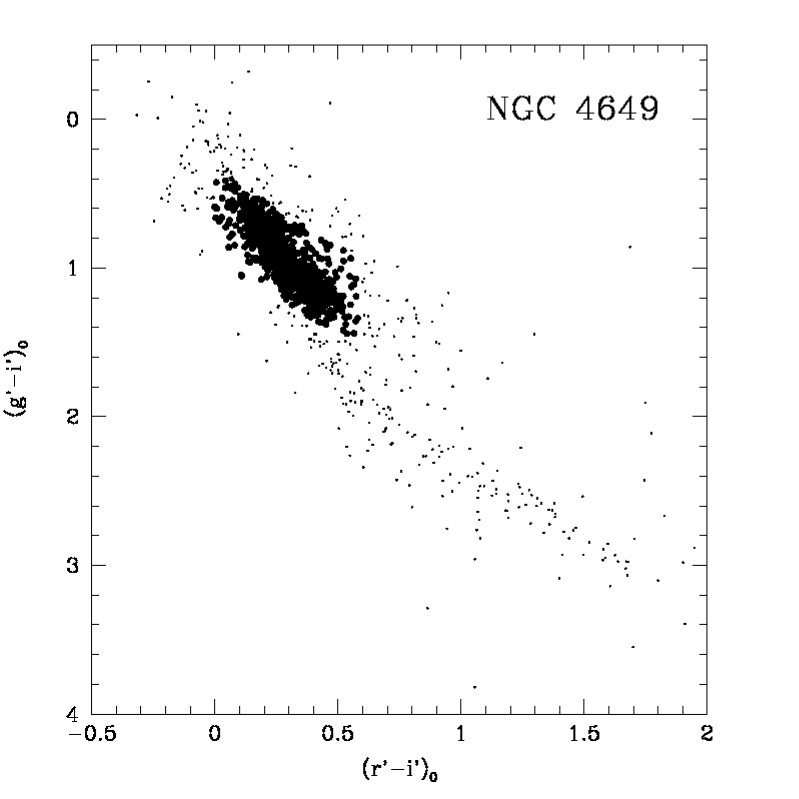
In both colour-colour diagrams the GC candidates form a short sequence which merges with MW stars in the blue extreme. Thus, a small fraction of the candidates with extreme colours (g′-i′)0, could in fact be Galactic stars.
As mentioned before, at the distances of the targets listed in Table 1 we can expect that the normal GCs will look like unresolved objects. However, in the case of NGC 4649 and NGC 3923, Bridges et al. (2006) and Norris et al. (2011) have found marginally resolved objects with colours similar to blue GCs which were confirmed as members of the NGC 4649 and NGC 3923 GC systems. Considering that most of the images in Table 3 were taken with sub-arcsecond image quality, and because two of our targets are relatively nearby systems, we have checked the possibility that other marginally resolved GC-like objects exist in the lists of extended ones. Therefore, we inspected by eye all objects classified as resolved, but having SExtractor shape parameters indicating roundness similar to that of point sources in each image. As noted in Section 3.3, good S/N is necessary to robustly determine these parameters, therefore we only analyzed objects brighter than i mag. Any object showing a complex structure was rejected and aperture photometry was performed on the remaining ones. They are indicated as blue open circles in the CMDs, and with the same symbols as GC candidates in the colour-colour diagrams. This sample of marginally resolved objects is expected to have a higher level of contamination by background galaxies than our final sample of GC candidates.
Since the half-light radii of UCD candidates (5-100 pc, according
to Mieske et al. 2008) are larger than those typical for GCs, we
have extended the inspection described
in the last paragraph to higher luminosities, including both unresolved
sources and marginally resolved ones. Plotting the point source UCD
candidates in the colour-colour
diagrams (see (g′–r′) vs. (r′–i′) panels for NGC 4649 and NGC 3923 in
Fig. 4), they seem to define two distinct groups. One of
them includes objects falling exactly on the GCs sequence. The other one
falls on the MW stellar sequence, which merges with that of the GCs at the
blue extreme. Considering this, we have classified our unresolved
UCD candidates as follows: “type I” if they belong to the first
group (the most secure, shown as red filled squares in Fig. 4), “type III” if
they belong to the second group (less secure, and probably MW
stars, shown as green filled pentagons in Fig. 4).
Additionally we have defined “type II” as those objects that
seem to overlap both groups (red circles in Fig. 4).
Some marginally resolved UCD candidates, shown as blue filled
triangles in Fig. 4, were also found. The full
photometric tables are presented in the Appendix.
In what follows we give a summary of each GCs system:
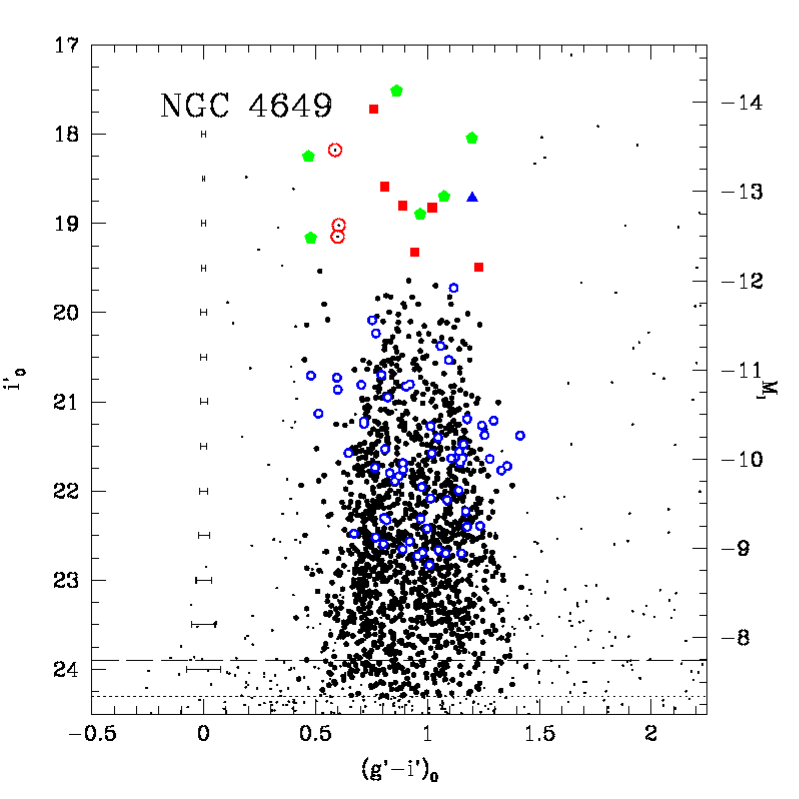
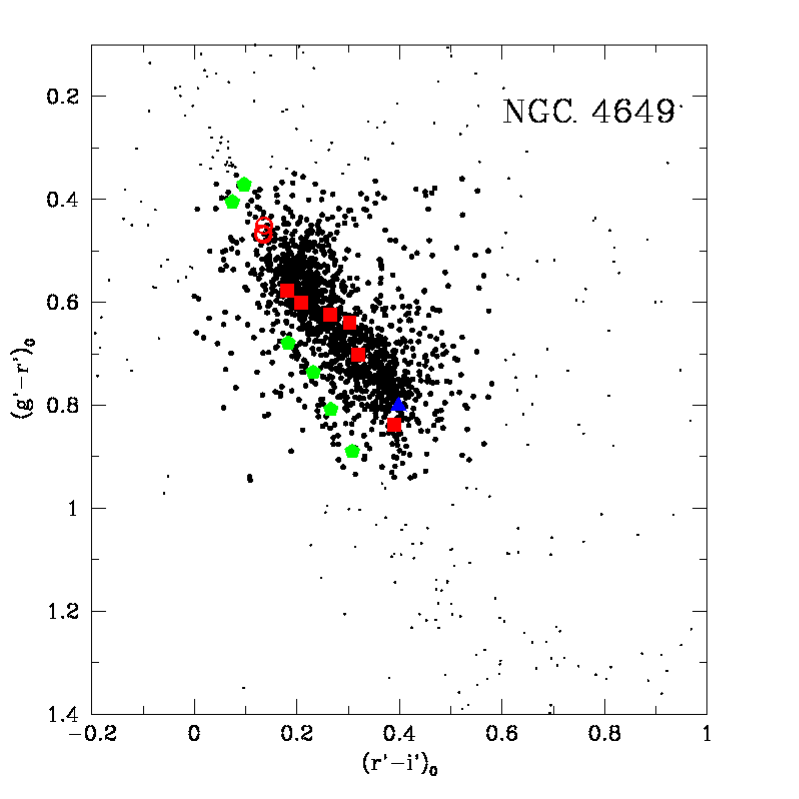
NGC 4649 This galaxy shows a well-defined GC sequence in the colour-colour diagram. The bimodality in (g′–i) is clear and detectable even in the (g′–r′) vs. (r′–i′) plane, where we can see two slightly superimposed clumps of GCs. There are bright blue and red GC candidates (MI ), so the brightest objects suggest a non unimodal colour distribution. However, the most striking characteristic in NGC 4649 is that the bluest GCs seems to become redder with increasing luminosity, i.e., they show a “blue tilt” as will be discussed later.
We have found 63 marginally resolved GC candidates (shown as blue circles), some of which were confirmed as belonging to the NGC 4649 system by Bridges et al. (2006) (see Table 8 in the Appendix). These objects have a broad color distribution but they seem to follow that of the GCs.
Regarding UCD candidates, we have found 15 unresolved objects and
one marginally resolved bright object. All of them have absolute magnitudes
MI , well in the UCD luminosity range. We have 6
type I UCD candidates (including the one marginally
resolved), 3 type II and 6 type III.
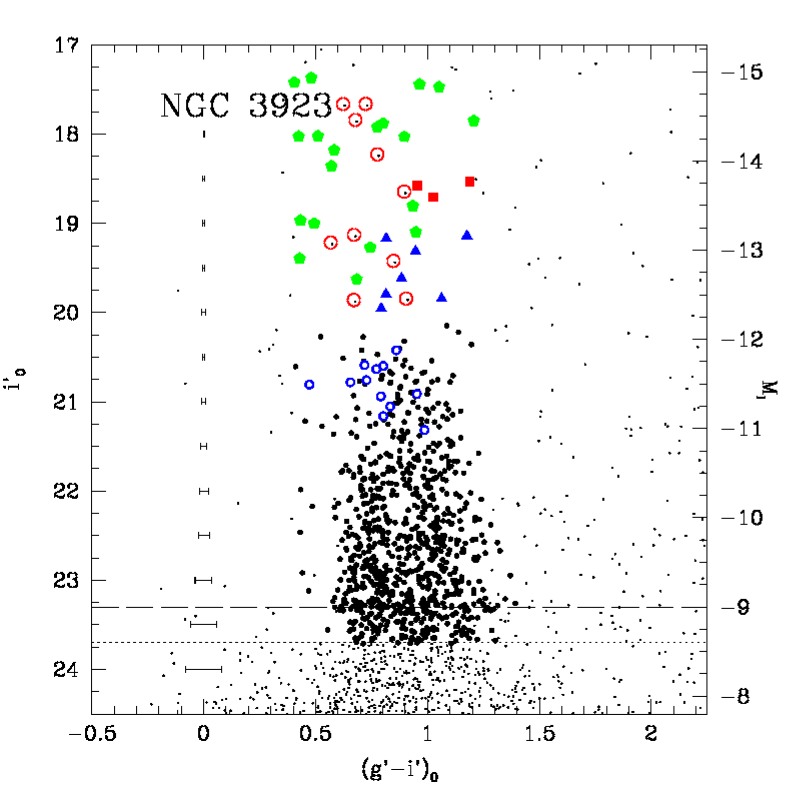
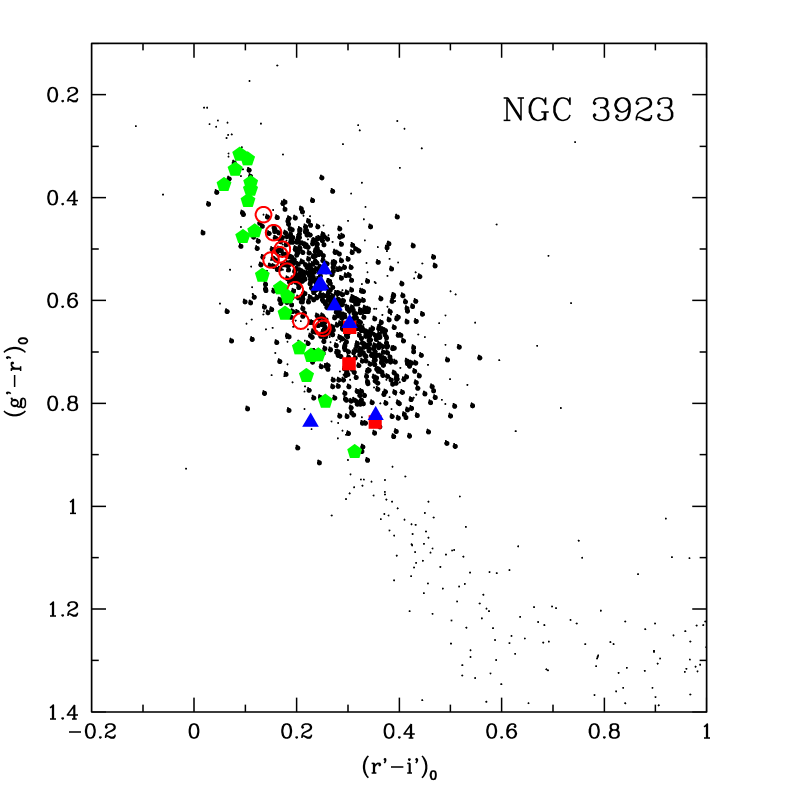
NGC 3923 The GC bimodality is easily detectable, but only for objects with MI . In contrast with NGC 4649, the brightest objects show a broad and nearly unimodal distribution. This phenomenon has previously been observed in other giant galaxies, such as NGC 1399 (Ostrov et al. 1998; Dirsch et al. 2003).
In this galaxy we find 12 marginally resolved objects, all of them with blue
colours: (g′–i′). A few of them have been confirmed by Norris et al. (2011) as members of the NGC 3923 system. In particular, object ID#285 is a clearly
extended object. We have also found 32 unresolved
objects with MI , (3 type I and 10 type II). The remaining 19
type III UCD candidates are very probably MW stars. One of our type I
candidates, ID#336, was spectroscopically confirmed by Norris & Kannappan (2011)
as a real UCD (UCD1 in their Table 3). Regarding marginally resolved
UCD candidates, we have found 7, a relatively large number. Two of them,
ID#760 and ID#1030, were confirmed as members of the NGC 3923 system by
Norris et al. (2011) and ID#243 by Norris & Kannappan (2011) (UCD2 in their
Table 3).
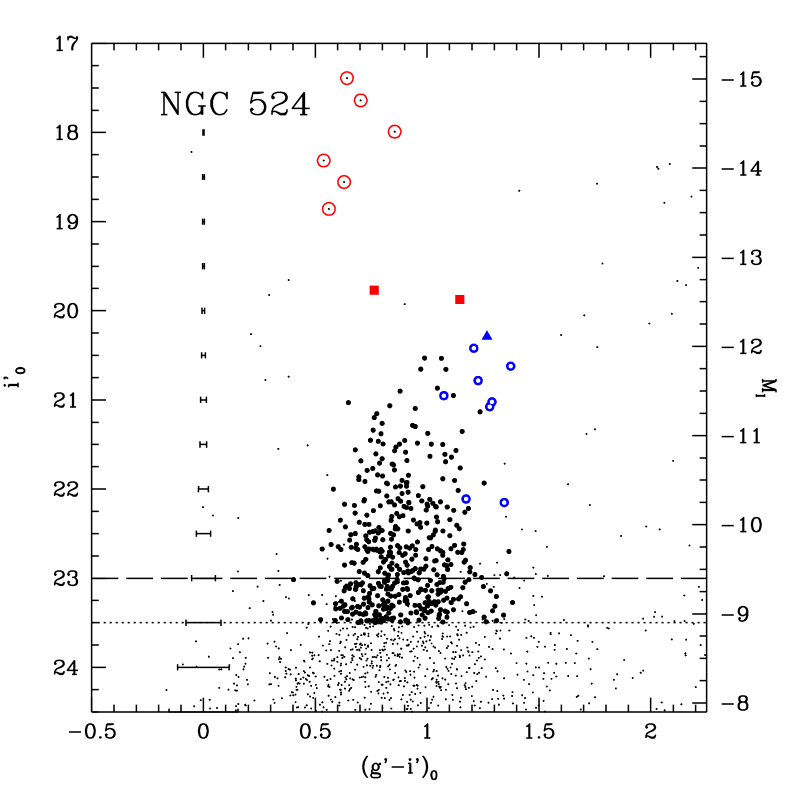
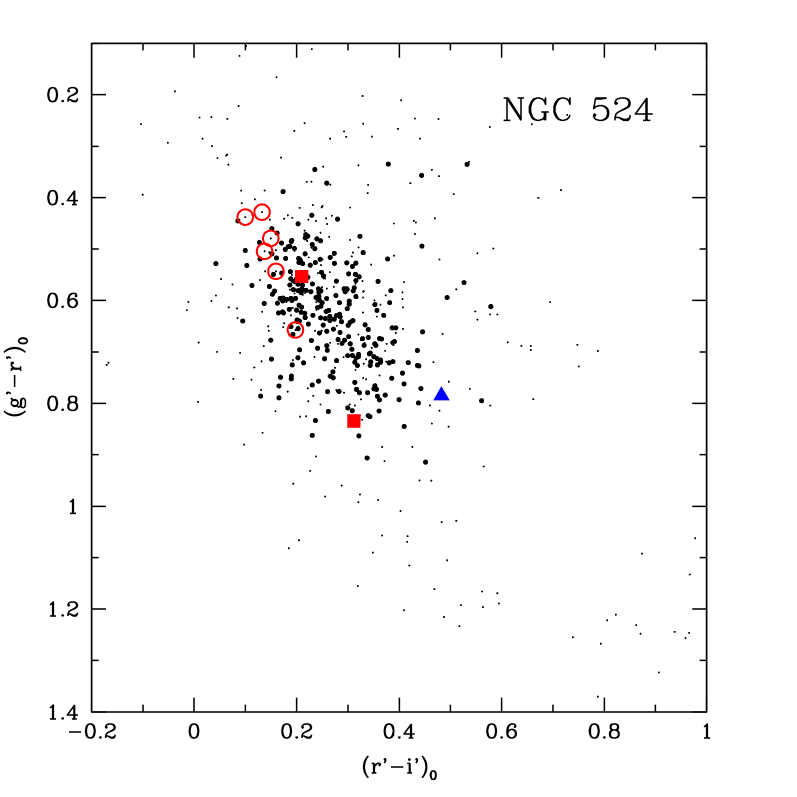
NGC 524 This galaxy shows a broad GC colour distribution without clear evidence of bimodality. This is similar to that found in some other GCSs like NGC 1427 (Forte et al. 2001). We will return to this point in Section 4.2. The GC candidates show a large spread in the (g′–r′) vs. (r′–i′) plane. We have found 8 marginally resolved objects with colours consistent with GCs. Curiously all of these objects are very red and only found in Field 1.
Regarding UCD candidates, there are 8 candidates with
luminosities MI . Two are type I and 6 type II. The
classification, however,
is tentative due to the large spread of these objects in the
colour-colour diagrams. We have also found one marginally
resolved UCD candidate. Norris & Kannappan (2011, in preparation) have
confirmed one UCD object which was not included in our sample
because it is redder than our colour cuts.
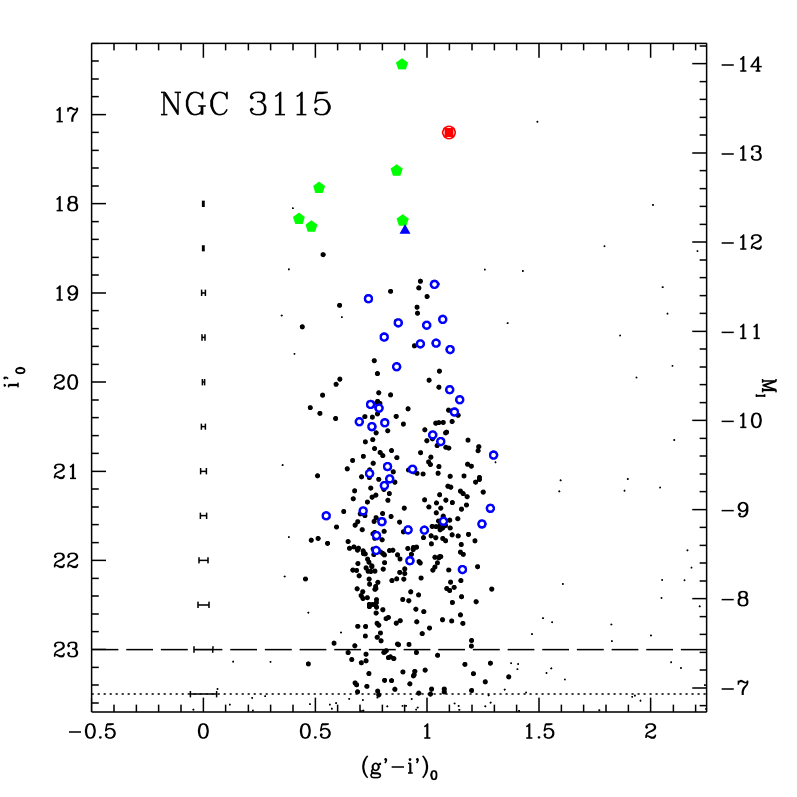
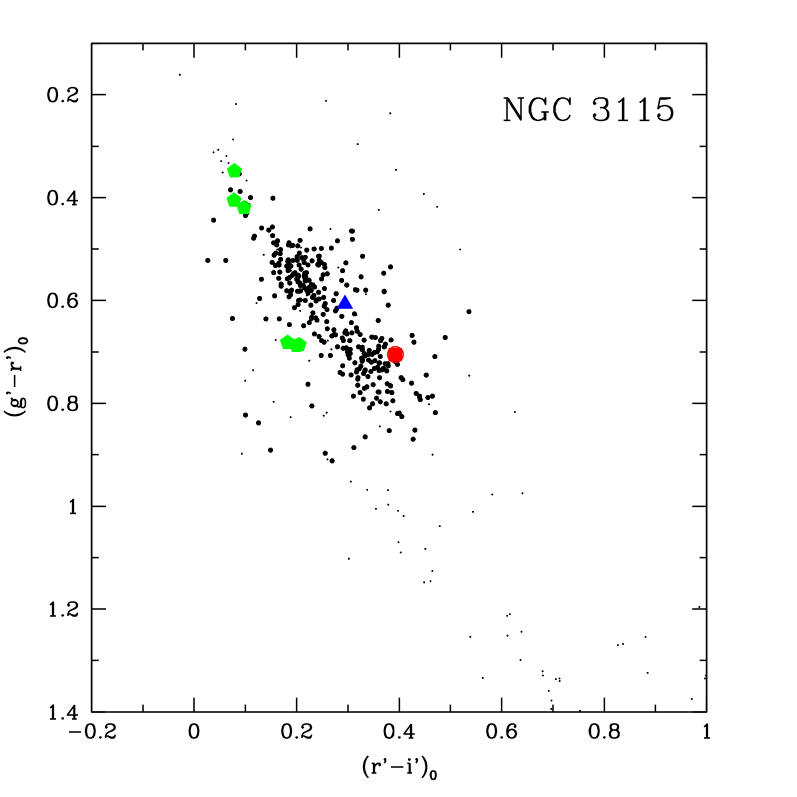
NGC 3115 This galaxy shows the most obvious bimodality in our sample except for the brightest GCs (MI). Curiously, the colour magnitude diagram shows that the red GCs do not reach the same low luminosities as the blue ones do. In turn, the colour-colour diagram defines a very thin sequence with two GC clumps (as in the case of NGC 4649).
We also find a noticeable number of resolved GC candidates. A total
of 38 objects fall in this category, and some of them
clump at MI. It is interesting to note that most of
these objects are confirmed GCs by Kuntschner et al. (2002) and
Puzia et al. (2004). There is one resolved UCD
candidate (presented as a GC in Puzia et al. 2004)
and 7 unresolved ones. One of them is type I, and the remaining are type III.
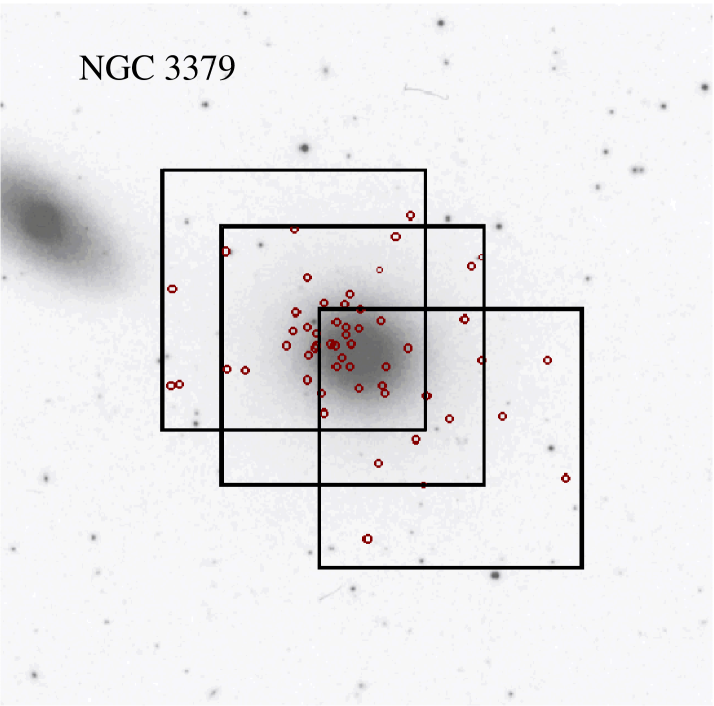
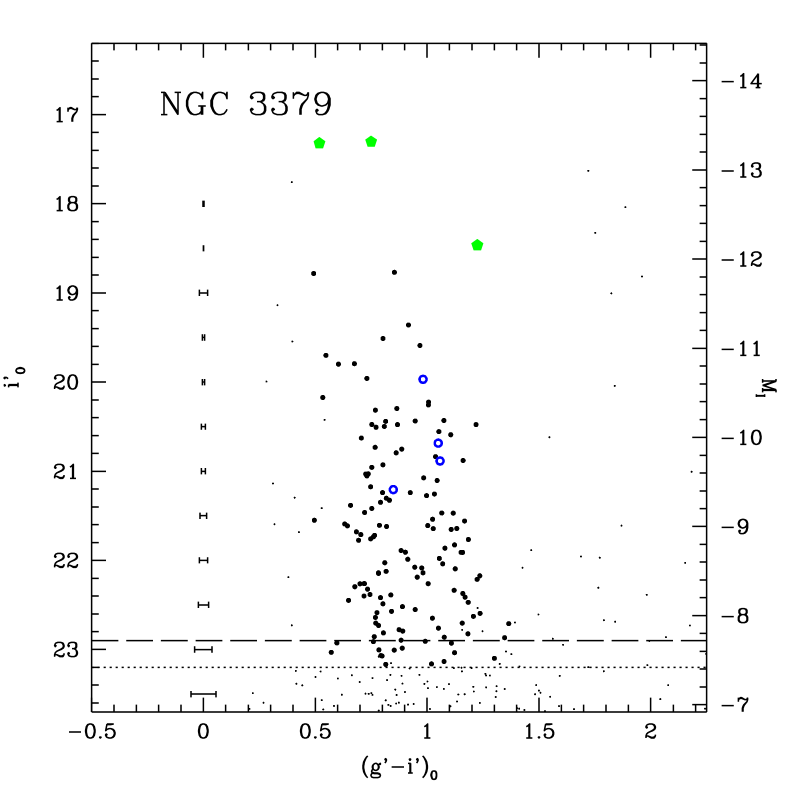
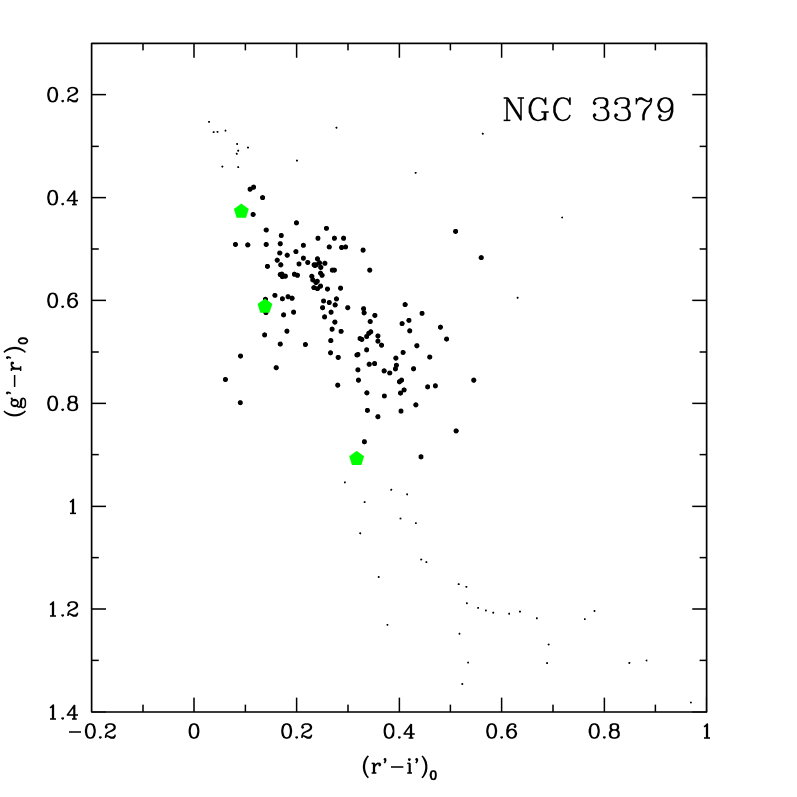
NGC 3379 This is the poorest GCS and the least massive galaxy in our sample. However, bimodality is detectable even in the (g′–r′) vs. (r′–i′) plane.
There are three marginally resolved GC candidates and three possible UCDs but all of them were classified as type III objects. One object, with MI and and (g′-i′)0 (which was spectroscopically confirmed by Pierce et al. (2006a) as a GC), lies in the transition region between bright GCs and UCDs. We do not find any resolved UCDs. Some of the other bright GC candidates are indeed confirmed as such by Bergond et al. (2006) and Puzia et al. (2004). Therefore, this low-mass system also shows a detectable population of very massive GCs.


4.2 Colour Histograms
Raw (g′–i′)0 colour distributions for all GC candidates selected as indicated in Section 4.1 are presented in the left panel of Fig. 5, ordered by decreasing BT brightness of the host galaxy. These histograms were built by counting the objects in bins of 0.06 (NGC 4649, NGC 3923, NGC 524 and NGC 3115) and 0.08 mag (NGC 3379), depending on the total number of candidates in each sample (dotted lines in Fig. 5). Additionally, a smoothed colour distribution was created by replacing each object by a Gaussian of mags (solid lines in Fig. 5). This value was considered to be representative of the mean error in (g′–i′) colours for fainter candidates. Each histogram is background-corrected, as described in the following, and the distribution of the contaminant objects are plotted as dashed lines.
For the case of NGC 4649, we adopted the WHDF as our control field. In all other cases, the average of counts in the WHDF and our Comparison Field was taken as representative of the background and subtracted.
As noted in Section 3.4, MW stars are the most important source of contamination for i , while unresolved background galaxies are the main contaminants at fainter magnitudes. However, none of the targets listed in Table 1 are at very low galactic latitudes and the expected contamination level is probably less than 10 percent (as demonstrated by our previous spectroscopic results).
The left panel of Fig. 5 shows that, except for NGC 524, all the GCSs appear bimodal. NGC 4649 and NGC 3115 show very well defined blue and red peaks of (g′–i′) and (g′–i′). NGC 3923 appears bimodal, but the separation between peaks is less clear. NGC 3379 shows a marked blue peak around (g′–i′), and a less conspicuous red population.
As noted before, NGC 524 is the only target where no clear bimodality is seen. However, its colour distribution looks rather broad and further high quality photometry will be required to clarify the situation.
As shown in Fig. 1, the areal coverages are different in each observed GCS. As a consequence of this, we have attempted to recover the global colour distribution of the entire GCS by correcting for areal incompleteness. In order to do this, we split each GCS into different galactocentric radial bins. As seen in Section 3.3, the inner regions always have lower photometric completeness. We therefore exclude the zones within R arcsecs. The outer zones have very small areal completeness (and hence introduce noise), so the points with R were excluded too. Here was taken as the Rgal which shows areal completeness smaller than (in Table 4 we listed the values of for each GCS). After that, we calculated the fraction of each ring “effectively” observed. And then, the inverse of these fractions were used as a correction factor. The number of radial bins was three in the two most massive galaxies (NGC 3923 and NGC 4649), and two in the other less populated ones (NGC 3115, NGC 3379 and NGC 524). Finally, the total colour distribution was obtained by adding the colour distributions of each individual radial bin.
In the right panel of Fig. 5 we show the resulting background corrected histograms and smoothed colours distributions. The areal corrections lead to more prominent blue GCs populations. This results from the fact that blue GCs are less concentrated towards the center of the host galaxy than the red ones.
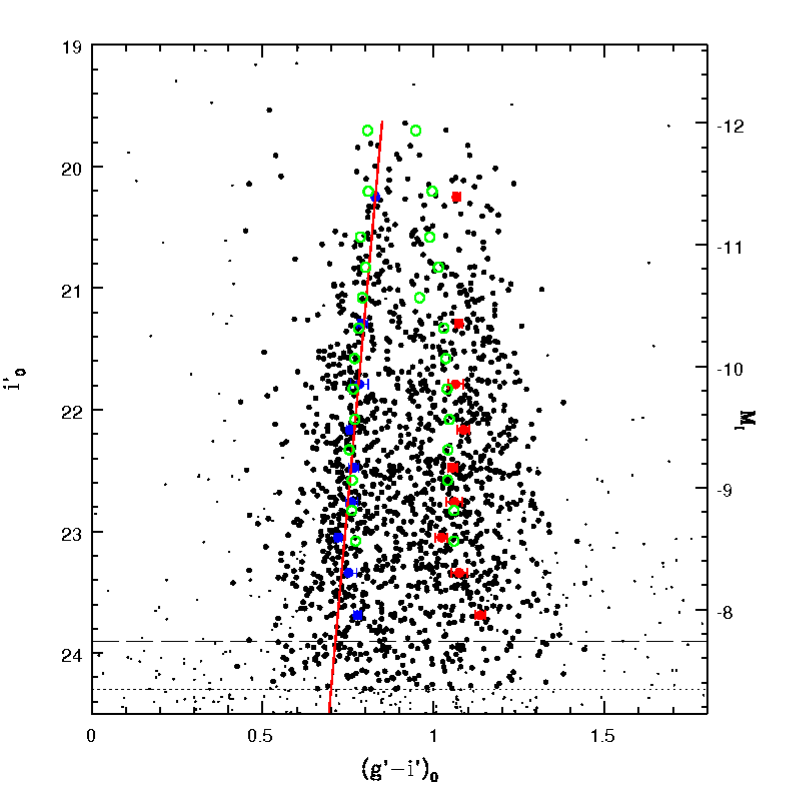
In the case of NGC 3923, the colour-magnitude diagram shows a unimodal colour distribution for the brightest GCs. Then we have split the sample in GCs having MI (long dashed line in Fig. 5) and MI (the same codes as the other GCSs). Doing that, we see that the bright GC candidates are not bimodal. For NGC 3115 and NGC 3379, the small number of bright GCs prevents a similar analysis.


In order to characterize the presence of bimodality in the integrated GC colours, we have run RMIX on our histograms (MacDonald 2007). This program allows the user to choose the kind of distribution, number of components, and constraints. In this work we adopted two normal components, allowing RMIX to fit the position of the peak, the standard deviation and the number of GC candidates in each populations. Using reasonable starting values, in all cases RMIX converged easily, so we did not constrain any parameter. The results are shown in Table 4. As a comparison we list the modal values for all the GCSs showing two clear peaks in their colour distribution. In the case of NGC 4649, we list two values for each parameter. The first set of values are obtained using the whole sample, and the second one taking GC candidates with 21.5 i 23.9. In this last sample both peaks are bluer. In particular the blue peak moves 0.025 mag as a consequence of the “blue tilt” phenomenon.
In the case of NGC 524 we specifically tested different kinds of fits. We found that a double Gaussian distributions fit was strongly preferred over only one leading to a value 2.7 times smaller. This supports the conclusion that NGC 524 is also a bimodal system. However, the blue peak in this galaxy ((g′–i′)) is the reddest one in our sample. Deeper photometry could help to obtain a more conclusive result for this galaxy.
Fig. 6 shows the positions of the GC colour peaks for the different cluster populations as listed in Table 4 versus the galaxy MB. Blue and red peaks are depicted as filled triangles and squares, respectively. One of the most striking characteristics of this figure is that the red peak of NGC 3923 seems to be too blue according to its absolute magnitude. To complement this, we have included the values corresponding to NGC 3311 as open and filled circles (Wehner et al. 2008). The following (error weighted) linear fits were obtained for the red (eq. 4) and blue GCs peaks (eq. 4):
| (4) |
| (5) |
These fits are shown as solid lines in Fig. 6 where we also include the peaks corresponding to M87 from Harris (2009a) for comparison (open and filled stars). The M87 points are very consistent with our relations. However, it is important to note that Harris (2009a) calibrated his M87 photometry with SDSS stars. As a result, some mismatch may be expected.
Peng et al. (2006) found that the slopes of vs. MB relations were, -0.036 and -0.026 for red and blue peaks, respectively. Using some common objects between Jordán et al. (2009), and our NGC 4649 photometry, we have found that . With this value, the slopes from Peng et al., translate to -0.026 and -0.019. Comparing with Equations (4) and (5), we see that the red values are in very good agreement. However, our results for the blue peaks are consistent with no correlation.
We note that Peng et al. (2006) obtain [Fe/H] for the red GCs which is identical to our value after adopting the colour-metallicity relation given in the next section.

| Modal values | RMIX | rmax | fT | ||||||
|---|---|---|---|---|---|---|---|---|---|
| Galaxy | fb | arcsec | |||||||
| NGC 4649 | 0.765 | 1.095 | 0.783 0.006 | 0.098 0.004 | 1.080 0.008 | 0.110 0.004 | 0.518 0.024 | 490 | 0.41 |
| 0.758 0.007 | 0.096 0.004 | 1.067 0.008 | 0.127 0.004 | 0.442 0.025 | ” | ” | |||
| NGC 3923 | 0.758 | 1.011 | 0.746 0.011 | 0.072 0.008 | 1.005 0.023 | 0.135 0.014 | 0.365 0.069 | 350 | 0.58 |
| NGC 524 | - | - | 0.815 0.021 | 0.086 0.011 | 1.033 0.040 | 0.076 0.021 | 0.713 0.120 | 315 | 0.70 |
| NGC 3115 | 0.764 | 1.053 | 0.765 0.007 | 0.067 0.005 | 1.044 0.011 | 0.092 0.008 | 0.521 0.037 | 320 | 0.58 |
| NGC 3379 | 0.769 | - | 0.765 0.009 | 0.036 0.008 | 1.010 0.029 | 0.135 0.018 | 0.408 0.082 | 290 | 0.72 |
4.3 Blue tilt
As noted in Section 4.1, NGC 4649 is the only galaxy in the sample where the blue GCs show a clear colour-magnitude trend, a feature called the “blue tilt”, and noticed by Strader et al. (2006) and Harris et al. (2006). In contrast, all the other galaxies discussed in this paper show two broad color sequences, without an obvious tilt (for a further study of the NGC 3923, see Norris & Kannappan 2011). The GC colour distributions in these galaxies become unimodal at bright magnitudes, a situation different from that in NGC 4649, where blue and red clusters are clearly separated even at higher luminosities.
In particular for NGC 4649, Strader et al. (2006) find a colour trend identical, within the errors, to derived by Mieske et al. (2006b) by combining the colour magnitude diagrams of M49, M60 and M87.
In order to characterize the “blue tilt” in NGC 4649, using our GMOS photometry, we followed an approach similar to that described by Wehner et al. (2008). GCs were grouped in magnitude bins containing 150 clusters each and, using RMIX, we obtained the positions of the blue and read peaks. This procedure delivered nine pairs of values depicted as blue and red dots in Fig. 7. In all the cases previously studied, the “blue tilt” appears to have a similar behaviour. Fig. 7 shows that the blue sequence seems to become redder at a magnitude around M mag. In turn, and using a combined sample for six giant elliptical galaxies, Harris (2009b) found evidence that the “blue tilt” starts to be detectable at absolute magnitudes brighter than M mag and exhibits a nonlinear form. However, in our NGC 4649 sample, the three faintest points of the blue and red peaks (see Fig. 7) were not well constrained by RMIX as they have significant colour errors. So, these points were not included and only those with i′ were used to perform linear fits to the blue and red GCs groups:
| (6) |
| (7) |
These fits indicate that the red GCs do not show a significant trend, as noted for other galaxies (Harris 2009a, b; Peng et al. 2008; Harris et al. 2010).
We stress that a second order fit, like that performed by Harris (2009b), on our data, produces very unstable solutions. However, we cannot rule out that the inclusion of a better sample of faint objects may require a higher order fit.
As a comparison Fig. 7 also includes the position of the blue and red peaks obtained by Harris (2009a) for the M87 GCS also using g and i photometry. Both galaxies exhibit remarkably similar blue tilts.
The fact that the tilt is detectable in some but not all galaxies is an issue that still deserves clarification. A tentative interpretation was presented in Forte et al. (2007) who showed that a large spread of the characteristic metallicity scale of the blue GCs smears the colour-magnitude relation in such a way that the tilt becomes eventually undetectable. In the specific case of the galaxies in our sample, the situation is not so clear. Although the colour magnitude diagrams for NGC 3379, NGC 3115 and NGC 524 in Fig. 4 show the presence of very massive GCs (those with mag) their numbers are quite small thereby preventing a meaningful detection of the blue tilt.
It is worth mentioning that Harris et al. (2010) found a well defined tilt in the blue GC sequence in M 104, using a sample with several hundred GCs. In contrast, NGC 3923 with a comparable number of clusters (), exhibits no detectable tilt, suggesting that the size of the statistical sample cannot be the main reason for the absence of the tilt. We note, however, that our GCs sample does not include a significant number of clusters brighter than , which conspires against the eventual detection of the tilt. Rather, our colour magnitude diagram suggests a ”unimodal” distribution for these bright clusters (but see Norris and Kannappan 2011). Another question that deserves a more complete wide field analysis is why NGC 3923 seems to have a relatively sparse population of massive blue GCs.
We note that the “blue tilt” has been identified as a possible instrumental artifact specifically affecting the HST-ACS photometry (Kundu 2008) and even dismissed on the basis of (V-I) photometry of M87 (Waters et al. 2009). However, the observations presented in this paper together with other ground based works (see also Forte et al. 2007, Wehner et al. 2008, Harris 2009a), and new HST/ACS based analyses (Peng et al. 2008; Harris 2009b), strongly argue in favour of the existence of the blue tilt.
Previous works have presented an interpretation of the “blue tilt” as the result of increasing metallicity with GC mass, i.e., a mass-metallicity relation (MMR). Bailin & Harris (2009) and Strader & Smith (2008) give models where the physical interpretation of the MMR is based on self-enrichment during a cluster’s formation stage. According to these models, GCs with masses above will hold onto enough of their SN ejecta to enrich the gas from which stars are still being formed. A meaningful comparison of the results from different GCS is somewhat precluded by the adoption of different colour-metallicity relations. The photometry presented in this paper, combined with our previous spectroscopic results (Pierce et al. 2006a, Pierce et al. 2006b and Norris et al. 2008) allows the determination of a new relation that includes 67 globulars in three different galaxies (NGC 3923, 3379, 4649). Chemical abundances [Z/H] obtained via Lick indices, are on the scale defined by the synthetic models by Thomas et al. (2004) and clusters fainter than g=23 were rejected due to their relatively large associated errors.
The [Z/H] vs. (g′-i′)0 values for the calibrating GCs are plotted in Fig. 8 where a linear fit:
| (8) |
is also shown. The overall trend is in agreement with a rediscussion of the (C-T1)0 vs [Fe/H] relation presented in Forte et al. (2007) and with other works where more complex functions were fitted (for example, Peng et al. 2006, Lee et al. 2008 and Blakeslee et al. 2010). However, it is worth emphasizing that all these last calibrations include higher order colour terms, mostly set by low metallicity MW globulars, whose counterparts are scarce in Fig. 8. A more direct comparison is possible using the recently published relation obtained by Sinnott et al. (2010). Those authors have used integrated colours in the USNO photometric system (Smith et al. 2002) and spectroscopically measured abundances of GCs from NGC 5128 and the MW. Their linear (g′-i′)0 vs [Fe/H] relation can be easily translated to the form of Equation (8) using the [Fe/H]=[Z/H]-0.131 relation from Mendel et al. (2007), leading to [Z/H], which compares very well with our results.
The adoption of a constant (M/L) ratio for the blue clusters, and the above calibration, leads to
| (9) |
in agreement with Mieske et al. 2006b who, in the particular case of NGC 4649, derive an exponent of .
Our colour-abundance relation was also applied to the g′ and i′ photometry presented by Cockcroft et al. (2009) for NGC 5193, IC 4329 and NGC 3311, leading to exponents of , , and respectively. These values are, in the average, 30 percent smaller than the exponents obtained by Cockcroft et al. These differences are typical of the uncertainties connected with the adoption of different metallicity scales.

4.4 Spatial distributions
Fig. 1 shows some already known systematics regarding the spatial distribution of both GC families, i.e., blue clusters usually exhibit relatively shallow distributions in contrast with those of the red ones, which are frequently more concentrated toward the galaxy centers.
In this section we aim to quantify the spatial distributions through an analysis of the projected cluster density as a function of galactocentric distance using both a de Vaucouleurs law (r1/4) and a power law. We also present Sérsic law fits in the case of the two brightest galaxies for which we have a good areal coverage.
Blue and red GCs were separated according to a common “colour valley” at (g′-i′) and the limiting i magnitude was set at the 90 percent completeness level. Due to their relatively low flattenings, we used circular annuli with log r = 0.1 to 0.15 for all galaxies except NGC 3115, for which we adopted an ellipticity of 0.55.


The resulting areal density distributions are displayed in Fig. 9, and the fit parameters listed in Table 5. As a general comment, we point out that both the de Vaucouleurs and the power law give very similar results in terms of the residual errors, although the former yields marginally better fits in the innermost regions.
In the cases of NGC 4649 and NGC 3923, our observations were combined with the HST-ACS data allowing a fit to the innermost regions. The GC candidates from Jordán et al. (2009) were used for NGC 4649, and in NGC 3923 the clusters were selected from our own analysis of the same ACS archive images used by Sikkema et al. (2006). The ACS and GMOS profiles were matched by normalizing the counts in common selected radial annuli.
For these galaxies, Sérsic law fits in the form are also shown in Fig. 9. The respective , and values are: , , for NGC 4649, and , , for NGC 3923.
A core-like distribution is detected in the case of NGC 4649, similar to that found, for example, in M87 by Lauer & Kormendy (1986) and Kundu et al. (1999). In turn, the Sérsic law seems compatible with a De Vacoucoleurs fit along the whole galactocentric range in NGC 3923.
In what follows we give some brief comments about the characteristics of each galaxy.
NGC 4649. Our density profile improves that already presented in Forbes et al. (2004) due to a better determination of the level of the subtracted background. The slope values given in Table 5, in turn, are in excellent agreement with those presented by Lee et al. (2008).
NGC 3923. Both Fig. 1 and Fig. 9 show that the blue globulars have a very shallow distribution. In fact, the slope of the density profile for these clusters is the lowest in our sample. Sikkema et al. (2006) also found very low values, although their photometry only includes the central region of the galaxy.
This feature deserves some attention as it may be connected with the merger history of this galaxy as suggested by the well known ripples detectable in its brightness profile (see, Malin & Carter 1980).
NGC 524. As mentioned previously, the colour histogram of the GCs in this galaxy do not show a clearly detectable bimodality and, for this reason, the density profile displayed in Fig. 9 corresponds to the whole cluster population. The derived value is consistent with Harris & Hanes (1985).
We note, however, that an inspection of the innermost region in this galaxy, indicates that the red GCs seem very concentrated (a situation that resembles the case of NGC 1427, Forte et al. 2001). However, splitting the sample at as shown by Fig. 1, the “reddest” GCs exhibit a clump inside arcmin. In contrast, this feature is absent in the “blue” clusters.
NGC 3115. This galaxy exhibits a high flattening and its GCs seem to follow the brightness isophotal contours. However, our uneven spatial coverage does not allow a quantitative confirmation (e.g., via azimuthal counts).
NGC 3379. Since this galaxy shows a very low number of GC candidates, the density profile displayed in Fig. 9 corresponds to the whole GC population. The resulting slope is steeper than that given by Rhode & Zepf (2004) who found -1.4 in their wide field study. This may indicate a difference in the background level adopted in these two studies.
Fig. 1 shows that the blue and red candidates in this galaxy are not homogeneously distributed around the center. The red GCs show a clump to the NE, while the blue ones are clearly less numerous in that region. This inhomogeneous distribution is also seen in Whitlock, Forbes & Beasley (2003) (their Fig. 3).
| Galaxy | all | red | blue | |||
|---|---|---|---|---|---|---|
| power law | de Vaucouleurs | power law | de Vaucouleurs | power law | de Vaucouleurs | |
| NGC 4649 | -1.37 0.04 | -0.67 0.02 | -1.52 0.04 | -0.73 0.02 | -1.21 0.08 | -0.58 0.03 |
| NGC 3923 | -1.25 0.07 | -0.64 0.03 | -1.45 0.09 | -0.73 0.04 | -0.86 0.08 | -0.44 0.05 |
| NGC 524 | -1.67 0.06 | -0.89 0.05 | - | - | - | - |
| NGC 3115 | -1.59 0.13 | -0.78 0.07 | -1.74 0.17 | -1.08 0.10 | -1.45 0.15 | - 0.73 0.07 |
| NGC 3115(ellip) | -1.97 0.12 | -1.02 0.05 | -2.45 0.11 | -1.28 0.08 | -1.62 0.05 | -0.81 0.04 |
| NGC 3379 | -1.81 0.16 | -0.98 0.08 | - | - | - | - |
4.5 Galactocentric colour trends
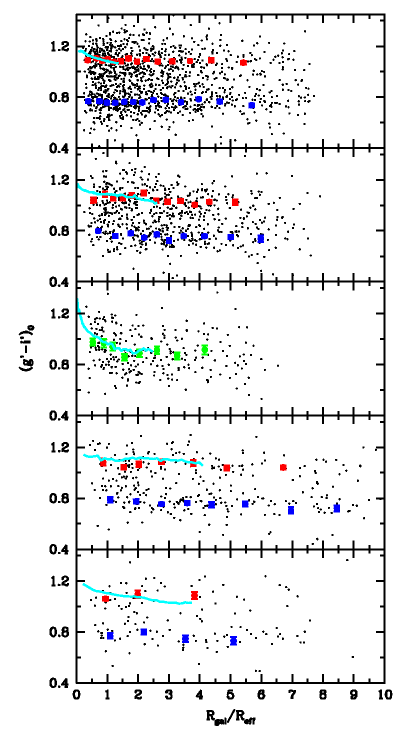
Fig. 10 shows the (g′-i′)0 colours of all the globular cluster candidates brighter than the 90 percent completeness level as a function of the normalized galactocentric radius Rgal/Reff, where Reff is the effective radius in the B band taken from RC3 data in NED.
Mean colours for each GC family were obtained within galactocentric bins of variable size (containing the same number of clusters) and fit with a logarithmic law
| (10) |
The a and b parameters are listed in Table 6, along with the associated uncertainties obtained through a least square fit, for each GC subpopulation except for NGC 3379 where, due to the low number of clusters, blue and red GCs were grouped together. The listed colour gradients were combined with Equation 8 to obtain values of and were included in Table 6.
The overall appearance of the Fig. 10 suggests very mild gradients over a galactocentric range larger than 1 to 2 Reff. A similar trend has been noted by Harris (2009a, b) in M87 and six other GCS belonging to giant elliptical galaxies. Beyond this, each galaxy has its own and distinct behavior. In particular, NGC 524 and NGC 3115 (both S0 galaxies) exhibit the highest colour gradients in their innermost regions (Tortora et al. 2010).
Fig. 10 also includes the (g′-i′)0 halo colours derived from our images. They were obtained within the central 2 arcmin of the galaxies because this zone is not strongly affected by the sky level adopted. These colours are remarkably similar to the mean colours of the red GCs, a similarity already noted in the inner regions of several galaxies (see, for example, Forbes & Forte 2001).
| Galaxy | slopes (g′-i′)0 | slopes [Z/H] | Nbin | ||
|---|---|---|---|---|---|
| red | blue | red | blue | ||
| NGC 4649 | -0.0150.007 | -0.0010.011 | -0.052 0.024 | -0.004 0.038 | 50 |
| -0.0210.009 | 0.0040.015 | -0.073 0.032 | 0.014 0.052 | 50 | |
| NGC 3923 | -0.0500.024 | -0.0510.019 | -0.175 0.084 | -0.179 0.067 | 30 |
| -0.0950.024 | -0.0330.025 | -0.333 0.086 | -0.115 0.088 | 30 | |
| NGC 524 | -0.0990.043 / -0.194 0.069 | -0.347 0.152/ -0.681 0.245 | 30 | ||
| NGC 3115 | -0.030 0.028 | -0.0760.016 | -0.1050.098 | -0.266 0.058 | 20 |
| -0.022 0.037 | -0.0810.024 | -0.0770.130 | -0.284 0.085 | 20 | |
| NGC 3379 | - | -0.066 0.055 | - | -0.232 0.193 | 15 |
Our data adds to the increasing evidence in the literature for colour, and hence metallicity, gradients in the individual GC subpopulations (e.g. Harris 2009b; Forbes et al. 2011). Such gradients are indicative of a dissipative formation process for both GC subpopulations. In a detailed study of the NGC 1407 GC system, Forbes et al. (2011) suggested that a transition occurred between the inner region with strong GC gradients and an outer region with no colour gradient. This was interpreted as support for the two phase formation model of early-type galaxies (Oser et al. 2010) in which such galaxies are built up from a dissipative core that experiences later accretion. Our data show shallower gradients and fewer GCs than detected in NGC 1407 by Forbes et al. Further data on a rich GC system like NGC 4649 would be needed to search for such a transition.
The GC colour gradients are also compared to the colour gradient of the underlying starlight in the galaxy. In each case where the GC system can be clearly separated into two subpopulations we find that the galaxy gradient matches the red GC subpopulation gradient in both absolute colour and in slope over a common radial range. This provides strong support for the idea that the red GCs are associated with the bulge/spheroid stars of early-type galaxies, and hence may have shared a common formation epoch (Forbes & Forte 2001; Forte et al. 2009; Spitler et al. 2010).
4.6 GC Integrated Luminosity Functions and GC Specific Frequencies SN
4.6.1 Integrated luminosity functions


In this section we aim to determine the integrated GC luminosity function (GCLF) for each galaxy. Fig. 11 shows the raw and completeness corrected counts of cluster candidates as well as those of the adopted comparison field as a function of i magnitude. NGC 4649 and NGC 3115 exhibit a good contrast at the expected TOM magnitude between clusters and contaminant objects allowing this kind of analysis. In NGC 3923, we don’t have such a good contrast. However, the completeness and the background counts are good enough to try to recover some useful information. In NGC 3379 the low number of candidates, and the strong dependence of the background adopted make it difficult to obtain reliable results and the parameters of the GCLF are not very well constrained. For that reason the points with i 23.2 were rejected from the fit. In the case of NGC 524, we expect to have the TOM at , where our photometry has a very low photometric completeness and therefore this galaxy was not included in what follows.
The resulting GCLF, determined on the basis of the net counts within 0.25 mag bins, are displayed in Fig. 12 together with the normalized counts of the subtracted background.


Both a Gaussian and a t5 function fit were performed on each histogram in order to determine the position of the turn-over magnitude (TOM) and the dispersion parameter. As the results do not show clear differences between both approaches, we only give the parameters of the Gaussian fit in Table 7.
Reliable estimates of the TOMs in NGC 4649 and NGC 3115 are derived since our adopted limiting magnitude is fainter than the TOMs by approximately one magnitude.
For these galaxies we also obtained the TOMs of the blue and red GC populations defined in terms of the (g′-i′)0 “valley” in the colour statistics. The corresponding corrected luminosity functions for each GCs subpopulation are shown in Fig. 13. A comparison shows that, in NGC 4649, the blue and red TOMs are coincident within the errors. This agreement is expected as the i magnitudes are not strongly affected by metallicity effects (see Ashman et al. 1995). The situation is not clear in NGC 3115 where the blue TOM seems fainter than the red one, contrary to the expectations for two coeval GC populations with different metallicities. An inspection of Fig. 1 shows that our areal coverage of the central region of this galaxy is rather poor, resulting in the loss of a fraction of the red GCs population (because red GCs are more concentrated towards the center of the galaxy than the blue one) and possibly producing an spurious effect on the magnitude statistics of these clusters.
For NGC 3923, and as the TOM seems very close to the magnitude cut off (at a 50 percent completeness level), we only derive the dispersion. In this case we adopted the I band TOM given by Kundu & Whitmore (2001) which, at the adopted distance modulus becomes i=.
The adoption of the absolute TOM magnitudes given by Kundu & Whitmore (2001), and using the relation given in Equation 1, lead to distance moduli (m-M)I= and (m-M)I= for NGC 4649, NGC 3115 respectively.
A comparison with Larsen et al. (2001), Kundu & Whitmore (1998) and Kundu & Whitmore (2001) (previous correction by the TOM for the MW GCs and the MV adopted by these authors) shows an excellent agreement between their distance moduli and ours.


4.6.2 Specific frequency and total GC population
Adopting Gaussian integrated luminosity functions defined by the parameters given in Table 7 in combination with the projected areal density profiles previously discussed, we derive the cumulative specific globular frequency for each galaxy within maximum galactocentric radii of 50 and 100 kpc. The first radius seems a reasonable value in order to include most (if not all) the CGs associated with a given low mass galaxy. The largest radius seem more appropriate for massive galaxies that have very extended GCS (see, for example, Bassino et al. 2006, Harris 2009a).
In order to estimate for NGC 4649 and NGC 3923, we have integrated the de Vaucouleurs law profiles obtained by fitting the GMOS+ACS profile presented in Fig. 9. In the particular case of NGC 3115, we have integrated our de Vaucouleurs GMOS profile and we adopted the WFPC2 photometry given by Larsen et al. 2001 to complete the counts in the innermost regions of the galaxy not covered by our frames. As those density profiles were obtained considering samples with 90 percent completeness magnitude cuts, these three values were corrected by calculating the fraction of the GCLF not included beyond these magnitude limits.
Absolute galaxy luminosities were obtained using the photometric values given in the NED database and the distance moduli listed in Table 1. The total number of GCs, galaxy visual luminosity and inferred values are included in Table 7. As an indicative of the uncertainty in our estimation of and , we list as error the difference between the results obtained by integrating a de Vaucouleurs and power law profiles.
For NGC 4649, there are two previously published values of in the literature. Both of them were calculated for 50 Kpc and they are from Lee et al. (2008), , and that from Forbes et al. 2004, . A comparison with the numbers listed in Table 7 shows that our new value is very good agreement with those values.
For NGC 3923 Sikkema et al. 2006 have obtained and , for the same two radial limits listed in Table 7. However, these authors have used different distance and MV for this target. Taking this into account, we have corrected their values and obtained and , somewhat lower than those listed in Table 7.
For NGC 3115, the only previous estimation of the cumulative specific frequency is that from Harris & Harris (2011), , which is very similar to our results for his galaxy.
Rhode & Zepf (2004) and Harris & Harris (2011) determine a value of for NGC 3379, in good agreement with our result.
| Galaxy | TOM | TOMred | TOMblue | MV | Nt50 | Nt100 | |||||
|---|---|---|---|---|---|---|---|---|---|---|---|
| NGC 4649 | 22.95 0.05 | 1.35 0.05 | 22.92 0.07 | 1.28 0.09 | 22.96 0.07 | 1.28 0.09 | -22.44 | 3310130 | 3.50.1 | 4690980 | 5.0 1 |
| NGC 3923 | 23.84 (fixed) | 1.42 0.05 | … | … | … | … | -22.03 | 301970 | 4.10.1 | 4580820 | 6.31.1 |
| NGC 3115 | 21.78 0.08 | 0.91 0.07 | 21.59 0.07 | 0.71 0.05 | 22.93 0.15 | 1.04 0.12 | -21.13 | 54680 | 1.9 0.2 | 571190 | 2.00.7 |
| NGC 3379 | 22.46 0.37 | 0.85 0.23 | … | … | … | … | -20.88 | 21642 | 0.9 0.2 | 226100 | 1.00.4 |
5 Conclusions
Deep GMOS multi-colour photometry has been obtained for the GCS of five early type galaxies. The primary results of this study, that will be combined with the spectroscopic results for a further discussion in a following paper, are:
-
•
All the studied GCS show bimodal integrated colour-distributions. Even the less clear case, NGC 524, appears bimodal when analyzed with the RMIX software. The adoption of a mass to luminosity ratio = 8 indicates a minimum stellar mass close to for our galaxy sample, i.e., all these systems are above the minimum mass where bimodality becomes detectable as a common feature (Peng et al. 2006).
-
•
The mean colour of the peaks of red GCs follow a well defined luminosity-colour relation in the sense that these peaks become redder with increasing galaxy luminosity. This is indicative of a larger GCs chemical abundance scale for the most luminous galaxies which, being more massive, are also able of a more efficient enrichment. We note that the most massive system in this work (NGC 4649) lies outside the plane defined by GC systems in the logarithmic 3-D space determined by galaxy stellar mass, projected stellar mass density and GCs formation efficiency, possibly indicating a merger past history as suggested by Forte et al. (2009). The GC blue peaks, in turn, show no significant correlation or, possibly, only a very mild one, with galaxy luminosity a situation already noted in the literature (Peng et al. 2006).
-
•
An empirical (g′-i′) vs [Z/H] relation was obtained based solely on GMOS data. A linear fit yields: , which provides a good approximation, although the eventual presence of a second order term at the low metallicity end will require the inclusion of more GCs.
-
•
A comparison of the colour spreads of both blue and red GCs, once transformed to metallicity, clearly indicates that both populations are widely different in terms of chemical abundance, a fact that when associated with the different spatial distributions of these subpopulations, strongly indicates a distinct nature for the two populations.
-
•
A number of resolved/marginally resolved GC candidates were detected in all five galaxies. Some of them are spectroscopically confirmed as GCs in the literature. In principle the GCs upper mass shows a dependence with galaxy luminosity (e.g. Villegas et al. 2010) and then the detection of resolved clusters could be a more frequent situation in these systems. However, further analysis will require the inclusion of distance effects.
-
•
A population of Ultra Compact Dwarf (UCD) candidates (resolved and unresolved ones with –15 MI –12 ) were also detected in all the galaxies. NGC 3923 shows the highest number of associated objects, followed by NGC4649 and NGC 3115. This result indicates that UCDs are indeed a common feature although the small size of our sample does not allow a definite conclusion in statistical terms.
-
•
This paper reports the first detection of the so called “blue tilt” in NGC 4649 using ground based observations. As a first approach we adopted a linear relation between GC colours and magnitudes although, as shown by Harris (2009b) on the basis of a more numerous GCs sample, the tilt may exhibit some degree of curvature that becomes more evident for the brightest clusters. The tilt translates into an approximate mass-metallicity relation, given by Z . This result is in excellent agreement withe the mean trend obtained by Cockcroft et al. (2009).
-
•
All the GCS density profiles are reasonably well fitted by a power law, although, in the case of NGC 4649, an R1/4 dependence produces a better fit in terms of the residuals. As found in other galaxies, the red GCs show a more concentrated spatial distribution than the blue ones, again lending support to the idea that bimodality is a real and distinctive feature and not a mere result of a particular colour-metallicity relation.
-
•
We confirm the very low spatial concentration of the NGC 3923 GCS found by Sikkema et al. (2006). In contrast to these authors, we find a significant difference of the areal density slopes of the red and blue GCs.
-
•
We have measured radial colour gradients for the blue and red GC subpopulations separately, and find evidence for statistically significant gradients in several galaxies out to several effective radii (tens of kpc). The steeper ones are those present in the two S0 galaxies included in the sample. These galaxies have smaller stellar masses than the brightest ellipticals in this study showing shallower gradients. This is in agreement with Tortora et al. (2010) who find a non monotonic behaviour of colour gradients with galaxy mass. A possible interpretation of this trend assumes that more massive galaxies may have experienced mergers that lead to a dilution of the chemical gradients.
-
•
Like in other studied systems, the red GC subpopulation has similar colours to the galaxy halo stars in their inner region. This is consistent with the idea that most of the galaxy luminosity in these regions comes from a diffuse stellar population associated with these clusters (e.g., FFG07).
-
•
The TOM and were determined for the GCLF of NGC 4649 and NGC 3115. In the case of NGC 3923, only was fitted. This parameter and the density profiles were used to obtain the total GCs populations, and the Specific Frequency of these galaxies. The highest value was obtained for NGC 3923, followed by NGC 4649, . We have obtained new estimations of the NGC 3115 and NGC 3379 specific frequencies; and respectively.
Acknowledgments: FF acknowledges financial support from the Agencia de Promoción Científica y Tecnológica (BID AR PICT 885). This work was partially supported by CONICET funds through a PIP 2009/712 grant. SEZ acknowledges support for this work in part from the NSF grant AST-0406891 Data were based on observations obtained at the Gemini Observatory, which is operated by the Association of Universities for Research in Astronomy, Inc., under a cooperative agreement with the NSF on behalf of the Gemini partnership: the National Science Foundation (United States), the Particle Physics and Astronomy Re- search Council (United Kingdom), the National Research Council (Canada), CONICYT (Chile), the Australian Re- search Council (Australia), CNPq (Brazil), and Ministerio de Ciencia, Tecnología e Innovación Tecnológica (Argentina). The Gemini program ID are GN-2007A-Q-37, GS-2007A-Q-49, GN-2007A-Q-37, GN-2002B-Q-25, GN-2003A-Q-22, GS-2004A-Q-9, GS-2004A-Q-9, GN-2003A-Q-22, GN-2001B-SV-104. This research has made use of the NASA/IPAC Extragalactic Database (NED), which is operated by the Jet Propulsion Laboratory, Caltech, under contract with the National Aero- nautics and Space Administration.
References
- Ajhar et al. (1994) Ajhar E. A.; Tonry J. L., 1994, ApJ, 429, 557
- Ashman & Zepf (1992) Ashman K. M., ZepfS. E., 1992, ApJ, 384, 50
- Ashman et al. (1995) Ashman K. M., Conti A., Zepf S. E., 1995, AJ, 110, 1164
- Bailin & Harris (2009) Bailin J., Harris W., 2009, ApJ, 695, 1082
- Bassino et al. (2006) Bassino L., Faifer F., Forte J., Dirsch B., Richtler T., Geisler D., Schubert Y., 2006, A&A, 451, 789
- Beasley et al. (2002) Beasley M. A., Baugh C. M., Forbes D. A., Sharples R. M., & Frenk C. S., 2002, MNRAS, 333, 383
- Beasley et al. (2004) Beasley M., Forbes D., Brodie J., Kissler-Patig M., 2004, MNRAS, 347, 1150
- Bergond et al. (2006) Bergond G. Zepf S. E., Romanowsky A., Sharples R., Rhode K., 2006, A&A, 448, 155
- Bertin & Arnouts (1996) Bertin E., Arnouts S., 1996, A&AS, 117, 393
- Blakeslee et al. (2010) Blakeslee J. P., Cantiello M., Peng E. W., 2010, ApJ, 710
- Bridges et al. (2006) Bridges T., Gebhardt K., Sharples R., Faifer F. R., Forte J. C., Beasley M. A., Zepf S., Forbes D., Hanes D., Pierce M., 2006, MNRAS, 373, 157
- Brodie & Strader (2006) Brodie, J.P., Strader, J. 2006, AR&A, 44, 193
- Buote & Canizares (1999) Buote D. A., Canizares C. R., MNRAS, 1999, 298, 811
- Couture, Harris & Allwright (1991) Couture J., Harris W. E., Allwright J. W. B., 1991, ApJ, 372, 97
- Cockcroft et al. (2009) Cockcroft R., Harris W., Wehner E., Whitmore B., Rothberg B., 2009, AJ, 138, 758
- Denicoló et al. (2005) Denicoló G., Terlevich R., Terlevich E., et al., MNRAS, 2005, 358, 813
- Dirsch et al. (2003) Dirsch B., Richtler T., Geisler D., Forte J. C., Bassino L., Gieren W, AJ, 125, 1908
- de Vaucouleurs et al. (1991) de Vaucouleurs G., de Vaucouleurs A., Corwin H. G., Buta R. J., Paturel G., Fouque P., 1991, Third Reference Catalog of Bright Galaxies (Springer: New York)
- Eggen et al. (1962) Eggen O., Lynden Bell D., Sandage A.R., 1962, ApJ, 136, 748
- Forbes et al. (1997) Forbes D. A., Brodie J. P., Grillmair C. J., 1997, AJ, 113, 1652
- Forbes & Forte (2001) Forbes D. A., Forte J. C., 2001, MNRAS, 322, 257
- Forbes et al. (2004) Forbes D.A., Faifer F. R., Forte J. C., Bridges T., Beasley M., Gebhardt K., Hanes D., Sharples R., Zepf S., 2004, MNRAS, 355, 608
- Forbes et al. (2011) Forbes D., Spitler L., Strader J., Romanowsky A., Brodie J., Foster C., 2011, MNRAS, acepted
- Forte et al. (2001) Forte J. C., Geisler D., Ostrov P. G., Piatti A. E., Gieren W., 2001, AJ, 121, 1992
- Forte et al. (2007) Forte J. C., Faifer F., Geisler D., 2007, MNRAS, 382, 1947
- Forte et al. (2009) Forte J. C., Vega I., Faifer F. R., 2009, MNRAS, 397, 1003
- Fukazawa et al. (2006) Fukazawa Y., Botoya-Nonesa J. G., Pu J., Ohto A., Kawano N., 2006, ApJ, 636, 698
- Fukugita et al. (1995) Fukugita M., Shimasaku M., Ichikawa T., 1995, PASP, 107, 945
- Fukugita et al. (1996) Fukugita M., Ichikawa T., Gunn J., Shimasaku M., Schneider D., 1996, AJ, 111, 1748
- Geller & Huchra (1983) Geller M. J., Huchra J. P., 1983, ApJS, 52, 61
- Gregg et al. (2004) Gregg M. D., Ferguson H. C., Minniti D., Tanvir N., Catchpole R., 2004, AJ, 127, 1441
- Harris & Hanes (1985) Harris W.E., Hanes D. A., 1985, ApJ, 291, 147
- Harris et al. (2006) Harris, W. E., et al. 2006, ApJ, 636, 90
- Harris (2009a) Harris W., 2009a, ApJ, 703, 939
- Harris (2009b) Harris W., 2009b,ApJ, 699,254
- Harris & Harris (2011) Harris G., Harris W., 2011, MNRAS, 410, 2347
- Harris et al. (2010) Harris W., Spitler L., Forbes D., Bailin J., 2010, MNRAS, 401, 1965
- Hook et al. (2004) Hook I. M., Jorgensen I., Allington-Smith J. R., Davies R. L., Metcalfe N., Murowinski R. G., Crampton D., 2004, PASP, 116, 425
- Jensen et al. (2003) Jensen J., Tonry J., Barris B., Thompson R., Liu M., Rieke M., Ajhar E., Blakeslee J., 2003, ApJ, 583, 712
- Jordán et al. (2009) Jordán A., Peng E., Blakeslee J., Côté P., Eyheramendy S., Ferrarese L., Mei S., Tonry J., West M., 2009, ApJS, 180, 54
- Kissler-Patig (2009) Kissler-Patig M., in Globular Clusters - Guides to Galaxies, Eso Astrophysics Symposia, Volume . ISBN 978-3-540-76960-6. Springer Berlin Heidelberg, 2009, p. 1
- Kundu & Whitmore (1998) Kundu A., Whitmore B. C., 1998, AJ, 116, 2841
- Kundu et al. (1999) Kundu A., Whitmore B., Sparks W., Macchetto F., Zepf S., Ashman K., 1999, ApJ, 513, 733
- Kundu & Whitmore (2001) Kundu A., Whitmore B. C., 2001, AJ, 121, 2950
- Kundu (2008) Kundu A., 2008, AJ, 136, 1013
- Kuntschner et al. (2002) Kuntschner H., Ziegler B. L., Sharples R. M., Worthey G., Fricke K. J., 2002, A&A, 395, 761
- Larsen et al. (2001) Larsen S. S.,Brodie J. P., Huchra J. P., Forbes D., Grillmair C. J., 2001, AJ, 121, 2974
- Lauer & Kormendy (1986) Lauer T. R., Kormendy J., 1986, ApJ, 303, 1
- Lee et al. (2008) Lee M. G., Park H. S., Kim E., Hwang H. S, Kim S. C., Geisler, 2008, ApJ, 682, 135
- MacDonald (2007) MacDonald, P.D.M. 2007, documentation and code at http://www.math.mcmaster.ca/peter/mix/mix.html, Department of Mathematics and Statistics, McMaster University
- Malin & Carter (1980) Malin D. F., Carter D., 1980, Nature, 285, 643
- Mendel et al. (2007) Mendel J. T., Proctor R. N., Forbes D. A., 2007, MNRAS, 379, 1618
- Metcalfe et al. (2001) Metcalfe N., Shanks T., Campos A., McCracken H. J., Fong R., 2001, MNRAS,323, 795
- Mieske et al. (2006a) Mieske S., Hilker M., Infante L., Jordán A., 2006, AJ, 131, 2442
- Mieske et al. (2006b) Mieske S., Jordán A., Côté P., Kissler-Patig M., Peng E., Ferrarese L., Blakeslee J., Mei S., Merritt D., Tonry J., West M., 2006, ApJ, 653, 193
- Mieske et al. (2008) Mieske S., Hilker M., Jordán A., Infante L., Kissler-Patig M., Rejkuba M., Richtler T., Côté P., Baumgardt H., West M., Ferrarese L., Peng E., 2008, A&A, 487, 921
- Meylan et al. (2001) Meylan G., Sarajedini A., Jablonka P., Djorgovski S. G., Bridges T., Rich R. M., 2001, AJ, 122, 830
- Mulchaey et al. (2003) Mulchaey J. S., Davis D. S., Mushotzky R. F., Burstein D., 2003, ApJS, 145, 39
- Muratov & Gnedin (2010) Muratov A., Gnedin O., 2010, ApJ, 718, 1266
- Navarro et al. (1996) Navarro, J.F., Frenk, C. S., White, S.D.M., 1996, ApJ, 462, 563
- Norris, Sharples & Kuntschner (2006) Norris M. A., Sharples R. M., Kuntschner H., 2006, MNRAS, 367, 815
- Norris et al. (2008) Norris M., Sharples R., Bridges T., Gebhardt K., Forbes D., Proctor R., Faifer F. R., Forte J. C., Beasley M. A., Zepf S., Hanes D., 2008, MNRAS, 385, 40
- Norris & Kannappan (2011) Norris M., Kannappan S., 2011, MNRAS, acepted
- Norris et al. (2011) Norris M. et al., 2011, MNRAS, submmited
- Oser et al. (2010) Oser L., Ostriker J., Naab T., Johansson P., Burkert A., 2010, ApJ, 725, 2312
- O’Sullivan et al. (2001) O’Sullivan E., Forbes D., Ponman T., 2001, MNRAS, 328, 461
- Ostrov et al. (1998) Ostrov P., Forte J. C., Geisler D., 1998, AJ, 116, 2854
- Peng et al. (2006) Peng E. W., Jordán A., Côté P., Blakeslee J. P., Ferrarese L., Mei S., West M. J., Merritt D., Milosavljević, M., Tonry J. L., 2006, ApJ, 639, 95
- Peng et al. (2008) Peng E. W., Jordán A., Côté P., Takamiya M., West M. J., Blakeslee J. P., Chin-Wei Chen, Ferrarese L., Mei S., Tonry J., West A., 2008, ApJ, 681, 197
- Peng et al. (2008) Peng E. W., Jordán A., Blakeslee J. P., Mieske S., Côté P., Ferrarese L., Harris W., Madrid J., Gerhardt R. Meurer, 2009, ApJ, 703, 42
- Pierce et al. (2006a) Pierce M., Beasley M., Forbes D.A., Bridges T., Gebhardt K., Faifer F. R., Forte J. C., Zepf S., Sharples R., Hanes D., 2006a, MNRAS, 366, 1253
- Pierce et al. (2006b) Pierce M., Bridges T., Forbes D., Proctor R., Beasley M., Gebhardt K., Faifer F., Forte J. C., Zepf S., Sharples R., Hanes D, 2006b, MNRAS, 368, 325
- Puzia et al. (2002) Puzia T. H., Zepf S. E., Kissler-Patig M., Hilker M., Minniti D., Goudfrooij P., 2002, A&A, 391, 453
- Puzia et al. (2004) Puzia T. H., Kissler-Patig M., Thomas D., Maraston C., Saglia1 R. P., Bender R., Richtler T., Goudfrooij P., Hempel M., A&A, 415, 123
- Quinn (1984) Quinn P., 1984, ApJ, 279, 596
- Randall, Sarazin & Irwin (2004) Randall S. W., Sarazin C. L., & Irwin J. A., 2004, ApJ, 600, 729
- Randall, Sarazin & Irwin (2006) Randall S. W., Sarazin C. L., Irwin J. A., 2006, ApJ,636, 200
- Revnivtsev et al. (2008) Revnivtsev M., Churazov E., Sazonov S., Forman W., Jones C., 2008, A&A, 490, 37
- Rhode & Zepf (2004) Rhode K., Zepf S., 2004, AJ, 127, 302
- Robin et al. (2003) Robin A.C., Reylé C., Derrière S., et al., 2003, A&AS, 409, 523
- Sarazin et al. (2003) Sarazin C., Kundu A., Irwin J., Sivakoff G., Blanton E., Randall S., 2003, ApJ, 595, 743
- Schweizer & Seitzer (1992) Schweizer F., Seitzer P., 1992, AJ, 104, 1039
- Schlegel, Finkbeiner & Davis (1998) Schlegel D.J., Finkbeiner D.P., Davis M., 1998, ApJ, 500, 525
- Searle & Zinn (1978) Searle L., Zinn R., 1978, ApJ, 205, 357
- Sikkema et al. (2006) Sikkema G., Peletier R. F., Carter D., Valentijn E. A., Balcells M., 2006, A&A, 458, 53
- Sil’chenko, Afanasiev & Vlasyuk (1992) Sil’chenko O. K., Afanasiev V. L., Vlasyuk V. V., 1992, AZh, 69, 1121
- Sil’chenko (2000) Sil’chenko O. K., 2000, AJ, 120, 741
- Sinnott et al. (2010) Sinnott B., Hou A., Anderson R., Harris W., Woodley K., 2010, AJ, 140, 2101
- Smith et al. (2002) Smith el al., 2002, AJ, 123, 2121
- Spitler et al. (2006) Spitler, L. R., Larsen, S. S., Strader, J., Brodie, J. P., Forbes, D. A., & Beasley, M. A. 2006, AJ, 132, 1593
- Spitler et al. (2010) Spitler L, 2010, MNRAS, 406, 1125
- Stetson (1987) Stetson P. B., 1987, PASP, 99, 191
- Strader et al. (2006) Strader J., Brodie, J. P., Spitler L., Beasley M., AJ, 132, 2333
- Strader & Smith (2008) Strader J., Smith G.H., 2008, AJ, 136, 1828
- Terlevich & Forbes (2002) Terlevich A., Forbes D., 2002, MNRAS, 330, 547
- Tonry et al. (2001) Tonry J. L., Dressler A., Blakeslee J. P., et al. 2001, ApJ, 546, 681
- Thomas et al. (2004) Thomas D., Maraston C., Korn A., 2004, MNRAS, 351, 19
- Thomas et al. (2005) Thomas D., Maraston C., Bender R., Mendes de Oliveira C., 2005, ApJ, 621, 673
- Thomson & Wright (1990) Thomson R., Wright A., 1990, MNRAS, 247, 122
- Tortora et al. (2010) Tortora C., Napolitano N. R., Cardone V. F., Capaccioli M., Jetzer Ph., Molinaro R., 2010, MNRAS, 407, 144
- Villegas et al. (2010) Villegas et al., 2010, ApJ, 717, 603
- Waters et al. (2009) Waters C., Zepf S., Lauer T., Baltz E., 2009,ApJ, 693, 463
- Wehner & Harris (2007) Wehner E., Harris W., 2007, ApJ, 668L, 35
- Wehner et al. (2008) Wehner E., Harris W., Whitmore B., Rothberg B., Woodley K., 2008, ApJ, 681, 1233
- White, Keel & Conselice (2000) White R. E., Keel W. C., Conselice C. J., 2000, ApJ, 542, 761
- Whitlock, Forbes & Beasley (2003) Whitlock S., Forbes D. A., Beasley M. A., 2003, 2003, MNRAS, 345, 949
- Zepf, Geisler & Ashman (1994) Zepf S.E., Geisler D., Ashman K. M., 1994, ApJ, 435, 117
- Zepf, Ashman & Geisler (1995) Zepf S.E., Ashman K. M., Geisler D., 1995, ApJ, 443, 570
Appendix A Photometric data
| Object ID | RA | DEC | notes | ||||||||
|---|---|---|---|---|---|---|---|---|---|---|---|
| N4649GC2 | 12:43:33.74 | 11:34:02.5 | 1708.009 | 53.761 | 23.8009 | 0.023 | 23.1895 | 0.023 | 22.8163 | 0.024 | |
| N4649GC3 | 12:43:33.97 | 11:34:01.3 | 1685.015 | 62.249 | 22.7809 | 0.016 | 22.0355 | 0.008 | 21.6613 | 0.013 | |
| N4649GC4 | 12:43:29.01 | 11:34:01.2 | 2185.490 | 62.391 | 24.0299 | 0.013 | 23.5035 | 0.017 | 23.1393 | 0.025 | |
| N4649GC5 | 12:43:38.04 | 11:34:02.4 | 1273.952 | 55.273 | 23.7579 | 0.028 | 22.9325 | 0.016 | 22.5213 | 0.019 | |
| N4649GC6 | 12:43:41.82 | 11:34:02.4 | 892.493 | 55.250 | 23.6949 | 0.015 | 23.2035 | 0.015 | 22.9523 | 0.025 | |
| N4649GC7 | 12:43:41.24 | 11:34:03.2 | 950.987 | 50.004 | 23.9169 | 0.020 | 23.3875 | 0.019 | 23.3253 | 0.032 | |
| N4649GC8 | 12:43:34.64 | 11:33:58.9 | 1617.590 | 78.958 | 21.2469 | 0.008 | 20.7345 | 0.011 | 20.5343 | 0.013 | |
| N4649GC9 | 12:43:37.67 | 11:34:00.1 | 1310.816 | 70.643 | 22.5349 | 0.010 | 22.0455 | 0.017 | 21.7833 | 0.022 | |
| … | … | … | … | … | … | … | … | … | … | … | …333The complete photometry for GC candidates is available in the on-line version. |
| Object ID | RA | DEC | notes | ||||||||
|---|---|---|---|---|---|---|---|---|---|---|---|
| N4649UCD1 | 12:43:41.23 | 11:30:48.3 | 952.676 | 1388.875 | 18.4779 0.003 | 17.8995 | 0.007 | 17.7183 | 0.006 | … | |
| … | … | …. | … | … | … | … | … | … | … | … | …444The complete photometry for UCD candidate is available in the on-line version. |