RXTE Timing Analysis of the AXP 1E 2259+586
Abstract
We present pulse timing analysis of Rossi X-ray Timing Explorer (RXTE) observations of the anomalous X-ray pulsar 1E 2259+586 from its 2002 outburst to October 2010. Our objectives are to extend the work on the recovery stage after the 2002 glitch, investigate the variations caused by the second glitch which occurred in 2007 and look for other unusual events, if any, that arise in the regular spin-down trend of the source. We find that the fractional change in the spin frequency derivative after the 2002 glitch is not stable since it decreased an order of magnitude, from to , in about 2.5 years. From pulse timing analysis, we discover two small frequency shifts with fractional changes and . While the first one of these shifts is not found to have a fractional frequency derivative change while second one has . We interpret these frequency changes as positive and negative microglitches similar to those seen in radio pulsars.
keywords:
pulsars: individual (1E 2259+586) – X-rays: stars1 Introduction
The X-ray pulsar (AXP) 1E 2259+586 was discovered by Fahlman & Gregory (1981) within the supernova remnant G109.1-1.0 with s pulsations. Further X-ray observations of 1E 2259+586 with Tenma, EXOSAT and Ginga (Koyama et al. 1987, 1989; Morini et al. 1988; Hanson et al. 1988; Iwasawa et al. 1992) have indicated that the AXP is steadily spinning down with a rate of Hz.s-1, which is too slow to power the observed X-ray luminosity. Using ROSAT observations, Baykal & Swank (1996) found a marginal spin-up episode between 1991 and 1992. Mereghetti, Israel & Stella (1998) using the RXTE observations gave an upper limit on the semi-axis to be 0.03 lt.sec suggesting a white dwarf companion smaller than 0.8 M⊙ (see also Baykal et al. (1998)). Using RXTE observations, Kaspi, Chakrabarty & Steinberger (1999) obtained, for the first time, a phase coherent timing solution for 1E 2259+586 , indicating stability over a 2.6 yr time period. This stability strongly suggested the magnetar interpretation rather than the binary accretion hypothesis. Using ASCA and BBXRT observations, Corbet et al. (1995) showed for the first time that the X-ray spectra can be explained by a blackbody plus power law model. INTEGRAL and RXTE observations have revealed the evidence of hard spectral tails above 10 keV (Kuiper et al. 2006) (see also Kaspi & Boydstun (2010)).
In June 2002, 1E 2259+586 showed an outburst consisting of over 80 short SGR-like bursts (Gavriil, Kaspi & Woods 2004). During this outburst, flux level of the source increased by a factor of more than 20 accompanied with a glitch of fractional frequency change (Kaspi et al. 2003; Woods et al. 2004). In 2007, a second glitch of was observed when the source was quiescent (Dib, Kaspi & Gavriil 2008).
Woods et al. (2004) modelled XMM and RXTE spectra of 1E 2259+586 before and after the 2002 outburst with the blackbody plus power law model modified by interstellar absorption. The blackbody temperature increased rapidly after the outburst in contrast to the photon index which decayed about half of its pre-outburst value. Both parameters quickly recovered to within of their their pre-burst levels within the first 1–3 days (Woods et al. 2004). In the first few hours of the outburst, XMM and RXTE observations revealed that pulsed fraction decreased to then, like the spectral parameters, it quickly recovered to its pre-outburst state within 6 days. There were also some variations in the phase dependence of the energy spectrum: While the photon index showed significant variability one week before the outburst, this variation vanished three days after the outburst. XMM-Newton observations of the source showed that X-ray flux decayed with a power law index after 2002 outburst until 2005. A strong correlation between X-ray flux and hardness ratio is observed by Zhu et al. (2008). Pulse profile of the source changed in such a way that much of the power moved to the fundamental harmonic and the second harmonic regained its power within 1 week after which a very slow recovery within several weeks was observed (Woods et al. 2004). Using the cumulative properties of the outburst, Woods et al. (2004) concluded that the pulsar experienced something which was not sudden at all and including two components, one of them was on the surface such as a series of fractures and the other distributed over a wider region like smoother plastic change. Hence, both the superfluid interior and the magnetosphere were affected.
The Spitzer Space Telescope observations of Kaplan et al. (2009) at near- and mid-infrared regions of the electromagnetic spectrum was interpreted as a possible indication of the presence of a passive X-ray-heated dust disc. Kaplan et al. (2009) also showed that the IR data of this source can also be modelled by a power law spectrum which could be explained by magnetospheric emission. Tian, Leahy & Li (2010) estimated the distance to the AXP (and also to the SNR G109.1-1.0) as kpc using the 21-cm H I-line and CO-line spectra of the SNR G109.1-1.0, H II region Sh 152, and the adjacent molecular cloud complex.
In this paper, we construct phase coherent pulse arrival times between 2002 and 2010. Using these arrival times we refine the timing solution after the 2002 glitch and look for frequency and derivative changes in these time intervals.
2 Data & Analysis
2.1 Data
The dataset used in this work consists of Rossi X-Ray Timing Explorer (RXTE) proportional counter array (PCA) observations of the AXP 1E 2259+586 covering the time between March 2000 (MJD 51613) and October 2010 (MJD 55483). The PCA operates in the energy range 2–60 keV using an array of five collimated xenon/methane multi-anode proportional counter units (PCUs). The instrument has a total effective area of cm2 and a field of view of FWHM (Jahoda et al. 1996).
A total of 479 observations were used for the analysis presented in this paper. The durations of observations vary from 10.6 ks to 0.2 ks, most of them being greater than 1 ks. During the analysed RXTE-PCA observations, the number of active PCUs varied between 1 and 4. Due to timing concerns, we used all the available layers of all PCUs in our analysis.
2.2 Pulse-Timing Analysis
The GoodXenonWithPropane or GoodXenon mode and event mode data were energy selected (2–10 keV) for all xenon layers, and were binned with 125 ms time resolution. The time values in the light curves were then corrected to the solar system barycentre. We used the standard analysis tools for RXTE-PCA data included in FTOOLS package to obtain the light curves and to merge them into a single light curve covering all the interval mentioned above. In the extraction of lightcurves we removed all outburst events in order to avoid sudden pulse profile changes. The light curves were folded at frequencies given by Woods et al. (2004). The time series was split into intervals of approximately same duration, and each segment was folded with a quadratic ephemeris with the same frequency and frequency derivative, so that we obtained a pulse profile for each time interval, which is made up of 20 phase bins. Then, we switched to the harmonic representation of pulse profiles as introduced by Boynton (1985)
| (1) |
The template pulse is extracted from a longer time interval at which glitch recovery has already taken place
| (2) |
Then, by cross-correlating the pulse profiles with the template pulse, we obtained the pulse arrival times, . In order to see the effect of pulse profile changes in pulse timing, we also performed pulse timing using first and second harmonics independently. Our pulse arrival times were consistent within 1 level with 10 harmonic expansion of pulse profiles for 20 phase bins. This suggests that even if the pulse profile changes, pulse phases are not effected. As a final check, we gave weight to all pulse harmonics using the variances of harmonics from all pulses. We applied the cross correlation for the weighted pulses (or filtered pulses), and again we obtained the pulse arrival times as those of unweighted pulses in 1 level confidence. We concluded that pulse shape changes do not have any effect on pulse phases and pulse timing analysis.
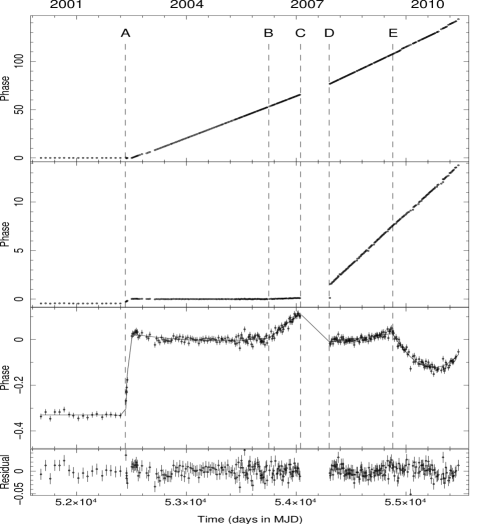
In top panel of Fig. 1, it is seen that the slope of the pulse arrival times changes after the first glitch. In the estimation of pulse arrival times, the spin down rate of the source was kept fixed at the value before the glitch, which is Hz.s-1. By modelling the pulse arrival times lying after the first glitch by a first order polynomial, with , the new pulse arrival times were obtained for the corrected pulse frequency, . In the second panel of Fig. 1, it is clearly seen that the slope of the pulse arrival times is shifted again after MJD 54300. The shift in the pulse frequency is found again using the method explained above and new pulse arrival times are obtained after MJD 54300 by correcting the pulse frequency again. The third panel of Fig. 1, where we present pulse arrival times for the corrected frequencies after the first and second glitches, shows that there are additional breaks in pulse arrival time series around MJD 53750 and 54880 (see vertical dash lines quoted B and E)
The first glitch is at MJD 52443.13 and was reported by Kaspi et al. (2003) to be accompanied by an outburst of many individual bursts. About 1360 days after the first glitch, at around MJD 53750, we resolved a small fractional frequency shift of . Phase connected pulse arrival times after MJD 54300 indicates another glitch with a fractional frequency change of . This second glitch is consistent with 1 level given by Dib et al. (2008) in their review paper of AXP glitches. Moreover, around MJD 54880, we have observed another fractional frequency shift of with . All the glitch episodes in this work are presented in Fig. 1 and timing solution are given in Tables 1 and 2.
For the first glitch,
as described in Woods
et al. (2004), the standard post-glitch relaxation models,
which consist of single or multiple exponential relaxation terms (Alpar et al. 1984b),
did not provide reasonable fits.
An alternative model is the irregular model including an exponential rise
term, which had been developed for two glitches of Crab pulsar (Lyne, Pritchard & Graham-Smith 1993; Wong, Backer & Lyne 2001).
In this model, the increase
in the slowdown rate is interpreted as the cumulative of successive glitches;
part of the increase is provided by a step and part is in the form of
an exponential rise
| (4) |
where the first two terms represent the frequency evolution before the glitch, is the glitch epoch, is the frequency jump with the glitch, and are the growth and decay amplitudes, respectively, and are the growth and decay time- scales respectively, and is the jump in the spin down rate. We used the corresponding phase evolution equation to fit our pulse arrival times in the period MJD 52390–53750 (The correction to the pulse frequency after the first glitch mentioned above is ). In the fitting process, we used the statistic and leave all parameters as free parameter. For normalizations of exponentials we used the initial ranges as given by Woods et al. (2004).
In Table 1, we present timing solution of the first glitch for the extended time coverage from MJD 51613 to MJD 53750. Our analysis indicates that has shown a variation from to , i.e. there is an order of magnitude reduction in the fraction in a -year time. We also fitted the pulse arrival times for a time interval given by Woods et al. (2004) and found that the timing solution is consistent with Woods et al. (2004) in 1 level.
The small frequency shifts of with both signs at MJD 53750 and 54880 are at the order of microglitches seen in radio pulsars. In the first frequency shift, is not significant, however in the second one this value is found to be , i.e. the fractional change in the pulse frequency derivative is negative. This is not very unusual when compared to the microglitches in radio pulsars, since there is no preferred sign for both of the fractional jumps and (Chukwude & Urama 2010). The timing parameters of these small frequency shifts are given in Table 2.
| Parameter | Value 1 | Value 2 |
|---|---|---|
| Spin frequency, (Hz) | ||
| Spin frequency derivative, (Hz.s-1) | ||
| Epoch (MJD) | ||
| (Hz) | ||
| (Hz) | ||
| (days) | ||
| (Hz) | ||
| (days) | ||
| (Hz.s-1) | ||
| (MJD) | ||
| rms timing residual (ms) | 85.1 | |
| Start observing epoch (MJD) | ||
| End observing epoch (MJD) |
Numbers in parentheses indicate 1 uncertainties in the least significant digits quoted. 1 Taken from table 4 of Woods et al. (2004). 2 From our analysis.
| Parameter | Microglitch 1 | Glitch 2 | Microglitch 2 |
|---|---|---|---|
| Spin frequency,, (Hz) | |||
| Spin frequency derivative, (Hz.s-1) | |||
| Epoch (MJD) | 53750 | 54040 | 54880 |
| (Hz) | |||
| (Hz.s-1) | – | – | |
| (MJD) | |||
| rms timing residual (ms) | 76.8 | 66.8 | 106.7 |
| Start observing epoch (MJD) | 53700 | 53900 | 54800 |
| End observing epoch (MJD) | 54040 | 54900 | 55570 |
Numbers in parentheses give 1 uncertainties in the least significant digits quoted.
3 Discussion
In this work we presented extended pulse timing analysis of 1E 2259+586 from 2002 to 2010. In phase coherent pulse timing analysis, we found that after 2002 glitch reduced an order of magnitude in a -year time. We also discover two micro glitches and . In the first frequency shift, we do not resolve frequency derivative. In the latter one, fractional change in the spin down rate is found to be .
Microglitches make up a class of small amplitude resolvable jumps that can be observed in both, or either of pulsar rotation frequency or its first time derivative (Cordes & Downs 1985; Chukwude 2002; Cordes et al. 1988; D’Alessandro et al. 1995). The orders of magnitude for and are in the range and , respectively. So far 319 micro glitches are observed from 46 radio pulsars (Cordes & Downs 1985; D’Alessandro et al. 1995; Chukwude & Urama 2010). Microglitches observed in 1E 2259+586 are of the order of the upper limits of radio pulsar microglitches in magnitude . Unlike the large glitches, microglitches can have both negative and positive signs in their fractional pulse frequencies and first time derivatives. Hence,it is difficult to understand microglitches in terms of theories developed for large glitches (Cordes & Downs 1985; Cordes et al. 1988). The cause of micro glitches is unclear but can be explained as involving neutron star interior and/or magnetospheric torque fluctuations (Ruderman et al. 1998). The magnetar crust can be cracked by the variations of the magnetic field configuration (Ruderman et al. 1998). In this case, both signs of microglitches may be observed.
Anti-glitch (negative glitch) behaviour have been seen in two other magnetars (Thompson et al. 2000; Gavriil et al. 2011). Sudden spin down trend of SGR 1900+14 is interpreted by Thompson et al. (2000) as an anti-glitch with a fractional pulse frequency change of . However, the scale of this event is four orders of magnitude larger than that of the negative microglitch of 1E 2259+586. For AXP 4U 0142+61, Gavriil, Dib & Kaspi (2011) showed that the total fractional frequency jump at the time of glitch is ; however, the decay of large glitch event left a net negative slow-down portion of after 17 days of recovery. In addition, for rotation powered pulsar PSR J1846-0258, Livingstone, Kaspi & Gavriil (2010) reported a large spin up glitch which experienced a large recovery and ended up with a net decrease of pulse frequency similar to the recovery of AXP 4U 0142+61 and event occurred in SGR 1900+14. So far 1E 2259+586 is the unique source showing microglitch/anti-glitch events among the AXPs and SGRs (Dib et al. 2008).
In magnetars, glitches may be triggered by strong internal magnetic fields as the crust is deformed, either plastically or cracked violently (Thompson & Duncan 1996). There may be some parts of superfluid rotating more slowly than the crust. Then, by a glitch the angular momentum is transferred from the crust to the superfluid, opposing the case in radio pulsar glitches, and the crust spins down after the glitch. This explanation is proposed by Thompson et al. (2000) to explain the net spin down rate event in SGR 1900+14. Hence, small scale magnetar glitches can explain the glitch/anti-glitch trend of micro glitches like those seen in 1E 2259+586.
The 2002 glitch is well-studied by Woods et al. (2004) until the post glitch recovery mid of 2003. We extended post glitch recovery until the first micro glitch event seen in 2006. In the pulse timing analysis, we confirmed that the fractional frequency change of the glitch has an amplitude of , and other post glitch parameters (see Table 1) determined by Woods et al. (2004) from their 500-day time span of observations. The fractional change in the pulse frequency derivative , from our 1360-day pulse arrival times is found to be 17 times smaller than that of Woods et al. (2004), which is deduced from a shorter time interval. We should note that our analysis in their timing interval yielded a similar value in limit. (This consistency in does not disrupt even if we freeze the normalizations of the exponential components to the values given by Woods et al. (2004)). This indicates that fractional change of pulse frequency derivative is variable. As discussed in Woods et al. (2004) the negative sign of the fractional change of derivative of pulse frequencies is quite unusual for large radio pulsar glitches. For the large glitches fractional frequency change is and fractional pulse frequency derivative has the range (see also Alpar & Baykal (1994, 2006)).
In the standard large glitches of radio pulsars, the sudden shifts in the pulse frequency and the spin down rate of a radio pulsar have been considered to be due to the coupling mechanism between the crust and the crust superfluid (Alpar et al. 1984a,b); (Alpar, Cheng & Pines 1989). The angular momentum transfer between the crust superfluid and the crust is provided by the quantized vortices. There are two types of vortex lines separated according to their dynamical behaviour in the superfluid. One type is responsible for the continuous vortex flow since they are not pinned to the inner crust of the neutron star but they unpin and repin at some rate. The other type of vortices are pinned to the crustal nuclei and are not allowed to move radially outwards up to the maximum tolerance of the pinning force. Hence, a lag appears between the spin-down rates of the crust and the superfluid, . When the vortices cannot stand this lag any more, they suddenly unpin from the crustal nuclei and some angular momentum is transferred to the crust. This sudden unpinning of the superfluid neutron vortices from the crustal nuclei can result in glitches of fractional pulse frequency changes of to together with increases in the magnitudes of spin down rate. The latter type of vortices do not have any contribution to the usual spin down trend of the pulsar other than the glitches. Hence, the relaxation of the spin down rate after the glitch is accomplished by the continuous vortex flow, and the persistent change in the spin down rate, which is observed sometimes, is interpreted as the increase in the amount of the pinned vortices that cannot move towards the outer crust after the glitch. If the superfluid part supplying the vortex flow has moment of inertia and the trapped part has the moment of inertia , then the equations governing the dynamics of the glitches are determined as follows (Alpar, Kiziloǧlu & van Paradijs 1995)
| (5) | |||||
| (6) |
where is the total moment of inertia of the pulsar and is the change of the rotation frequency of the superfluid interior. Thus, in the vortex creep theory the fractional change in the spin down rate is determined by the fraction which should have a positive value in the presence of a constant external torque applied on the pulsar. Unless the vortices propagate inwards to the rotation axis of the star, the negative value of can be explained by external torques. This could be due to the secular change of magnetic moment (Ruderman 1991) or change in the electromagnetic torque by a reorganization of magnetic moment and angular momentum axis of the star (Link & Epstein 1997). However, fractional change of the pulse frequency derivative by a factor of 17 in a time scale of only 860 days due to the magnetic moment change is quite fast. Another explanation could be relaxation of twisted magnetic fields which creates stresses on the crust (Thompson et al. 2002). Persistent seismic activity may modulate the spin down torque and crustal shear waves drives particles wind and causes angular momentum changes (Thompson & Blaes 1998; Harding et al. 1999; Thompson et al. 2000). It is interesting to note that all glitches of 1E 2259+586 have occurred almost at a constant spin down rate which is Hz -1. This suggests that glitches happen to be when post glitch frequency derivatives are completely relaxed. Therefore, the excitation of precession during the glitch, due to a stable reorientation of magnetic axis relative the rotation axis of the star is considered unlikely since long term torque on the star is not stable (Link & Epstein 1997).
As a final remark, after 2002 glitch, Kaspi et al. (2003) report for a time span of a couple of weeks. They suggest that the increase of spin down rate is due to the decoupling of crust and core superfluid where they recouple in 2 weeks time-scale which is extremely long compared to the theoretical estimates (Alpar & Sauls 1988; Sidery & Alpar 2009). This is also clearly resolved in our pulse timing analysis for a particular short time span; however, as we are interested in new events in the long term recovery and unusual events in pulse timing, this aspect of 2002 glitch is kept out of scope of this work.
acknowledgments
We acknowledge research project TBAG 109T748 of the Scientifi c and Technological Research Council of Turkey (TÜBİTAK). A.B. also appreciate the useful discussions with M. Ali Alpar and K.S.Cheng for the comment on the paper. We thank anonymous referee for the useful suggestions to improve the paper.
References
- Alpar & Baykal (1994) Alpar M. A., Baykal A., 1994, MNRAS, 269, 849
- Alpar & Baykal (2006) Alpar M. A., Baykal A., 2006, MNRAS, 372, 489
- Alpar et al. (1989) Alpar M. A., Cheng K. S., Pines D., 1989, ApJ, 346, 823
- Alpar et al. (1995) Alpar M. A., Kiziloǧlu Ü., van Paradijs J., eds, 1995, The lives of neutron stars. Proceedings. Vol. 450 of NATO Advanced Science Institutes (ASI) Series C
- Alpar & Sauls (1988) Alpar M. A., Sauls J. A., 1988, ApJ, 327, 723
- Baykal & Swank (1996) Baykal A., Swank J., 1996, ApJ, 460, 470
- Baykal et al. (1998) Baykal A., Swank J. H., Strohmayer T., Stark M. J., 1998, A&A, 336, 173
- Boynton (1985) Boynton D.and Deeter J., 1985, in F. Nagase & S. Hayakawa ed., Proceedings of the Inuyama workshop on timing analysis of X-ray sources Inuyama Workshop, X-Ray Pulse Timing Studies, I&II
- Chukwude (2002) Chukwude A. E., 2002, Phd thesis, University of Nigeria, Nsukka
- Chukwude & Urama (2010) Chukwude A. E., Urama J. O., 2010, MNRAS, 406, 1907
- Corbet et al. (1995) Corbet R. H. D., Smale A. P., Ozaki M., Koyama K., Iwasawa K., 1995, ApJ, 443, 786
- Cordes & Downs (1985) Cordes J. M., Downs G. S., 1985, ApJS, 59, 343
- Cordes et al. (1988) Cordes J. M., Downs G. S., Krause-Polstorff J., 1988, ApJ, 330, 847
- D’Alessandro et al. (1995) D’Alessandro F., McCulloch P. M., Hamilton P. A., Deshpande A. A., 1995, MNRAS, 277, 1033
- Dib et al. (2008) Dib R., Kaspi V. M., Gavriil F. P., 2008, ApJ, 673, 1044
- Fahlman & Gregory (1981) Fahlman G. G., Gregory P. C., 1981, Natur, 293, 202
- Gavriil et al. (2011) Gavriil F. P., Dib R., Kaspi V. M., 2011, ApJ, 736, 138
- Gavriil et al. (2004) Gavriil F. P., Kaspi V. M., Woods P. M., 2004, ApJ, 607, 959
- Hanson et al. (1988) Hanson C. G., Dennerl K., Coe M. J., Davis S. R., 1988, A&A, 195, 114
- Harding et al. (1999) Harding A. K., Contopoulos I., Kazanas D., 1999, ApJ, 525, L125
- Iwasawa et al. (1992) Iwasawa K., Koyama K., Halpern J. P., 1992, PASJ, 44, 9
- Jahoda et al. (1996) Jahoda K., Swank J. H., Giles A. B., Stark M. J., Strohmayer T., Zhang W., Morgan E. H., 1996, in O. H. Siegmund & M. A. Gummin ed., Society of Photo-Optical Instrumentation Engineers (SPIE) Conference Series Vol. 2808 of Society of Photo-Optical Instrumentation Engineers (SPIE) Conference Series, In-orbit performance and calibration of the Rossi X-ray Timing Explorer (RXTE) Proportional Counter Array (PCA). pp 59–70
- Kaplan et al. (2009) Kaplan D. L., Chakrabarty D., Wang Z., Wachter S., 2009, ApJ, 700, 149
- Kaspi & Boydstun (2010) Kaspi V. M., Boydstun K., 2010, ApJ, 710, L115
- Kaspi et al. (1999) Kaspi V. M., Chakrabarty D., Steinberger J., 1999, ApJ, 525, L33
- Kaspi et al. (2003) Kaspi V. M., Gavriil F. P., Woods P. M., Jensen J. B., Roberts M. S. E., Chakrabarty D., 2003, ApJ, 588, L93
- Koyama et al. (1987) Koyama K., Hoshi R., Nagase F., 1987, PASJ, 39, 801
- Koyama et al. (1989) Koyama K., Nagase F., Ogawara Y., Shinoda K., Kawai N., Jones M. H., Williams O. R., Watson M. G., Makishima K., Ohashi T., 1989, PASJ, 41, 461
- Kuiper et al. (2006) Kuiper L., Hermsen W., den Hartog P. R., Collmar W., 2006, ApJ, 645, 556
- Link & Epstein (1997) Link B., Epstein R. I., 1997, ApJ, 478, L91+
- Livingstone et al. (2010) Livingstone M. A., Kaspi V. M., Gavriil F. P., 2010, ApJ, 710, 1710
- Lyne et al. (1993) Lyne A. G., Pritchard R. S., Graham-Smith F., 1993, MNRAS, 265, 1003
- Mereghetti et al. (1998) Mereghetti S., Israel G. L., Stella L., 1998, MNRAS, 296, 689
- Morini et al. (1988) Morini M., Robba N. R., Smith A., van der Klis M., 1988, ApJ, 333, 777
- Ruderman et al. (1998) Ruderman M., Zhu T., Chen K., 1998, ApJ, 492, 267
- Ruderman (1991) Ruderman R., 1991, ApJ, 382, 576
- Sidery & Alpar (2009) Sidery T., Alpar M. A., 2009, MNRAS, 400, 1859
- Thompson & Blaes (1998) Thompson C., Blaes O., 1998, PhRvD, 57, 3219
- Thompson & Duncan (1996) Thompson C., Duncan R. C., 1996, ApJ, 473, 322
- Thompson et al. (2000) Thompson C., Duncan R. C., Woods P. M., Kouveliotou C., Finger M. H., van Paradijs J., 2000, ApJ, 543, 340
- Thompson et al. (2002) Thompson C., Lyutikov M., Kulkarni S. R., 2002, ApJ, 574, 332
- Tian et al. (2010) Tian W. W., Leahy D. A., Li D., 2010, MNRAS, 404, L1
- Wong et al. (2001) Wong T., Backer D. C., Lyne A. G., 2001, ApJ, 548, 447
- Woods et al. (2004) Woods P. M., Kaspi V. M., Thompson C., Gavriil F. P., Marshall H. L., Chakrabarty D., Flanagan K., Heyl J., Hernquist L., 2004, ApJ, 605, 378
- Zhu et al. (2008) Zhu W., Kaspi V. M., Dib R., Woods P. M., Gavriil F. P., Archibald A. M., 2008, ApJ, 686, 520