Galaxy subgroups in galaxy clusters
Abstract
Galaxies which fall into clusters as part of the same infall halo can retain correlations due to their shared origin. N-body simulations are used to study properties of such galaxy subgroups within clusters, including their richnesses and prevalence. The sizes, densities and velocity dispersions of all subgroups with galaxies are found and compared to those of the host clusters. The largest galaxy subgroup provides a preferred direction in the cluster and is compared to other preferred directions in the cluster. Scatter in cluster mass measurements (via five observables), along lines of sight, is compared to the relation of the line of sight to this preferred direction: scatter in cluster velocity dispersion measurements show the strongest correlation. The Dressler-Shectman test (Dressler & Shectman, 1988) is an observational method to detect cluster substructure. This test is applied to the cluster sample to see whether the substructure it identifies is related to these subgroups. The results for any specific line of sight seem noisy, however, clusters with large subgroups tend to have a higher fraction of lines of sight where the test detects substructure.
keywords:
cosmology: large scale structure, galaxies:clusters, groups1 Introduction
Galaxy clusters are of interest for many reasons (for some recent summaries and reviews see e.g. Voit (2005); Kravtsov et al (2009); Myers et al (2009); Allen, Evrard & Mantz (2011) and the proceedings from the 2008 Enrico Fermi School on clusters111http://people.sissa.it/lapi/efs08_website/). They are the largest virialized objects in the universe and as such extremely sensitive to the growth rate and mass density of the universe. They host unique astrophysical phenomena and the most luminous galaxies in the universe and are more generally a special environment for transforming galaxies they enclose. They were first discovered as clusters of galaxies (hence their name); but they are also deep dark matter potential wells which gravitationally lens, and are full of hot gas that emits in the X-ray and scatters cosmic microwave background photons (Sunyaev & Zel’dovich, 1972). All of these different properties can be combined to get a fuller understanding of the processes within and affecting galaxy clusters, and their evolution and observable properties.
Our interest here is in the galaxies in galaxy clusters, specifically those which joined the cluster as part of a shared infalling halo. These will be called galaxy subgroups hereon and are the focus of this note. (Galaxies falling in from the same filament also are expected to have correlations but will not be considered here.) Using N-body simulations with resolved subhalos222overdensities in phase space using the algorithm of Diemand, Kuhlen & Madau (2006), see below identified as galaxies, we study statistical properties of these galaxy subgroups for over 200 clusters. We measure their quantity, average properties, persistence, relation to some intrinsic cluster properties and mass observables, and how well they can be detected via one classic observational test.
Some corollaries of the presence of these subgroups are already known (Knebe, Gill & Gibson, 2004; Knebe et al, 2006; McIntosh et al, 2008; Angulo et al, 2009; Li & Mo, 2009; Simha et al, 2009; Wetzel, Cohn & White, 2009; Klimentowski et al, 2010). For example, satellite-satellite mergers within clusters and groups are not uncommon: galaxies which are group members when they fall in often merge with the center of their original infall group.
Groups of galaxies in clusters which are moving together or are more dense in space are sometimes referred to as substructures.333The term substructure can also refer to subhalos corresponding to the galaxies themselves in simulations, early work includes Klypin et al (1999); Moore et al (1999). X-ray cluster gas also can exhibit substructure (e.g. Richstone, Loeb & Turner (1992); Buote (2002) for early work and a review), as can the cluster dark matter, e.g. mapped through gravitational lensing (e.g. for a study on its effects on strong lensing of clusters see Hennawi et al (2007)). These gas and dark matter substructures presumably have some relationship to the subgroups of galaxies of interest here. Similarly, simulations are sometimes high enough resolution to resolve subhalos inside of subhalos (Weller, Ostriker & Bode, 2005; Shaw et al, 2007; Springel et al, 2008; Giocoli et al, 2009; Li & Mo, 2009; Yang, Mo & van den Bosch, 2008; Giocoli et al, 2010). If one identifies these sub-subhalos as galaxies then a relation is implied between their host subhalos and the galaxy subgroups described here. Other related work includes the tracking of groups of subhalos explicitly inside 8 simulated clusters (Gill et al, 2004), and the measurements of subgroups in Milky Way size simulated halos, including their distribution and velocity associations (Li & Helmi, 2008). (Local group subgroups often can be identified using more information, such as metallicity or three dimensional positional information. There is a large body of literature on the subject.) Earlier observational studies of subgroups in clusters in particular include analysis of ENACS (ESO Nearby Cluster Survey) clusters and Coma as well (Gurzadyan & Mazure, 1998, 2001). Previous work is extended here by the joint use of subhalos identified as galaxies (which preserves correlations between galaxies due to their histories), the subhalo and halo merging histories, and a large sample of clusters. It expands upon the subgroup properties and examples noted in White, Cohn & Smit (2010) (WCS hereon), for the same simulation.
As galaxies moving together within a cluster can indicate the cluster is not relaxed or, observationally, that interlopers are projected onto the cluster, tests have been designed to detect them. These tests (e.g. the Dressler-Shectman test (Dressler & Shectman, 1988)) have been applied to individual objects (including e.g. Boschin et al (2006); Girardi et al (2008); Barrena et al (2011) ) larger cluster surveys (e.g. Solanes, Salvador-Sole & Gonzalez-Casado (1999); Oegerle & Hill (2001); Burgett et al (2004); Hwang & Lee (2007); Ramella et al (2007); Milvang-Jensen et al. (2008); Aguerri & Sanchez-Janssen (2010); Einasto et al (2010)) and numerical data (e.g. Crone, Evrard & Richstone (1996); Cen (1997); Knebe & Mueller (2000); WCS ). An increase of galaxy and velocity substructure has been correlated (Espino-Briones, Plionis & Ragone-Figueroa, 2007; Ragone-Figueroa & Plionis, 2007) with more recent mergers, higher density environments, and increased cluster elongation. Pairs of galaxies in clusters were studied previously also, e.g. in den Hartog (1997); Taylor & Babul (2004).
The work here is based upon N-body simulations, described in §2. Hydrodynamic simulations, which include gas physics and a variety of subgrid prescriptions, are not yet available at the volume and resolution considered here. Some comparisons of subhalo properties with and without hydrodynamics have been made (Maccio et al, 2006; Dolag et al, 2008; Saro et al, 2008; Simha et al, 2009; Jiang, Jing & Lin, 2010; Knebe et al, 2010; Schewtschenko & Maccio, 2011). In some of these comparsions a small fraction of radial orbits change (which are themselves a small fraction of subhalo orbits). Direct application to the results here is not straightforward as the dark matter subhalo finder used here is different than the ones for which the comparisons have been made.
Simulations and mocks are described in §2, in §3 statistical properties of the galaxy subgroups are given, §4 gives the relation of five mock observational mass measurements to properties of galaxy subgroups and to each other, §5 describes the results of applying the substructure Dressler-Shectman test to these clusters, and §6 summarizes.
2 Simulations
A particle, side periodic N-body simulation box is used, provided by Martin White by running his TreePM (White, 2002) code. The cosmological parameters are taken to be , , , and , in accord with a large number of cosmological observations. The simulation has outputs at 45 times equally spaced in from to . Halos are found using friends-of-friends (FoF) (Davis et al., 1985) with a linking length of times the mean interparticle spacing. Halo masses given below are FoF masses. Our interest will be in the 243 clusters in the box, i.e. halos with , at . (This redshift is used because some of the mock observations described below rely on models which were trained on observational data at this redshift.)
These simulation data were also used in WCS, which can be consulted for details of implementations, mock observations, and tests beyond those given below. Briefly, galaxies are identified with subhalos and the two words will be used interchangeably hereon. The subhalos are found via the FoF6d algorithm of Diemand, Kuhlen & Madau (2006) (the specific implementation of their algorithm is described in the appendix of WCS). Subhalo infall masses can be used to infer galaxy luminosities (e.g. Conroy, Wechsler & Kravtsov (2006)). Here is chosen, which corresponds to a minimum luminosity of (at this is -18.5 in band (Blanton et al., 2003) or stellar mass (Moster et al., 2010)). No luminosity-infall mass scatter is included (some estimates are in e.g. van den Bosch et al (2007)). In some cases as noted below, is used as a minimum cut instead. This method of luminosity assignments for subhalos gives agreement with observations for galaxy clustering, the cluster galaxy luminosity function, cluster richnesses and the radial cluster galaxy profile (see WCS). To find galaxy histories, tracking is as described in Wetzel, Cohn & White (2009); WCS ; Wetzel & White (2010).
By augmenting the dark matter simulation, WCS measured mock observational masses for these clusters via several methods. The relationship between the observational masses and the simulated cluster masses, and the form of the scatter, are important for understanding the wealth of cluster survey data currently in hand and arriving soon (see, e.g. the reviews cited above). Five mass measurement methods from WCS are used here. Two are richnesses. The first is the Koester et al. (2007) MaxBCG algorithm based upon colors444MaxBCG is one of many algorithms based on a red sequence finder (Gladders & Yee, 2000, 2005). Color assignments are estimated with prescription of Skibba & Sheth (2009), combined with redshift evolution of Conroy, Gunn & White (2009); Conroy, White, & Gunn (2010); Conroy, & Gunn (2010). Galaxies are taken to be “red” if they have within 0.05 of the peak of the red galaxy distribution specified by Skibba & Sheth (2009), for their observed , again see WCS for more detail.. The second richness estimator uses spectroscopy and assigns cluster membership via the criteria of Yang et al (2007)). The third mass measurement uses Sunyaev-Zel’dovich (SZ) flux or Compton decrement. Flux is assigned by using halo mass for temperature and taking the dark matter particle density proportional to the gas density. The flux is then measured within an annulus of radius , the radius within which the average mass is greater than or equal to 180 times background density. Tests of this approximation are given in White, Hernquist & Springel (2002). Weak lensing masses are found by using a cluster lens profile of SIS or NFW (Navarro, Frenk and White, 1997) form and then fitting for a velocity dispersion and then mass. The velocity dispersion masses rely upon phase space information to reject outliers and include a measured harmonic radius in the mass calculation, based on methods of van Haarlem et al. (1997); den Hartog & Katgert (1996); Katgert et al. (1996); Biviano et al. (2006); Wojtak et al (2007, 2009).555We will not use the velocity dispersions based upon 3 clipping, presented in WCS, as these were less well correlated with the FoF cluster mass. We use the WCS measurements corresponding to radius when a radius needs to be specified. WCS measured each individual cluster’s mass along 96 different lines of sight. This ensemble of cluster mass measurements will be used here as well, and as in that analysis, lines of sight where a more massive cluster has its center within are removed. In addition, for the work here, lines of sight where either richness was were also discarded.
3 Persistence of Galaxy Subgroups
The inhomogeneities in cluster galaxy distributions are in part historical, as larger halos are built up from the infall of smaller halos. When halos fall into larger halos, they become subhalos themselves, with their central and satellite galaxies all now becoming satellites within the new larger halo. To study these galaxy subgroups, for every cluster galaxy666Only true cluster galaxies are included in this section, interlopers are considered in §5 and §6 for observational mass estimates and substructure estimates. its infall group, infall time, infall group richness (above the luminosity cut) and infall group mass are identified. Each infall halo containing more than one galaxy results in a separate galaxy subgroup.
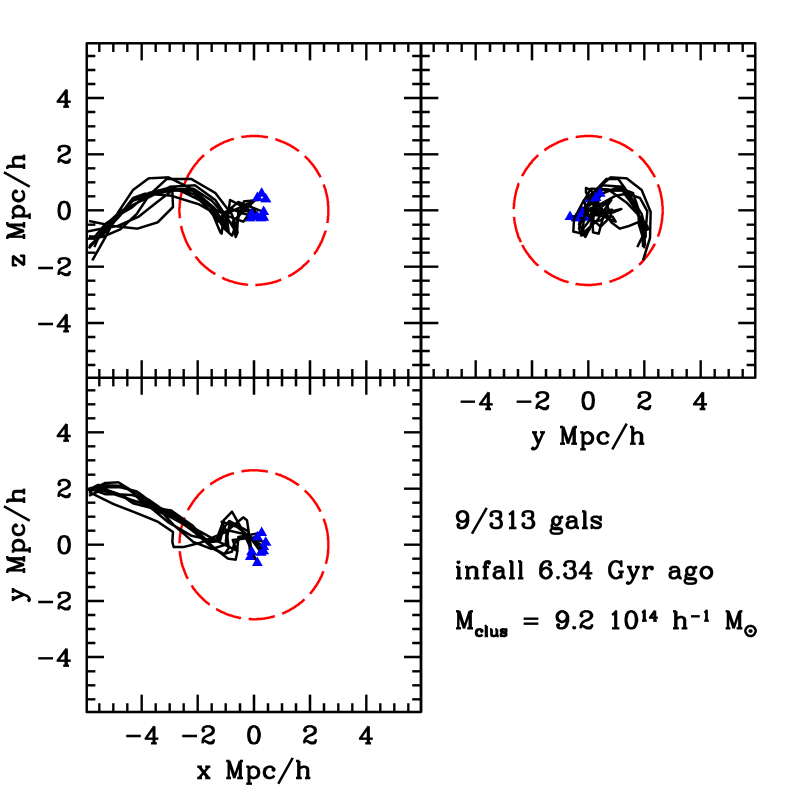
An example of a 9 galaxy subgroup is shown in Fig. 1, along with the tracks of these galaxies since their host halo fell into the cluster 6.3 Gyr earlier (i.e. all the tracks are tracks of the subgroup members within the cluster itself). At infall these galaxies were in a halo with 12 galaxies. Triangles mark the final galaxy positions at . It can be seen that the galaxies have been staying together throughout. The dashed circle is of the host cluster at , centered at the cluster center. The host cluster has 313 galaxies and mass 9.2 .
A large fraction of galaxies within clusters are in these subgroups. At our redshift of interest, , 40% of the cluster galaxies above have at least one associated companion (WCS, ). (As mentioned earlier, these subgroup galaxies presumably correspond in some way to the sub-subhalos mentioned earlier (Weller, Ostriker & Bode, 2005; Shaw et al, 2007; Springel et al, 2008; Giocoli et al, 2009; Li & Mo, 2009; Yang, Mo & van den Bosch, 2008; Giocoli et al, 2010).) Not all the galaxies which are not in subgroups fell in alone: of the galaxies which have no companion in the clusters at , 1/5 fell in with companions which have disappeared since infall. Some of the subgroup galaxies ( of cluster galaxies) were preprocessed in groups, i.e. fell in from halos with . The fraction of preprocessed cluster galaxies is similar to earlier measurements (Berrier et al, 2006; McGee et al, 2009) (the simulated galaxy samples are not identical, so exact agreement is not expected). As in those papers, a larger fraction of the more massive galaxies were processed in group environments. The importance of the group environment for galaxy formation has been stressed in these papers and in e.g. Zabludoff et al (1996); Zabludoff (2007), see also Zabludoff & Mulchaey (1998, 2000); Li, Yee & Ellingson (2009).
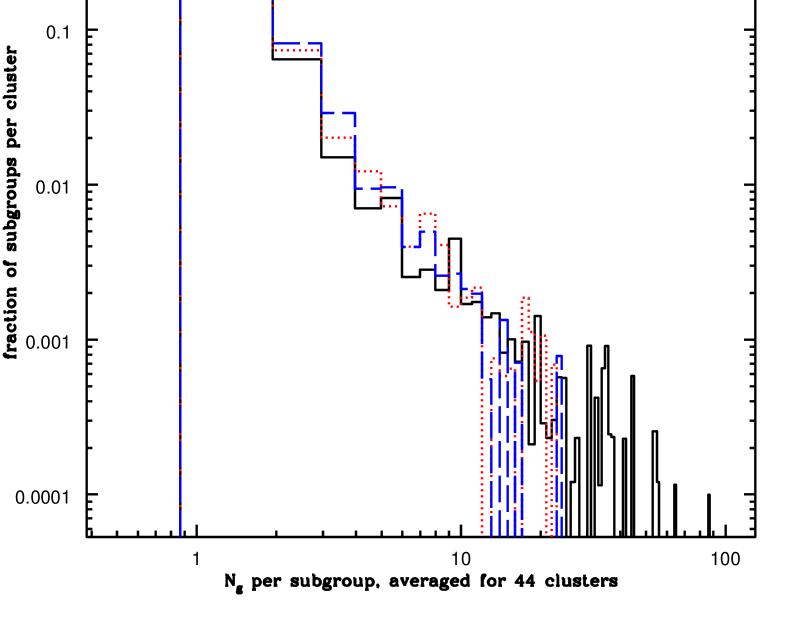
The distribution of subgroup richness per cluster (i.e. average fraction of subgroups with given richnesses) is shown in Fig. 2 for three different mass regimes (44 clusters in each). It appears to have a self-similar distribution, although there is a sharper cutoff at high richness for the lower mass clusters. (This is at least in part likely to be a resolution effect, as the maximum number of galaxies in a subgroup is limited by the total number of galaxies in the cluster, which is smaller for the lower mass clusters.) There is likely some way to connect this subgroup distribution to the infall halo mass distribution, such as measured in De Lucia et al (2004); Gao et al. (2004); Taylor & Babul (2005); Giocoli et al (2009); Gao et al (2011), as the infall group richnesses are related in infall masses (see also Shaw et al (2007) which compares instantaneous sub-subhalo masses).
The richness distribution of the largest subgroup in each cluster is shown in Fig. 3. Although the largest galaxy subgroup for many clusters has galaxies, much larger subgroups do occur.

The largest subgroup in our sample has 86 galaxies, and is in the second largest cluster (). This subgroup had 107 galaxies and host halo mass upon infall 2.4 Gyr ago. Dividing largest subgroup richness by host cluster richness, one sees that the largest galaxy subgroup has on average about 20% of the richness of its host cluster, but that there is a wide scatter (Fig. 3, bottom). The ratio of subgroup richness to cluster richness might be expected to be relevant because more massive halos tend to form from mergers of more massive progenitors, and richness is roughly proportional to mass. (For reference, a cluster of mass has richness of on average.) The particular richness fraction of the largest galaxy subgroup is not only determined by the infall mass of the cluster progenitor, but also the time since infall (i.e. the rate of disappearance of the subgroup galaxies and the growth of the cluster richness since infall). Similarly, the time since a recent major merger is correlated with the size of the largest halo subgroup. (Two standard criteria for a major merger are that the smaller to larger mass is 1:3 or larger or 1:10 or larger, both were considered here.) That is, the larger the subgroup the more recent a major merger. The strongest correlation is with the fraction of the cluster richness due to the halo subgroup and the time of most recent 1:3 merger. (A related correlation was found by Espino-Briones, Plionis & Ragone-Figueroa (2007); Ragone-Figueroa & Plionis (2007): they found that measured cluster substructure increased for clusters with recent mergers.) The median subgroup richness fraction (of the host cluster’s richness) is about 1/3 for clusters with a 1:3 merger in the last time step (as required by the major merger definition), while for clusters with a 1:3 merger 10 Gyr ago, the richness fraction is closer to 1/10. This is not surprising as after the major merger, the cluster will grow in richness, while the subgroup will decrease.
Instead of the largest subgroup per cluster, one can consider all “large” (defined to have galaxies, chosen for convenience777At , richness 8 corresponds roughly to a halo with , but of course the subgroups are remnants of larger galaxy subgroups at infall. ) galaxy subgroups. Their frequency per cluster is shown at the top of Fig. 4: 118/243 clusters have no large subgroup, but 38 clusters have more than one large subgroup, and three clusters have 5 large subgroups. Almost all (42 of the 44) clusters above contain at least one large subgroup. For lower mass host halos, large subgroups are more rare (e.g. occurring only in 1/4 of the 725 halos with mass ), when they occur they are a larger fraction of the halo richness.
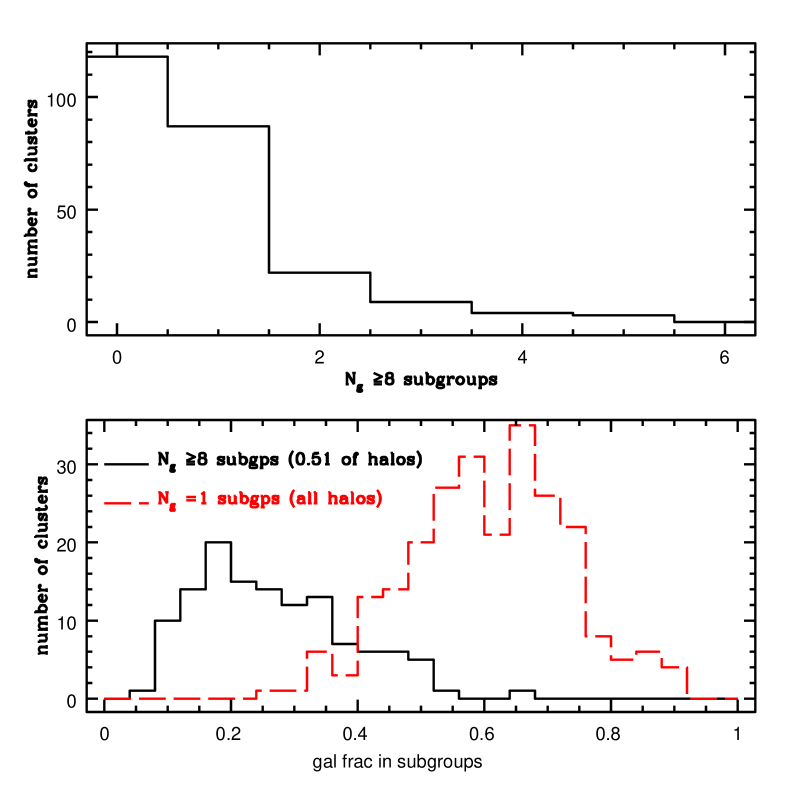
Shown also in Fig. 4, bottom, is the fraction of cluster galaxy richness in large subgroups: the solid line is richness fraction in large subgroups for the of clusters which contain at least one large subgroup (peaked around 15-20% but with a long tail to large fractions). For comparison, the richness fraction in all clusters due to all galaxies not in subgroups is shown as well. The latter is 60% on average, as mentioned above, but has a wide spread.
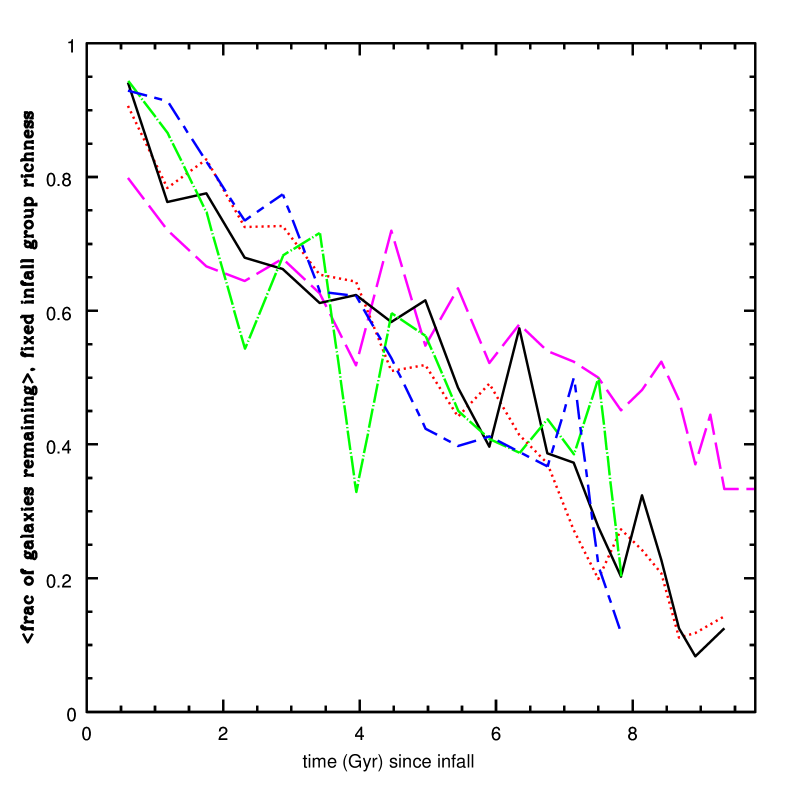
These subgroups are remnants of larger subgroups of galaxies upon infall. Some subgroups fell in long ago: over half of the 189 large subgroups fell in more than 2 Gyrs earlier. The subgroups which have fallen in more recently tend to have a larger surviving fraction of galaxies. For example, the surviving fraction of galaxies per current large subgroup has a median value of 94% for the 36 (currently) large subgroups whose halos fell in 0.6 Gyr ago, dropping to 50% for those 26 falling in 4.9 or more Gyr ago. Considering instead the initial richness of infalling groups, the remaining fraction of galaxies (if nonzero) is shown for subgroups which have 3, 7-10, 11-14, 15-20, and infall galaxies, as a function of infall time, in Fig. 5. Within the noise the change in galaxy fraction looks similar for different initial galaxy richnesses (for subgroups starting with only 3 galaxies, the fraction is bounded below by 1/3).
Because of this galaxy attrition within subgroups, the satellite with the largest infall mass (i.e. formerly the central galaxy of the largest infalling halo) is not always in the largest subgroup. A smaller halo might have a larger remaining galaxy fraction. For 70% of the simulation clusters, the largest subgroup does have the satellite with the largest . Another 5% of the clusters have the satellite with largest infall mass in a large subgroup (i.e. galaxies) but not the largest subgroup. When using subhalo abundance matching (see, e.g. Conroy, Wechsler & Kravtsov (2006)), the galaxy with the largest infall mass will be the brightest satellite (up to scatter). However, given the above, even in the case of no-scatter (i.e. oversimplified) halo abundance matching, the brightest satellite will not be a useful way to identify the largest subgroup.
The spatial and velocity distributions of large subgroups differ on average from those of their host clusters. As expected from their lower richnesses and their membership in a larger cluster, subgroup sizes are generally smaller: the average distance of subgroup members from the subgroup center is about half that of all cluster galaxies from the host cluster’s center, albeit with scatter.888If the subgroup radii are rescaled by of their infall halos, and similarly for the full cluster and its mass, the ratio of subgroup to cluster radii becomes very broadly centered around unity, that is, further suggesting that the smaller size of the galaxy subgroups is partially due to their smaller size at infall. I thank M. George for suggesting this and the rescaling below. (However, one of the 189 large subgroups has an average radius larger than that of its host cluster. The subgroup center is taken to be the average position, as not all subgroups have the infall central galaxy remaining.) The average distance of subgroup galaxies from their center tends to be larger for older subgroups. One possibility is that galaxies close to the subgroup center have more time to merge with the subgroup center and disappear, while galaxies further away have more time to be pulled away from the center by the host cluster tidal fields.
In terms of density, modeling the cluster and the subgroups as ellipsoids and then calculating density as the number of galaxies divided by respective ellipsoidal volumes, the large galaxy subgroups have a median (average) density times larger than clusters they live in. The broad distribution is shown at left in Fig. 6–almost 1/3 of the large subgroups have densities which are more than double that of their host cluster. In terms of shape, the median value of the (minimum axis/maximum axis) for large subgroups divided by that for their host cluster is slightly below 1 (), but there is a tail out to values. That is, the majority of subgroups () tend to be less round than their host clusters. Subgroups which fell in earlier tend to be more elongated compared to those which fell in later (the average short/long axis ratio for subgroups falling in at the last time step is 0.4, while for subgroups which fell in over 6 Gyr ago, the average short/long axis ratio is ). It might be expected that this elongation is due to tidal forces within the larger cluster stretching out the subgroup after its infall. However, there isn’t a strong signal for alignment of the long axis of the large subgroups with their direction of motion within the cluster.
In terms of velocities, the subgroups tend to have smaller (70%) velocity dispersions (relative to the average subgroup velocity) compared to their host cluster’s counterpart, i.e. they are slightly colder.999Scaling the subgroup velocities by their infall halo and similarly for the cluster hosts actually gives a median velocity dispersion which is higher for the subgroups, that is, the subgroups are colder than their hosts but hotter than isolated halos of similar mass. The ratio of velocity dispersions of large subgroups to those of their host cluster is shown in Fig. 6. The subgroups which fell in earlier tend to have larger velocity dispersions, both in raw numbers and (less strongly) relative to that of their host halo.

The radial distribution of the centers of the largest subgroup per cluster (rescaled by the rms distance of the cluster galaxies from the cluster center) lies along an NFW profile, just as the satellites in the simulation do (WCS, ) and as has been seen observationally for cluster satellites in stacked profiles (Lin, Mohr & Stanford, 2004). It seems the outskirts of the stacked subgroup position profile are fit better by a lower concentration (i.e. 3), but the statistics are very noisy.

Clusters have several preferred directions, which often are related: halos and thus their galaxies tend to fall in along filaments. Filaments connecting clusters (i.e. usually the largest filament in the cluster) tend to lie along the cluster major axis, and the central halo is often aligned with one or the other or both (references for cluster alignments and formation along filaments include van de Weygaert & Bertschinger (1996); Splinter et al. (1997); Colberg et al (1999); Chambers, Melott & Miller (2000); Onuora & Thomas (2000); Faltenbacher et al. (2002); van de Weygaert (2002); Hopkins, Bahcall & Bode (2004); Bailin & Steinmetz (2005); Faltenbacher et al. (2005); Kasun & Evrard (2005); Lee & Evrard (2007); Lee et al. (2008); Pereira, Bryan & Gill (2008); Costa-Duarte, Sodre, & Durret (2010)). Alignments of cluster galaxy positions with each of these (and with a strength sometimes dependent upon color or morphology) has been seen in observations (e.g. Knebe et al (2004); Brainerd (2005); Yang et al (2006); Azzaro et al (2007); Bailin et al (2008); Steffen & Valenzuela (2008); Wang et al (2008); Siverd, Ryden & Gaudi (2010); Wang et al (2010); Deason et al (2011); Libeskind et al (2011); Nierenberg et al (2011)) and simulations (e.g. Colberg et al (1999); Benson (2005); Kasun & Evrard (2005); Lee, Kang & Jing (2005); Zentner et al (2005); Libeskind et al (2005); Agustsson & Brainerd (2006); Zentner et al (2005); Kang et al (2007); Kuhlen, Diemand & Madau (2007); Libeskind et al (2006); Sales et al (2007); Faltenbacher et al (2008); Paz et al (2011)), and has been characterized analytically as well (see, e.g. Pennarrubia & Benson (2005); Lee & Kang (2006)). As the largest subgroups tend to originate from massive halos, they might be expected to lie along the long axis of the cluster, i.e. the cluster’s longest ellipsoidal axis. This is borne out in the simulated clusters: large subgroups and the largest subgroup per cluster both tend to lie along the long axis of the cluster and to be moving (i.e. have average velocity) along this axis (Fig. 7). The clusters with longer large axes tend to have larger subgroups, and subgroups further away from the center, however both of these may be due to correlations between cluster mass and subgroup richness.
Concentration is often strongly correlated with cluster history and other properties (e.g. see Jeeson-Daniel et al (2011); Skibba & Maccio (2011)). In our sample, the cluster concentrations and deviations from the average concentration for a given mass were correlated with several quantities (the size of the largest subgroup, the deviation of the size of the largest subgroup from the average for that mass, the fractional richness in large subgroups, and the deviation of the fractional subgroup richness in large subgroups from the average). However, these correlations were weak, 10%-20%. They were in the expected sense, that larger subgroups tended to be in clusters with smaller concentrations.
To summarize, the majority of galaxies in clusters have no accompanying galaxies remaining from their infall host halo, but galaxies in galaxy subgroups still contribute a significant fraction of cluster richness. Galaxies in large subgroups ( galaxies) tend to have smaller relative velocities and higher relative densities than their hosts, even if their infall was several Gyr earlier.
4 Subgroups and Masses
Observationally, a cluster’s galaxy population is often used to find the cluster’s mass, for instance via richness and velocity dispersions. The large subgroups described in the previous section are deviations from an idealized cluster of virialized galaxies within an isolated spherical dark matter potential. As such, they might affect the use of galaxies as tracers of cluster mass. In this section the correlation between scatter in cluster mass measurements is compared to properties of the large galaxy subgroups, when present.
In WCS, the dark matter simulations were augmented as described in §2, and mass measurements were made along 96 different lines of sight for every cluster, using 6 different techniques, for massive clusters (). In that paper, some correlation between mass scatter and line of sight substructure (via the Dressler-Shechtman (Dressler & Shectman, 1988) test, see below) or large or small halos contributing galaxies outside the cluster was found. In the same simulations Noh & Cohn (2011) often found an increase in observable mass scatter when viewing along the plane containing the most (filamentary) mass in a 10 radius sphere around the cluster, or along the long axis of the cluster. Substructure and observational mass scatter have been considered in other contexts, e.g., in X-ray measurements, Jeltema et al (2008) found mass scatter correlations with X-ray substructure.
It should be noted that since these mass measurements are only within the 250 box, scatter due to the full line of sight is underestimated. Both weak lensing and Compton decrement measurements can easily have contributions to scatter from well outside these scales. This additional uncorrelated scatter would decrease the correlation of the observed scatter with intrinsic cluster quantities studied here.
Taking the largest subgroup of associated galaxies for each cluster, we calculated the projection of its position on viewing direction for 96 directions101010Again, lines of sight with a more massive cluster within or with either richness are discarded.. For many of the clusters, observed masses increased when measurements of mass were along the largest subgroup’s axis, i.e. looking along the direction where the subgroup is almost directly behind or in front of the cluster center.
One example in shown in Fig. 8. This shows the fractional mass scatter for a cluster of mass and 66 galaxies, for five mass measurements. Its largest subgroup fell in 0.61 Gyr ago and has 12 galaxies. Most of the observational mass estimates for this cluster increase as the line of sight tends to the axis collinear with the largest subgroup (note this is also related to the long axis of the cluster, as in Fig. 7, and tends to be in the plane containing most of the filamentary mass feeding the cluster). Correlation coefficients are calculated using all points. The correlation of scatter in mass is largest for the two measures of richness and velocity dispersions, as might be expected. (Again, the large SZ correlation is likely overestimated, as is the correlation for weak lensing, because the small box size does not include uncorrelated scatter from larger scales where lensing and SZ are also sensitive). Also shown at lower right is a map of the cluster galaxies with the largest subgroup galaxy positions noted (centered 2.2 from the central cluster galaxy). Several of the clusters with recent mergers still have the subgroups on the “edge” of the cluster, however, the dark matter density in the region between these galaxies and the rest of the cluster galaxies is all above the threshold set by the linking length (roughly 100).
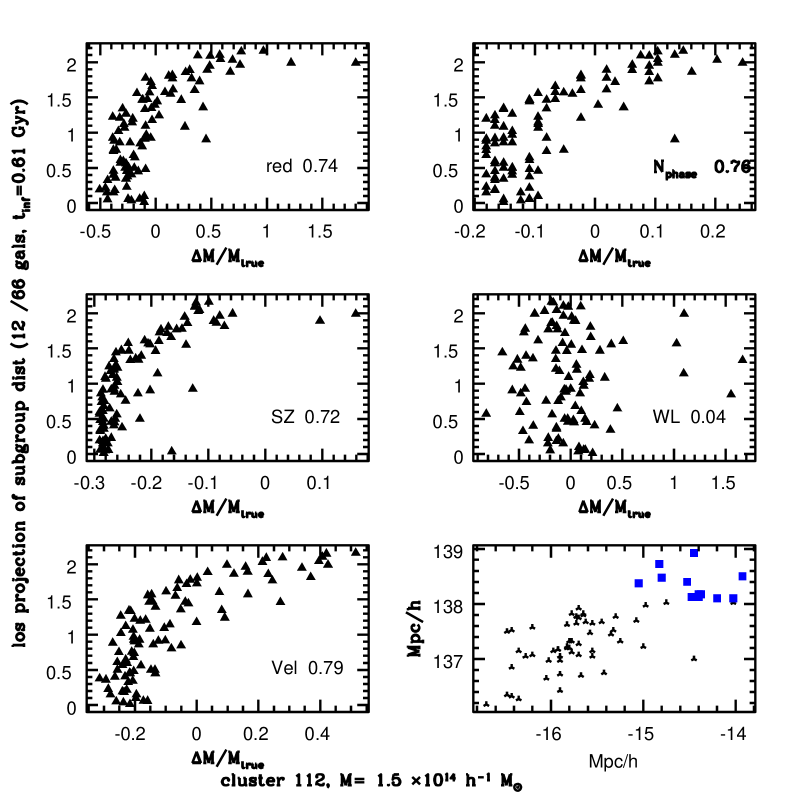
The range of line of sight mass scatter varies by cluster and mass measurement. On a cluster by cluster basis, the 65th-35th percentiles of mass scatter (i.e. the 65th - 35th percentiles of , roughly the range of middle 1/3 of mass scatter) on average is 20%, 10%, 5%, 30% and 15% for MaxBCG richness, phase richness, SZ mass, velocity dispersion mass and weak lensing mass respectively.111111This scatter is due only to changing the cluster line of sight. For all clusters, rather than one cluster along different lines of sight, this width approximately doubles, except that for velocity dispersions, which only increases slightly. As SZ scatter is often closer to 20% in larger boxes, e.g., Cohn & White (2009), its local scatter measured here is expected to double when uncorrelated structures are included. The maximum to minimum mass scatter per cluster due to line of sight is on average about 10 times this (for SZ it is ). The width of the 65%-35% mass scatter per cluster increases with fraction of richness in the cluster’s largest subgroup for SZ and phase richness, and decreases for weak lensing. The maximum to minimum widths are correlated with the fraction of cluster richness in the largest subgroup when the subgroups are at least 20% of the cluster’s richness (69/243 of the clusters).
For these five different observable masses, one can again measure the distribution of correlations between observational mass scatter and projection on the direction of the largest subgroup of the line of sight. These correlation coefficients are shown in Fig. 9.

Although not all clusters had correlations between the line of sight to the largest subgroup and mass scatter, several did. Richness and velocity dispersions tend to be enhanced when the line of sight tended to the direction of the largest subgroup in the cluster, as in the example in Fig. 8. These trends can be compared to the correlations of mass scatter with the long axis of the cluster and with measurements through or within the filamentary plane around the cluster, studied in WCS ; Noh & Cohn (2011). Correlations of mass scatter with respect to the direction of the largest subgroup are comparable but smaller for the two richness measurements and much smaller for SZ and weak lensing. However, the average correlation between mass scatter and direction of observation relative to the largest subgroup is much larger for velocity dispersions than the correlations found using other cluster preferred axes.
Combining all the clusters, the correlation between mass scatter and direction to largest subgroup, or largest subgroup if one is present with galaxies, is much weaker. This is presumably due to the tails into negative correlations which are seen for some clusters in Fig. 9. One possible cause for weak or opposite sign correlations between mass scatter and the line of sight for measurement versus direction to largest subgroup is the presence of more than one large subgroup in many clusters (e.g. Fig. 4).
Another quantity was explored as well, the correlation of scatter with projection onto the position of the satellite galaxy with largest . This galaxy would be, in the absence of luminosity-infall mass scatter, the brightest non-central galaxy. The relation between the direction to this galaxy and the line of sight of mass measurement was not as strongly correlated with the mass scatter (i.e. the distribution of correlation coefficients for all the clusters tended to be centered on zero). 121212Many of the mass scatters are correlated with each other, due to their origin in properties in and around the cluster, and have been studied in e.g. Nord et al. (2008); Cohn & White (2009); Meneghetti et al. (2010); Stanek et al. (2010); WCS . As discussed in Nord et al. (2008); Rykoff et al (2008); Stanek et al. (2010); WCS , correlated mass scatter can not only cause underestimation of mass errors for single objects, but can also introduce biases when measurements are stacked.
To summarize, mass scatters in cluster measurements, for several different methods, are correlated with relative directions between the line of sight and the axis pointing towards the largest cluster galaxy subgroup, similar to correlations found earlier between mass scatter and directions of observation relative to the long axis of the cluster and to the filamentary plane around the cluster. Velocity dispersion mass scatter is more correlated with the direction to the largest galaxy subgroup than with the long axis or filament plane directions.
5 Finding subgroups observationally
As seen in earlier sections, large galaxy subgroups are frequent in massive clusters, and the relation of their position relative to the line of sight often correlates with mass scatter, particularly velocity dispersions. The ability to detect these subgroups of associated galaxies thus may be useful both for their own interest and for studies aimed at galaxy cluster masses. The presence or absence of galaxy substructures (galaxies close in space with smaller relative velocities) is also sometimes used to estimate whether a cluster is relaxed or not, for example to allow the assumption of hydrostatic equilibrium for X-ray analyses. Several techniques exist for finding galaxy substructure within clusters (e.g. Dressler & Shectman (1988); Pinkney et al. (1996); Knebe & Mueller (2000); Gurzadyan & Mazure (2001); Hou et al. (2009) and those noted earlier). These have been used in several observational and numerical studies including Crone, Evrard & Richstone (1996); Cen (1997); Solanes, Salvador-Sole & Gonzalez-Casado (1999); Knebe & Mueller (2000); Oegerle & Hill (2001); Burgett et al (2004); Boschin et al (2006); Hwang & Lee (2007); Ramella et al (2007); Girardi et al (2008); Milvang-Jensen et al. (2008); Aguerri & Sanchez-Janssen (2010); Einasto et al (2010); WCS ; Barrena et al (2011).
Here we apply the classic test by Dressler & Shectman (1988)131313Pinkney et al. (1996) find that DS is the most sensitive to substructure, but that it also has the highest detection of non-substructures due to elongation and velocity dispersion gradients. to see how its substructure detection criterion relates to the presence of large subgroups. The study here differs from previous work by focussing on a specific sort of substructure present in the clusters, substructure in galaxies coming from the same infall group. It also differs from some previous works as it uses subhalos rather than dark matter particles as galaxies in applying the test, and thus can apply interloper methods to identify cluster galaxies in closer analogy to observations. (That is, just as in WCS but not in most previous work, whole subhalos, with dark matter central position and mean velocity, are used as galaxies for the tests, rather than random dark matter particles.)
The original DS test checked for collections of galaxies whose relative velocities are less likely than random within the cluster (“random” is calculated by shuffling the velocities of the galaxies in the cluster). One calculates, centering on each galaxy,
| (1) |
In the rest frame of the cluster, and are the mean velocity and velocity dispersion of all the cluster galaxies, while the local counterparts include only the nearest galaxies to the chosen galaxy, in the plane of the sky. The sum over all cluster galaxies is used to estimate whether substructure is present. In the original formulation, is compared with random velocity shufflings in the same cluster. A low fraction of shuffled directions giving larger than the unshuffled () is considered a substructure detection. Pinkney et al. (1996) take instead as the square root of the total number of cluster galaxies and Knebe & Mueller (2000) take . The latter found that was also a useful criterion to detect substructure, using dark matter particles, other studies have found that a mass dependent threshold in is more accurate (Ragone-Figueroa & Plionis, 2007). In addition to choosing the number of nearest neighbors, , it is also necessary to specify a luminosity threshold when applying the test, and to select which galaxies are in the cluster.
For application to our mock catalogues, a priori knowledge of true cluster galaxies cannot be assumed if observations are to be mimicked. Cluster membership for galaxies must instead be determined using observational techniques. The original DS test used clipping, but more sophisticated methods exist for identifying cluster members (for example, van Haarlem et al. (1997); den Hartog & Katgert (1996); Biviano et al. (2006); Wojtak et al (2007, 2009)) which take into account both the line of sight velocities and the distance from the estimated cluster center. We use the variant of these methods as outlined in WCS to identify cluster galaxies.
We considered cuts corresponding to , and . This last was aimed at getting at the natural subgroup size implied by Fig. 3.
The presence of cluster substructure seemed to depend strongly upon viewing angle. Although for some clusters substructure was detected more often when the line of sight was perpendicular to the largest subgroup, for other clusters no correlation was apparent between the direction to the largest subgroup and the amount of substructure found. Taking in principle the cleanest cases, the 87 clusters with only one 1 large subgroup, substructure tended to be more often detected if the subgroup was perpendicular to the line of sight. In this case the subgroup was on the ’side’ of the cluster in the plane of the sky. But even here, of the clusters had substructure detection increasing as the axis to the substructure became more closely aligned to the line of sight.
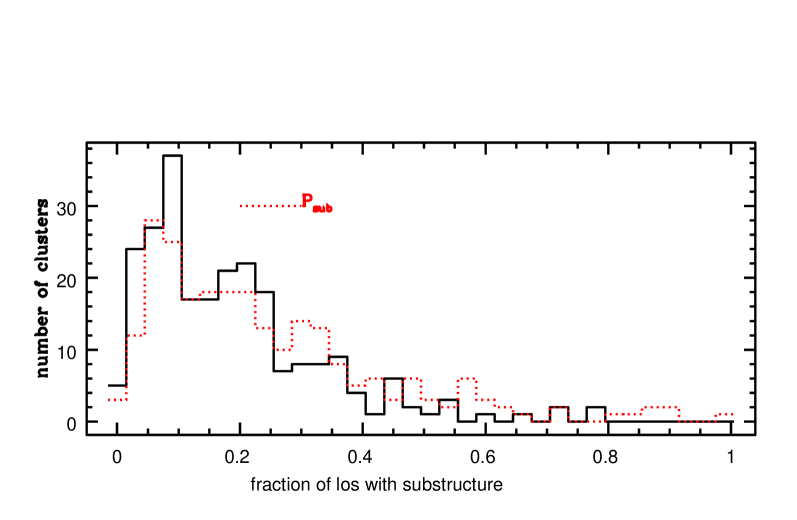
Rather than considering substructure detection along any particular line of sight, one can instead consider the number of lines of sight with substructure, as a property of a given cluster. Fig. 10 shows the distribution, for all the clusters, of the fraction of lines of sight where substructure is found, by both measures, using , and minimum infall mass (to roughly correspond to ). The dotted line corresponds to the fraction of lines of sight which meet the substructure detection requirement of . The numbers of lines of sight with substructure with the two measures tended to be correlated with each other. Hardly any clusters had no substructure along any line of sight. Many clusters had 10% of their lines of sight showing substructure, and a handful had over half of their lines of sight showing substructure.
The results depended upon the parameters and substructure criterion. Substructure detection using the requirement of occurred more often than detection using the requirement (and almost always detected substructure when the latter test did). As the number of nearest neighbor galaxies used in the finder increased (i.e. larger substructures were sought), substructure was found along fewer lines of sight. Conversely, as the luminosity cut was lowered to include more galaxies, substructure was found more often. Lines of sight with substructure were not in 1-1 correspondence for different luminosity cuts, but the fraction of lines of sight with substructure was correlated cluster by cluster as the luminosity cut changed.
The number of lines of sight with substructure per cluster was correlated with the number of galaxies in the largest substructure, and the number of galaxies in subgroups with galaxies. (This is likely also related to the increase of substructure found for recent mergers noted in Espino-Briones, Plionis & Ragone-Figueroa (2007); Ragone-Figueroa & Plionis (2007) and mentioned earlier.) More substructure was found in higher mass clusters as well. To try to minimize the mass dependence, clusters were divided into 6 mass bins and substructure lines of sight were counted for both the top and bottom quartiles of galaxies in large subgroups. In these bins the clusters with more galaxies in large subgroups tended to have more lines of sight with substructure (but not always, and the results varied with substructure test criteria). If only subgroups which had fallen in recently (i.e. within 0.6 Gyr) were considered, then substructure was more often detected for clusters whose largest subgroup was farthest from the cluster center in three dimensions (with a stronger correlation with increasing in the substructure test).
In summary, the Dressler-Shectman test did tend to detect substructure more often in clusters with larger subgroups, but the results varied strongly between lines of sight. The increased frequency of sightlines which detect subgroups as the subgroup size increases is encouraging. However, the lack of substructure as defined by this test does not necessarily mean the substructure is absent. This suggests using caution when taking the results of the DS test to measure whether substructure is present or whether the cluster is in hydrodynamic equilibrium (e.g., for the application of X-ray mass estimates).
6 Summary
This note considered subgroups in clusters, i.e. galaxies which shared the same halo before they fell into the galaxy cluster, in a relatively large volume and high resolution N-body simulation. The cluster sample had 243 clusters at . Properties of the distribution of subgroup populations, and how their orientations relative to line of sight of observation affected a variety of cluster mass measurements were considered, along with one test of cluster substructure.
A significant fraction of cluster galaxies are in these subgroups, with larger subgroups more likely in more massive (i.e. richer) clusters. In roughly half of the simulation clusters with , at least one large ( galaxies) subgroup is present, and 15% of the clusters have more than one large subgroup. The large subgroups tend to have higher galaxy densities and smaller rms velocities than the full sample of galaxies in their host cluster. These correlations often remain many Gyr after infall. The largest subgroups tend to be found along the cluster long axis, with average velocities tending to be directed along this axis as well. Observationally, cluster mass measurements on average increase when the largest cluster subgroup lies along the line of sight, cluster by cluster, for two richness mass measurements and especially for velocity dispersions. The larger the cluster subgroup, the more likely substructure will be detected by the Dressler-Shectman test, but the likelihood of detection also depends upon the line of sight direction, the number of nearest neighbors used in the test, and the luminosity cut for the galaxies included.
It would be interesting to see how these subgroups evolve compared to the gas of their original infall halos, and to understand what other galaxy properties (besides mergers and those discussed in Knebe, Gill & Gibson (2004); Knebe et al (2006); McIntosh et al (2008); Angulo et al (2009); Li & Mo (2009); Simha et al (2009); Wetzel, Cohn & White (2009); Klimentowski et al (2010)) depend upon subgroup membership for these cluster galaxies.
Acknowledgements
JDC thanks M. George, S. Ho, A. Leauthaud and Y. Noh for discussions, and especially thanks M. White for numerous discussions, and for use of his simulation and mock catalogue data. She thanks M. George, A. Knebe and M. White for suggestions on the draft as well. Last, but not least, she also thanks the anonymous referee for several very useful suggestions and comments. The simulations used in this paper were performed at the National Energy Research Scientific Computing Center and the Laboratory Research Computing project at Lawrence Berkeley National Laboratory, analysis was also done on the computer funded by the 2009 NSF ATI:Acquisition of a Beowulf Cluster for Computational Astrophysics, Cosmology and Planetary Science at UC Berkeley.
References
- Aguerri & Sanchez-Janssen (2010) Aguerri, J.A.L., Sanchez-Janssen, R., 2010, A&A, 521, 28
- Agustsson & Brainerd (2006) Agustsson, I., Brainerd, T.G., 2006, ApJ, 650, 550
- Allen, Evrard & Mantz (2011) Allen, S.,Evrard, A.E., Mantz, A.B., 2011,arXiv:1103.4829, Annual Review of Astronomy & Astrophysics, to appear.
- Angulo et al (2009) Angulo R.E.; Lacey C.G., Baugh C.M., Frenk C.S., 2009, MNRAS, 399, 983
- Azzaro et al (2007) Azzaro, M., Patiri, S.G., Prada, F., Zentner, A.R., 2007, ApJL, 376, 43
- Bailin et al (2008) Bailin, J., Power, C., Norberg, P., Zaritsky, D., Gibson, B.K., 2008, MNRAS, 390, 1133
- Bailin & Steinmetz (2005) Bailin, J., & Steinmetz, M., 2005, ApJ, 627, 647
- Barrena et al (2011) Barrena, R., Girardi, M., Boschin, W., De Grandi, S., Eckert, D., Rossetti, M., 2011, arXiv1103.0679
- Benson (2005) Benson, A.J., 2005, MNRAS, 358, 551
- Berrier et al (2006) Berrier, J.C., Bullock,J.S., Barton, EJ., Guenther, H.D., Zentner, A.R., Wechsler, R.H., 2006, ApJ, 652, 56
- Biviano et al. (2006) Biviano, A., Murante, G., Borgani, S., Diaferio, A., Dolag, K., Girardi, M., 2006, A&A, 456, 23
- Blanton et al. (2003) Blanton M., et al., 2003, ApJ, 592, 819
- Boschin et al (2006) Boschin, W., Girardi, M., Spoalaor, M., Barrena, R., 2006, A&A, 449, 461
- Brainerd (2005) Brainerd, T.G., 2005, ApJL, 628, 101
- Buote (2002) Buote, D. A. 2002, in Merging Processes in Galaxy Clusters, ed. L. Feretti, I.M. Gioia, & G. Giovannini (Dordrecht: Kluwer), 79, astro-ph/0106057
- Burgett et al (2004) Burgett, W.S., et al, 2004, MNRAS, 352, 605
- Cen (1997) Cen, R., 1997, ApJ, 485, 39
- Chambers, Melott & Miller (2000) Chambers, S.W., Melott, A.L., Miller, C.J., 2000, ApJ, 544, 104
- Cohn & White (2009) Cohn, J.D., White, M., 2009, MNRAS, 393, 393
- Colberg et al (1999) Colberg, J.M., White, S.D.M., Jenkins, A., Pearce, F.R., 1999, MNRAS, 308, 593
- Conroy, Gunn & White (2009) Conroy C., Gunn J.E., White M., 2009, ApJ, 699, 486
- Conroy, White, & Gunn (2010) Conroy C., White M., Gunn J.E., 2010, ApJ, 708, 58
- Conroy, & Gunn (2010) Conroy C., Gunn J.E., 2010, ApJ, 712, 833
- Conroy, Wechsler & Kravtsov (2006) Conroy, C., Wechsler, R.H., Kravtsov, A.V., 2006, ApJ, 647, 201
- Costa-Duarte, Sodre, & Durret (2010) Costa-Duarte, M.V., Sodre Jr., L., Durret, F., 2010, MNRAS, 411, 1716
- Crone, Evrard & Richstone (1996) Crone M.M., Evrard A.E., Richstone D.D., 1996, ApJ, 467, 489
- Davis et al. (1985) Davis M., Efstathiou G., Frenk C.S., White S.D.M., 1985, ApJ, 292, 371
- Deason et al (2011) Deason, A. J., McCarthy, I. G., Font, A., Evans, N. W., Frenk, C. S., Belokurov, V., Libeskind, N. I., Crain, R. A., Theuns, T., 2011, 415, 2607
- De Lucia et al (2004) De Lucia, G., Kauffmann, G., Springel, V., White, S.D.M., Lanzoni, B., Stoehr, F., Tormen, G., Yoshida, N., 2004, MNRAS, 348, 333
- den Hartog & Katgert (1996) den Hartog, R., Katgert, P., 1996, MNRAS, 279, 349
- den Hartog (1997) den Hartog, R., 1997, MNRAS, 284,286
- Diemand, Kuhlen & Madau (2006) Diemand J., Kuhlen M., Madau P., 2006, ApJ, 649, 1
- Dolag et al (2008) Dolag, K., Borgani, S., Murante, G., Springel, V., 2008, MNRAS, 399, 497
- Dressler & Shectman (1988) Dressler A., Shectman S.A., 1988, AJ, 95, 985
- Einasto et al (2010) Einasto, M., et al, 2010, A&A, 522, 92
- Espino-Briones, Plionis & Ragone-Figueroa (2007) Espino-Briones, N., Plionis, M., Ragone-Figueroa, C., 2007, ApJL, 666,5
- Faltenbacher et al. (2002) Faltenbacher, A., Gottlöber, S., Kerscher, M., Muller, V., 2002, A & A, 395, 1
- Faltenbacher et al. (2005) Faltenbacher, A., Allgood, B., Gottlöber, S., Yepes, G., & Hoffman, Y., 2005, MNRAS, 362, 1099
- Faltenbacher et al (2008) Faltenbacher, A., Jing, Y. P., Li, C., Mao, S., Mo, H. J., Pasquali, A., van den Bosch, F. C., 2008, ApJ, 675, 146
- Gao et al. (2004) Gao L., de Lucia G., White S.D.M., Jenkins A., 2004, MNRAS, 352, L1
- Gao et al (2011) Gao, L., Frenk, C.S., Boylan-Kolchin, M., Jenkins, A., Springel, V., White,S.D.M., 2011, MNRAS, 410,2309
- Giocoli et al (2009) Giocoli, C., Tormen, G., Sheth, R., van den Bosch, F.C., 2009, MNRAS, 404,502
- Giocoli et al (2010) Giocoli, c., Tormen, G., Sheth, R.K., van den Bosch, F.C., 2010, MNRAS, 404, 502
- Gill et al (2004) Gill, S.P.D., Knebe, A., Gibson, B.K., Dopita, M.A., 2004, MNRAS, 351, 410
- Girardi et al (2008) Girardi, M., Barrena, R., Boschin, W., Ellingson, E., 2008, A&A, 491, 379
- Gladders & Yee (2000) Gladders M., Yee H.K.C., 2000, AJ, 120, 2148
- Gladders & Yee (2005) Gladders M., Yee H.K.C., 2005, ApJS, 157, 1
- Gurzadyan & Mazure (1998) Gurzadyan, V.G., Mazure, A., 1998, MNRAS, 295, 177
- Gurzadyan & Mazure (2001) Gurzadyan, V.G., Mazure, A., 2001,New Ast. 6, 43
- Hennawi et al (2007) Hennawi, J.F., Dalal, N., Bode, P., Ostriker, J.P., 2007, ApJ, 654, 714
- Hopkins, Bahcall & Bode (2004) Hopkins, P.F., Bahcall, N., Bode, N., 2004, ApJ 618, 1
- Hou et al. (2009) Hou A., Parker L., Harris W., Wilman D., 2009, ApJ, 702, 1199
- Hwang & Lee (2007) Hwang, H.S., Lee, M.G., 2007, ApJ, 662, 236
- Jeeson-Daniel et al (2011) Jeeson-Daniel, A., Dalla Vecchia, C., Haas, M.R., Schaye, J., 2011, MNRAS Letters, 415, 69
- Jeltema et al (2008) Jeltema,T.E., Hallman, E.J., Burns, J.O.,Motl, P.M., 2008, ApJ, 681, 167
- Jiang, Jing & Lin (2010) Jiang, C. Y., Jing, Y. P., Lin, W. P., 2010, A&A, 510, A60
- Kang et al (2007) Kang, X., van den Bosch, F.C., Yang, X., Mao, S., Mo, H.J., Li, C., Jing, Y.P., 2007, MNRAS, 378, 1531
- Kasun & Evrard (2005) Kasun S.F., Evrard A.E., 2005, ApJ, 629, 781
- Katgert et al. (1996) Katgert P., Mazure A., Perea J., et al., 1996, A& A, 310, 8
- Klimentowski et al (2010) Klimentowski, J., Lokas, E.W., Knebe, A., Gottlober, S., Martinez-Vaquero, L.A., Yepes, G., Hoffman, Y., 2010, MNRAS, 402, 1899
- Klypin et al (1999) Klypin, A., Gottlober,S., Kravtsov, A.V., Khokhlov, A.M., 1999, ApJ, 516, 530K
- Knebe, Gill & Gibson (2004) Knebe, A., Bill, S.P.D., Gibson, B.K., 2004, Pub. of Astr. Soc. of Australia, 21, 216
- Knebe & Mueller (2000) Knebe, A., Muller, V., 2000, A&A, 354, 761
- Knebe et al (2004) Knebe, A., Gill, S.P.D., Gibson, B.K., Lewis, G.F., Ibata, R.A., Dopita, M.A., 2004, ApJ, 603,7
- Knebe et al (2006) Knebe, A., Power, C., Gill, S.P.D., Gibson, B.K., 2006, MNRAS, 368, 741
- Knebe et al (2010) Knebe, A., Libeskind, N.I., Knollmann, S.R., Yepes, G., Gottlober, S., Hoffman, Y., 2010, MNRAS, 405, 1119
- Koester et al. (2007) Koester B.P., et al., 2007, ApJ, 660, 221
- Kravtsov et al (2009) Kravtsov, A., et al, 2009, arXiv:0903.0388
- Kuhlen, Diemand & Madau (2007) Kuhlen, M., Diemand J., Madau P., 2007, ApJ, 671, 1135
- Lee & Evrard (2007) Lee, J., Evrard, A.E., 2007, ApJ 657, 30
- Lee, Kang & Jing (2005) Lee, J., Kang, X., Jing, Y.P., 2005, ApJL, 629, 5
- Lee & Kang (2006) Lee, J., Kang, X., 2006, ApJ, 637, 561
- Lee et al. (2008) Lee, J., Springel, V., Pen, U.-L., Lemson, G., 2008, MNRAS 389, 1266
- Li & Helmi (2008) Li, Y.-S., Helmi, A., 2008, MNRAS, 385, 1365
- Li & Mo (2009) Li, Y., Mo, H., 2009, arxiv:0908.0301
- Li, Yee & Ellingson (2009) Li, I. H., Yee, H. K. C., Ellingson, E., 2009, ApJ, 698, 83
- Libeskind et al (2005) Libeskind, N.I., Frenk, C.S., Cole, S., Helly, J.C., Jenkins, A., Helly, J.C., Jenkins, A., Navarro, J.F., Power, C., 2005, MNRAS, 363,146
- Libeskind et al (2006) Libeskind, N.I., Cole, S., Frenk, C.S., Okamoto, T., Jenkins, A., 2006, MNRAS, 374,16
- Libeskind et al (2011) Libeskind, N.I., Knebe, A., Hoffman, Y., Gottlober,S., Yepes, G., Steinmetz, M., 2011, MNRAS, 411, 1525
- Lin, Mohr & Stanford (2004) Lin Y.T., Mohr J.J., Stanford S.A., 2004, ApJ, 610, 745
- Maccio et al (2006) Maccio, A.V., Moore, B., Stadel, J., Diemand, J., 2006, MNRAS, 366, 1529
- McGee et al (2009) McGee, S., Balogh, M.L., Bower, R.G., Font, A.S., McCarthy, I.G., 2009, MNRAS, 400, 937
- McIntosh et al (2008) McIntosh, D.H., Guo, Y., Hertzberg, J., Katz, N., Mo, H.J., van den Bosch, F.C. Yang, X., 2008, MNRAS, 388, 1537
- Meneghetti et al. (2010) Meneghetti, M., Fedeli, C., Pace, F., Gottloeber, S., Yepes, G., 2010, arXiv:1003.4544
- Milvang-Jensen et al. (2008) Milvang-Jensen, B., et al., 2008, A&A, 482, 419
- Moore et al (1999) Moore, B., Ghigna, S., Governato, F., Lake, G., Quinn, T., Stadel, J., Tozzi, P., 1999, ApJL, 524, 19
- Moster et al. (2010) Moster B., et al., 2010, MNRAS, 710, 903 [arxiv:0906.0764]
- Myers et al (2009) Myers, S.T., et al, 2009, arXiv:0903.0401
- Navarro, Frenk and White (1997) Navarro J.F., Frenk C.S., White S.D.M., 1997, ApJ, 490, 493
- Nierenberg et al (2011) Nierenberg, A.M., Auger, M.W., Treu, T., Marshall, P.J., Fassnacht, C.D., 2011, ApJ, 731, 44
- Noh & Cohn (2011) Noh, Y., Cohn, J.D., 2011, MNRAS, 414, 2029
- Nord et al. (2008) Nord, B., Stanek, R., Rasia, E., Evrard, A.E., 2008, MNRAS, 383L, 10
- Oegerle & Hill (2001) Oegerle, W.R., Hill, J.M., 2001, AJ, 122, 2858
- Onuora & Thomas (2000) Onuora, L.I., Thomas, P.A., 2000, MNRAS, 319, 614
- Paz et al (2011) Paz, D.J., Sgro, M.A., Merchan, M., Padilla, N., 2011, MNRAS, 414, 2029
- Pennarrubia & Benson (2005) Penarrubia, J., Benson, A.J., 2005, MNRAS, 364, 977
- Pereira, Bryan & Gill (2008) Pereira, M. J., Bryan, G. L., & Gill, S. P. D., 2008, ApJ, 672, 825
- Pinkney et al. (1996) Pinkney J., Roettiger K., Burns J.O., Bird C.M., 1996, ApJS, 104, 1
- Ragone-Figueroa & Plionis (2007) Ragone-Figueroa, C., Plionis, M., 2007, MNRAS, 377, 1785
- Ramella et al (2007) Ramella, M., et al, 2007, A&A, 470, 39
- Richstone, Loeb & Turner (1992) Richstone, D., Loeb, A., Turner, E.L., 1992, ApJ, 393, 477
- Rykoff et al (2008) Rykoff, E.S., et al., 2008, MNRAS Letters, 387, 28
- Sales et al (2007) Sales, L.V., Navarro, J.F., Lambas, D.G., White, S.D.M.,Croton, D.J., 2007, MNRAS, 382, 1901
- Saro et al (2008) Saro, A., DeLucia, G., Dolag, K., Borgani,S., 2008, MNRAS, 391, 565
- Schewtschenko & Maccio (2011) Schewtschenko, J. A., Macciò, A. V., 2011, MNRAS to appear (arxiv:1012.0311)
- Shaw et al (2007) Shaw, L.D., Weller, J., Ostriker, J.P., Bode, P., 2007, ApJ, 659, 1082
- Simha et al (2009) Simha, V., Weinberg, D. H., Dave, R., Gnedin, O. Y., Katz, N., Keres, D., 2009, MNRAS, 399, 650
- Siverd, Ryden & Gaudi (2010) Siverd R.J., Ryden B.S., Gaudi B.S., 2010, preprint [arxiv:0903.2264]
- Skibba & Maccio (2011) Skibba, R., Maccio, A.V., 2011, arXiv:1103.1641
- Skibba & Sheth (2009) Skibba R.A., Sheth R.K., 2009, MNRAS, 392, 1080
- Solanes, Salvador-Sole & Gonzalez-Casado (1999) Solanes, J.M., Salvador-Sole, E., Gonzalez-Casado, G., 1999, A&A, 343, 733
- Splinter et al. (1997) Splinter, R.J., Melott, A. L., Linn, A., Buck, C., Tinker, J., 1997, ApJ, 479, 632
- Springel et al (2008) Springer, V., et al, 2008, MNRAS, 391, 1685
- Stanek et al. (2010) Stanek, R., Rasia, E., Evrard, A.E., Pearce, F., Gazzola, L., 2010, MNRAS, 403, 1072
- Steffen & Valenzuela (2008) Steffen, J.H., Valenzuela, O., 2008, MNRAS, 387, 1199
- Sunyaev & Zel’dovich (1972) Sunyaev R.A., Zel’dovich Ya.B., 1972, Comments on Astrophysics and Space Physics, 4, 173
- Taylor & Babul (2004) Taylor, J.E., Babul, A., 2004, MNRAS, 348, 811
- Taylor & Babul (2005) Taylor, J.E., Babul, A., 2005, MNRAS, 364, 535
- van de Weygaert & Bertschinger (1996) van de Weygaert, R., Bertschinger, E., 1996, MNRAS, 281, 84
- van de Weygaert (2002) van de Weygaert, R., 2002, 2002, Proceedings 2nd Hellenic Cos- mology Workshop, 0, 153ff
- van den Bosch et al (2007) van den Bosch, F. C., et al. 2007, MNRAS, 376, 841
- van Haarlem et al. (1997) van Haarlem M.P., Frenk C.S., White S.D.M, 1997, MNRAS, 287, 817
- Voit (2005) Voit, G.M, 2005, Rev Mod Phys, 77, 207
- Wang et al (2008) Wang, Y., Yang, X., Mo, H. J., Li, C., van den Bosch, F. C., Fan, Z., Chen, X., 2008, MNRAS, 385, 1511
- Wang et al (2010) Wang, Y., Park, C., Hwang, H.-S., Chen, X., 2010, ApJ 718, 762
- Weller, Ostriker & Bode (2005) Weller, J., Ostriker, J.P., Bode, P., Shaw, L., 2005,MNRAS, 364, 823
- Wetzel, Cohn & White (2009) Wetzel A., Cohn J.D., White M., 2009, MNRAS, 395, 1376
- Wetzel & White (2010) Wetzel A., White M., 2010, MNRAS, 403, 1072
- White (2002) White M., 2002, ApJS, 143, 241
- White, Cohn & Smit (2010) White, M., Cohn, J.D., Smit, R., 2010, MNRAS 408, 1818
- (131) (WCS)
- White, Hernquist & Springel (2002) White, M., Hernquist, L., Springel, V., 2002, ApJ, 579, 16
- Wojtak et al (2007) Wojtak, R., Lokas, E.L., Mamon, G.A.,Gottlober,S., Prada F., Moles M., 2007, A&A 466, 437
- Wojtak et al (2009) Wojtak, R., Lokas, E.L., Mamon, G.A.,Gottlober,S., 2009, MNRAS 399, 812
- Yang et al (2006) Yang, X., van den Bosch, F.C., Mo, H.J., Mao, S., Kang, X., Weinmann, S.M., Guo, Y., Jing, Y.P., 2006, MNRAS, 369, 1293
- Yang et al (2007) Yang X., Mo H.J., van den Bosch F.C., Pasquali, A., Li, C., Barden, M., 2007, ApJ, 671, 153
- Yang, Mo & van den Bosch (2008) Yang X., Mo H.J., van den Bosch F.C., 2009, ApJ, 693, 830
- Zabludoff & Mulchaey (1998) Zabludoff, A.I., Mulchaey, J.S. 1998, ApJ,496, 39.
- Zabludoff & Mulchaey (2000) Zabludoff, A.I.,Mulchaey, J.S. 2000, ApJ, 539, 136.
- Zabludoff et al (1996) Zabludoff, A.I., Zaritsky, D., Lin, H., Tucker, D., Hashimoto, Y., Shectman, S.A., Oemler, A., & Kirshner, R.P. 1996, ApJ, 466, 104
- Zabludoff (2007) Zabludoff, A., 2007, in Groups of Galaxies in the Nearby Universe, ESO Astrophysics Symposia 2007, ed. I. Saviane, V.D. Ivanov, J. Borissova, p. 249
- Zentner et al (2005) Zentner, A.R., Kravtsov, A.V.,Gnedin, O.Y., Klypin, A.A., 2005, ApJ, 629, 219.