The nebular spectrum of the type Ia supernova 2003hv: evidence for a non-standard event
Abstract
The optical and near-infrared late-time spectrum of the under-luminous Type Ia supernova 2003hv is analysed with a code that computes nebular emission from a supernova nebula. Synthetic spectra based on the classical explosion model W7 are unable to reproduce the large Fe iii/Fe ii ratio and the low infrared flux at year after explosion, although the optical spectrum of SN 2003hv is reproduced reasonably well for a supernova of luminosity intermediate between normal and subluminous (SN 1991bg-like) ones. A possible solution is that the inner layers of the supernova ejecta ( km s-1) contain less mass than predicted by classical explosion models like W7. If this inner region contains of material, as opposed to in Chandrasekhar-mass models developed within the Single Degenerate scenario, the low density inhibits recombination, favouring the large Fe iii/Fe ii ratio observed in the optical, and decreases the flux in the Fe ii lines which dominate the IR spectrum. The most likely scenario may be an explosion of a sub-Chandrasekhar mass white dwarf. Alternatively, the violent/dynamical merger of two white dwarfs with combined mass exceeding the Chandrasekhar limit also shows a reduced inner density.
keywords:
Supernovae: general – Supernovae: individual: SN 2003hv – Radiation mechanisms: thermal1 Introduction
Type Ia Supernovae (SNe Ia) are the most homogeneous type of stellar explosions, and one of the most luminous. They are used to constrain the energy content of the Universe and provided the first direct evidence of accelerated expansion (Riess et al., 1998; Perlmutter et al., 1999). SNe Ia are not standard candles per se, but they can be standardised (with a dispersion of mag; Germany et al., 2004; Folatelli et al., 2010), thanks to a rather tight relation between their luminosity and the shape of their light curve. This was first suggested by Phillips (1993), who parametrised the light curves of SNe Ia based on a single quantity, , the decline of the band magnitude from maximum to 15 days later.
SNe Ia come with a rather large range of luminosities. Their absolute magnitudes range from for the dimmest events like SN 1991bg (Filippenko et al., 1992; Leibundgut et al., 1993) to for the superluminous, “super-Chandrasekhar” SNe (Howell et al., 2006; Hicken et al., 2007; Scalzo et al., 2010; Taubenberger et al., 2011), but the bulk of spectroscopically normal SNe has a smaller spread, between and . These are the majority of SNe Ia. At the luminous end of this range confusion with the spectroscopically peculiar 1991T-like events may occur, since these show similar decline rates and luminosities as some spectroscopically normal SNe (e.g. SN 1999aa, Garavini et al., 2004). At the dim end, however, peculiar events similar to SN 1991bg, with mag appear to be separated from even the dimmest of the normal SNe, such as SNe 1992A or 2004eo, which have mag. Only few SNe are known that have intermediate decline rates (e.g. Taubenberger et al., 2008). A classically known example is SN 1986G ( mag, Phillips et al., 1987), which however shows many properties of the SN 1991bg group, in particular the presence of a strong Ti ii absorption trough between 4000 and 4500 Å at maximum light and the evolution of the Si ii absorption velocity (Benetti et al., 2005).
Since 1991bg-like SNe Ia are almost exclusively observed in early-type galaxies (Hamuy et al., 2000) the question arises whether they may have entirely different progenitors. For the bulk of SNe Ia a carbon-oxygen (CO) white dwarf accreting hydrogen in a binary system has traditionally been the scenario of choice, because it is thought to be able to give rise to homogeneous explosions. The observed range of SN luminosities can be attributed to the synthesis of different amounts of 56Ni in the explosion (Arnett, 1982; Branch, 1992; Riess et al., 1996; Cappellaro et al., 1997; Contardo et al., 2000; Mazzali et al., 2007a; Stritzinger et al., 2006). The most promising way to tune this parameter is given by the explosion scenario known as Delayed Detonation (Khokhlov, 1991), although the details of the transition from subsonic to supersonic burning are not clear. A recently revived alternative scenario is that some fraction of the SNe Ia come from the merging of two white dwarfs whose combined mass exceeds the Chandrasekhar mass (Iben & Tutukov, 1984; Webbink, 1984; Pakmor et al., 2010). Another scenario is the explosion of a white dwarf with a mass below the Chandrasekhar limit. This is thought to occur if the white dwarf accretes helium from a companion. the helium shell which builds up is very unstable and can detonate, triggering the explosion of the entire star (Woosley & Weaver, 1994; Livne & Arnett, 1995). This scenario was not favoured because it was reported to lead to inconsistent SN spectra (Nugent et al., 1997). However, Sim et al. (2010) present sub-Chandrasekhar SN Ia models where the overlying He layer is omitted and suggest that these models reproduce the observed range of light curve properties of SNe Ia (from intermediate to dim), and that spectra obtained from their models also resemble observed spectra.
Still, most SNe Ia, excluding perhaps the least luminous, 1991bg-like ones, seem to be consistent with the Chandrasekhar mass (Mazzali et al., 2007a).
A powerful method of investigating the properties of SN ejecta is late-time spectroscopy, which probes the inner layers of the SN. Mazzali et al. (2010) showed that the simultaneous availability of optical and infrared (IR) late-time spectra makes it possible to account for all the most abundant elements produced in a SN, and to infer their abundances. Not many late-time IR spectra are available for SNe Ia. One of the best examples is SN 2003hv. Motohara et al. (2006) published IR spectra which Leloudas et al. (2009) rescaled to match IR photometry taken at an epoch similar to that of a mid-IR spectrum (Gerardy et al., 2007).
This is not the only thing that makes SN 2003hv interesting. The SN has a decline rate mag (Leloudas et al., 2009). A SN Ia with such a decline rate could be the missing link between spectroscopically normal SNe Ia and underluminous SNe of the 1991bg class. SN 2003hv may be the first well-observed SN with this decline rate. Leloudas et al. (2009) presented a very good data set covering the post-maximum phase.
Additionally, SN 2003hv was noted for the peculiar shifts of several nebular IR emission lines, some of which also seem to show flat tops (Gerardy et al., 2007; Motohara et al., 2006; Maeda et al., 2010a). Leloudas et al. (2009) find that similar displacements are observed in the optical lines of [Fe ii]. This was interpreted as possibly the indication of a high-density neutron-capture region, where stable 58Ni and 54Fe rather than radioactive 56Ni are produced. This region would peculiarly be displaced from the centre of the explosion (Maeda et al., 2010a). This finding led to further work in this direction (Maeda et al., 2010b), which is however not the subject of the present paper.
Leloudas et al. (2009, Fig.7) showed a synthetic optical/near-IR spectrum based on the classical explosion model W7 (Nomoto et al., 1984). This is a Chandrasekhar-mass model, with kinetic energy erg, which was developed to account for the bulk properties of SNe Ia (Branch et al., 1985) and has been used as a standard reference to describe this class of SNe. While the overall reproduction of the spectrum is good, they encountered a few problems, which they mentioned and discussed (Leloudas et al., 2009). Most evidently, the near-IR flux ( Å) is overestimated by the model by a factor of a few. Additionally, the ratio of the two strongest optical features, the Fe-dominated lines near 4700 and 5200 Å, is not reproduced. While the bluer feature is dominated by [Fe iii] lines, the redder one is predominantly due to [Fe ii] transitions. The bluer feature is well reproduced in Leloudas et al. (2009), while the redder one is overestimated by about a factor of 2. Since most of the near-IR lines whose flux is also overestimated are themselves [Fe ii] transitions this seems to indicate that the ionization balance in the SN 2003hv nebula is different from that predicted by W7. Among other possibilities, Leloudas et al. (2009) suggest that the lack of near-IR flux might be attributed to a sudden onset of an infrared catastrophe in the densest region of clumpy ejecta. The IR catastrophe (IRC) is a sudden shift of the nebular emission to mid-IR lines, which occurs when the temperature of the SN nebula becomes sufficiently low (Axelrod, 1980). Leloudas et al. (2009) argue that an IRC may have occurred at earlier times, and that this may be possible if the ejecta are clumpy. They also find that positrons are likely to be fully trapped.
Given the special role of SN 2003hv as a possible link between normal and subluminous SNe Ia, and the significance of the late-time data available, we have tried to reproduce these data with our nebular code. This paper is organised as follows: in Section 2 we briefly describe our nebular code; in Section 3 we show and discuss synthetic spectra obtained adopting different scenarios; in Section 4 we discuss the time evolution of the nebular emission; in Section 5 our results are recapped and discussed. Finally, Section 6 concludes the paper.
2 Method
Leloudas et al. (2009) present a combined optical, near-IR and mid-IR spectrum of SN 2003hv in the nebular phase. The optical spectrum was obtained at the ESO-VLT 320 days after -band maximum. The near-IR spectrum was obtained at Subaru 394 days after -band maximum (Motohara et al., 2006), while the mid-IR spectrum was obtained from Spitzer 358 days after -band maximum (Gerardy et al., 2007). Since the optical and IR data were not obtained simultaneously, Leloudas et al. (2009) rescaled the optical spectrum and the near-IR spectrum to match the photometry of day 355 after maximum, the epoch of the mid-IR observations. Given the relatively short time elapsed between the optical and near-IR observations, it can be hoped that the spectrum did not evolve much in shape. We use the data presented in Fig. 7 of Leloudas et al. (2009).
At these late times, the spectrum of SN 2003hv is dominated by nebular emission. The gas is optically thin to optical and IR radiation, and it is heated by the deposition of the rays and positrons from the decay of 56Co to 56Fe (56Ni has almost completely decayed to 56Co). Collisional heating is balanced by cooling via emission, and the energy is released in a number of line transitions, most of which are forbidden.
We use a non-local thermodynamic equilibrium (NLTE) nebular code which was developed by Mazzali et al. (2001) and is based on ideas of Axelrod (1980) and Ruiz-Lapuente & Lucy (1992). Although a three-dimensional version is available (Maurer et al., 2010a) the code was used in its one-dimensional version here. Our (one-dimensional) models consist of about 20 radial shells of varying density and composition. The emission and deposition of rays and positrons is computed with a Montecarlo scheme, following Cappellaro et al. (1997) and Lucy (2005), using effective opacities for rays and positrons.
After energy deposition, an iteration process is initiated. Starting with an initial guess for the ionisation state and the temperature of the gas, non-thermal ionisation and excitation rates are derived using the Bethe and the optical approximation respectively (Axelrod, 1980; Rozsnyai et al., 1980; Maurer & Mazzali, 2010), which have been shown to be accurate to at least 20% for H and He (Maurer et al., 2010b). For other elements the accuracy of these approximations is difficult to estimate, since there is a strong dependence on poorly known atomic data. Since our nebular code neglects radiation transport, there is no photo-ionisation. The collisional ionisation rates are balanced with the radiative and the di-electronic recombination rates taken from Aldrovandi & Pequignot (1973). Charge exchange reactions are not considered. After obtaining the new ionisation state and consequently a new electron density, the level population of each ion is derived by solving a matrix containing collisional (de-)excitation and radiative de-excitation rates. The radiative rates are reduced according to the Sobolev optical depths of the corresponding lines. Knowing all the level populations, a radiation field can be generated and can be compared to the total deposited luminosity. The electron temperature (and consequently the electron density) is then adjusted in each iteration step, until the total luminosity of the radiation field has converged to the deposited luminosity.
The code can treat the neutral and singly ionized states of H, He, C, N, O, Ne, Na, Mg, Si, S, Ar & Ca and the singly and doubly ionized states of Fe, Co & Ni. For light and intermediate-mass elements typically the lowest 10 20 levels are taken into account in the excitation calculation. For iron-group elements roughly the 100 lowest energy levels of each ion are considered. Collisional data are available for several hundred transitions of H, He, C, N, O, Ne, Na, Mg, Si, S, Ar, Ca, Fe, Co & Ni. Most of the collisional data are taken from Axelrod (1980) or from online databases (e.g. TIPTOP111http://cdsweb.u-strasbg.fr/OP.htx, A. Pradhan222http://www.astronomy.ohio-state.edu/pradhan/) and are updated frequently. Collisional data are available for the most important forbidden lines, but those for Co are unfortunately very poor. If not available, the collision strength of forbidden lines is crudely set to 0.01 (Axelrod, 1980), where and are the statistical weights of the lower and the upper atomic level respectively. Unknown collisional data for allowed transitions are obtained in the van Regemorter (1962) approximation.
Although missing collisional data pose a problem for all kinds of nebular calculations, the largest uncertainties in our calculations are caused by neglecting photo-ionization. It is clear that the neutral species of the iron-group elements are photo-ionized almost completely in SNe Ia at the epochs of interest (200 - 400 days after the explosion). To simulate this effect, Fe i, Co i and Ni i are not included in our calculation. The ratio of Fe iii to Fe ii is determined by the non-thermal electron ionisation rates, which is a good approximation. For light and intermediate-mass elements the problem is more serious and it is not clear if we can produce the ionisation state of those elements correctly. However, since our synthetic spectra are dominated by Fe ii and Fe iii emission lines, we expect them to be reliable within the uncertainties of the atomic data.
The code has been used to investigate the morphology and composition of the spectra of various SNe (e.g. Mazzali et al., 2005, 2007b). A 1-zone version makes it possible to derive very quickly the basic properties of the emitting nebula (mass, energy, composition) using the maximum observed emission line velocity as an outer boundary. In a more sophisticated stratified version the density varies as a function of velocity (which is equivalent to radius in the homologously expanding SN nebula) and so do the abundances. These can be modified in order to reproduce the observations, yielding a rather accurate description of the structure of the SN ejecta. The density structure can be taken from a model calculation (e.g. W7, Tanaka et al., 2011), but it can also be derived from the emitted luminosity and the line shapes.
For all calculations we adopt for SN 2003hv a distance modulus of 31.58 mag (Leloudas et al., 2009) and a reddening mag (Schlegel et al., 1998). Reddening within the host galaxy is negligible (Leloudas et al., 2009).

3 Models
The late-time optical spectra of SNe Ia are dominated by strong emission in forbidden lines at and 5200 Å. The features are broadened because they are blends of many lines, so that their width is larger than the real velocity of the emitting gas. The bluer feature is dominated by [Fe iii] lines (, 4658, 4667, 4701, 4734, 4755, 4881), with some [Fe ii] lines (, 4874, 4890) also contributing, while the redder one has comparable contributions of [Fe ii] (, 5159, 5222, 5262) and [Fe iii] lines (, 5412). A correlation exists between the width of the features and the luminosity of the SN as described by the light-curve decline paramater (Mazzali et al., 1998). This is because a more luminous SN burns more of the progenitor white dwarf into 56Ni, which is observed at late times as Fe emission. The availability of the near-IR spectrum makes it possible to study all elements that are supposed to be abundantly synthesised in a thermonuclear explosion.
To begin with, we compare the optical spectrum of SN 2003hv to those of other SNe Ia with similar decline rates. Figure 1 shows the blue part of the nebular spectra of 4 SNe Ia: SN 2003hv ( mag), SN 1986G (Phillips et al., 1987, mag), SN 2004eo (Pastorello et al., 2007, mag), and SN 1989B (Wells et al., 1994, mag). With the exception of SN 2003hv all spectra are from the Asiago database. They have all been corrected for reddening, and are plotted after normalizing at the peak of the 4700 Å line. SN 1986G has the narrowest emission lines, as may be expected given that this SN has the most rapidly declining light curve. The other 3 SNe have all rather similar line width. SN 2003hv stands out for the much higher ratio of the 4700 Å emission feature with respect to the 5200 Å one.
We begin with modelling the optical spectrum alone. For this purpose we use the optical spectrum calibrated to the original photometry of the epoch when it was actually observed, 320 days after maximum, thus avoiding any unforeseen evolution between then and the epoch of the near- or mid-IR spectrum. We discuss here various models.
3.1 One-zone models
We use the one-zone version of the code in order to determine the velocity width of the emitting nebula, assuming that it is spherically symmetric. The emission lines of SN 2003hv can be reproduced for a width of the emitting region of km s-1. We also measure the FWHM of the 4700Å line, finding a value of km s-1. Both of these values are consistent with Fig.2 of Mazzali et al. (1998), indicating that SN 2003hv is located at the edge of the distribution of normal SNe Ia, close to SNe 1986G and 1993L. The value of that would be obtained from the fit shown in Figure 2 of Mazzali et al. (1998) is mag. The photometric value ( mag; Leloudas et al., 2009) is different but not inconsistent, given the large dispersion of the relation shown in Mazzali et al. (1998).
However, SN 2003hv stands out because it shows a much larger ratio of the bluer, Fe iii-dominated line near 4700 Å over the redder, Fe ii-dominated one near 5200 Å (see Fig.1). Reddening towards SN 2003hv is small. SNe 1989B and 1986G are both highly reddened ( and 0.60 mag; Wells et al., 1994; Phillips et al., 1999, respectively), but even when this is corrected for a clear difference remains. The same is true if we compare SN 2003hv with SN 2004eo, which has a lower reddening ( mag, Pastorello et al., 2007) and similar line width.
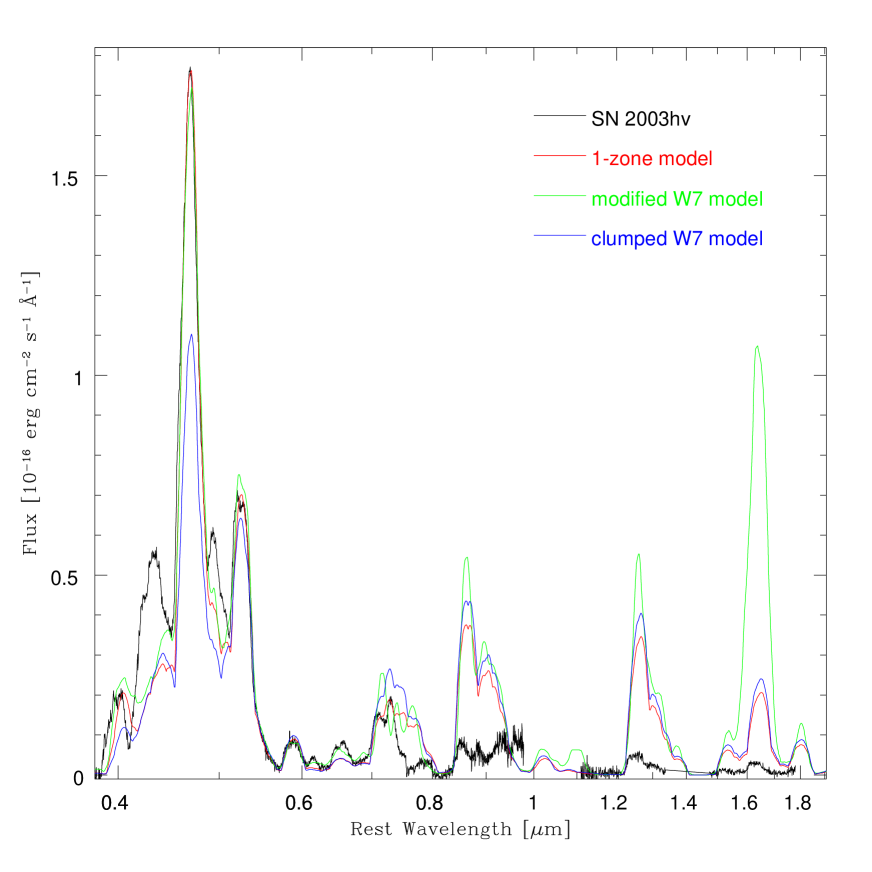
A reasonable 1-zone model for the optical spectrum of SN 2003hv is obtained for a 56Ni mass of and is shown in Figure 2. This is actually rather a large value for the SN decline rate: for SN 2004eo, with mag, Mazzali et al. (2008) found M(56Ni) . However, this value is consistent with the estimate of Leloudas et al. (2009) based on the luminosity at peak. The main reason for the large 56Ni mass is indeed the need to fit the strong Fe iii emission. The large Fe iii/Fe ii ratio () which characterizes the model is obtained assuming that no stable 54Fe is present in the centre. This isotope acts only as a coolant and its effect is to reduce the ionization of Fe. Not introducing stable Fe keeps the ionization ratio high. Co and Ni have a similar ionization state as Fe. Intermediate-mass elements (IME) are more highly ionized. The mass used in the model within 8000 km s-1 is only , which is less than in 1-zone models for the other SNe (e.g., SN 2004eo requires within 7300 km s-1) and significantly less than the prediction of W7 (, Iwamoto et al., 1999). So, in the 1-zone model, SN 2003hv has a small mass at low velocities, and most of it seems to have been burned to 56Ni.
Although the 1-zone model does a reasonable job of reproducing the optical spectrum, it can be seen to fail already in the reddest part: the [Fe ii] emission lines redwards of Å are overestimated. This becomes even worse in the near-IR, as is shown in Figure 2.
There are therefore several different lines of evidence indicating that SN 2003hv may not conform with the norm of SNe Ia. This can be further studied using stratified models.
3.2 Stratified models: W7
In the stratified version, our nebular code can be used to test specific explosion models, or, as we do here, to construct a best-fitting density-abundance distribution by fitting observations. Mazzali et al. (2007a) fitted the late-time spectra of 23 SNe Ia of different luminosities using the density distribution of W7. They changed the 56Ni content by modifying the outer extent of this species, as guided by the width of the observed nebular lines of Fe. They found that not only the mass and distribution of 56Ni correlates with the luminosity: evidence that the distribution of IME such as silicon and sulphur is complementary to that of nuclear statistical equilibrium (NSE) material suggests that most of the material which is not burned to Fe-group elements must have been burned to IME. This supports the notion of a common mass for all SNe Ia, or at least for most of them, excluding perhaps 1991bg-like events (Hachinger et al., 2009).
Here we test whether the W7 density distribution can be compatible with SN 2003hv. The W7 model (Nomoto et al., 1984) was created to fit the basic properties of average SNe Ia. The underlying assumption is that SNe Ia result from the deflagration of Chandrasekhar-mass C-O white dwarfs. We now know that this is at best a secondary channel to the production of SNe Ia (Sahu et al., 2008). However, the density-velocity distribution of W7 is representative of typical SN Ia explosions: delayed detonation models are indeed very similar (Iwamoto et al., 1999).
Using the W7 density structure, and modifying only the abundances as in Mazzali et al. (2007a), it is possible to get a reasonable fit of the optical spectrum of SN 2003hv (Figure 2). This model has M(56Ni) , similar to the 1-zone model. 56Ni is located between 2000 and 10000 km s-1, with abundances peaking at % at 5000-7000 km s-1 (Figure 3). Stable 54Fe is located only in the innermost region, below 4000 km s-1: the total mass of 54Fe is , as in W7 (Iwamoto et al., 1999). IME must already be present as deep as km s-1 and become dominant above km s-1, otherwise the mass of 56Ni would be too large and the Fe lines too broad. Regions above 10000 km s-1 are not sensitive to the nebular treatment as their density is too low.
The synthetic spectrum basically reproduces the results of Leloudas et al. (2009), showing that the two codes give consistent results. While the blue part of the spectrum reproduces SN 2003hv, the emission lines in the red part of the optical spectrum as well as in the near-IR are obviously too strong (Figure 2). Most of the lines in those regions are due to [Fe ii]. The strongest features in the bluer part of the optical spectrum, on the other hand, are either dominated by [Fe iii] (the line near 4700 Å) or have a non-negligible [Fe iii] contribution (the line near 5200 Å). This suggests that the ionization degree of Fe is too low in the model. This cannot be improved as long as the high central density that characterizes W7 is kept. Another reason for the low ionization is that in the inner part of the ejecta stable Fe-group isotopes dominate. The role of these isotopes is only that of a coolant. Replacing stable Fe-group isotopes with 56Ni would increase the ionization because of the added heating, but it would also lead to an increase of the luminosity. Replacing them with IME would further increase the [Fe ii]-[Si i] line near m, which is already too strong (Figure 2), and replacing them with oxygen would cause an emission line due to [O i] 6300, 6363Å (Kozma et al., 2005), which is not observed. In any case, none of these changes would be justified by explosion physics, since some neutron-rich material should be synthesised at the high central density of a Chandrasekhar-mass white dwarf.

3.3 Stratified models: clumped W7
Leloudas et al. (2009) suggest that if the inner ejecta were clumped the lack of near-IR radiation may be explained because cooling would be less efficient than in the absence of clumping. Our code allows the simulation of clumping in density: if we define a filling factor , the gas is assumed to be concentrated in clumps which fill a fraction of the volume. We tested a density clumping scenario with a moderate filling factor of 0.5, which does not affect the -ray deposition. The result of this is that the higher density in the clumps actually favours recombination, and further decreases the Fe iii/Fe ii ratio. A model with clumping is shown in Figure 2. The synthetic spectrum is still characterised by a high ratio of near-IR to optical flux. Therefore, moderate clumping in density is unlikely to explain the observations of SN 2003hv.
3.4 Stratified models: a modified density
Since there seems to be no solution for the spectrum of SN 2003hv using a W7 density, we next investigate whether different density structures might lead to better results. The advantage of modelling nebular-phase spectra of SNe Ia is that photoionization can be, to a first approximation, neglected in the iron core (see Section 2). Combined with the homologous expansion of the SN ejecta, this makes nebular spectroscopy a very powerful tool. If the properties (density and abundances) of a certain velocity shell are modified while the rest of the nebula is left unaffected it is possible to derive the properties of that specific velocity shell. Thus we can test in a rather uncomplicated way whether modifications in the density structure can lead to an ionization ratio which favours Fe iii more than W7 does.
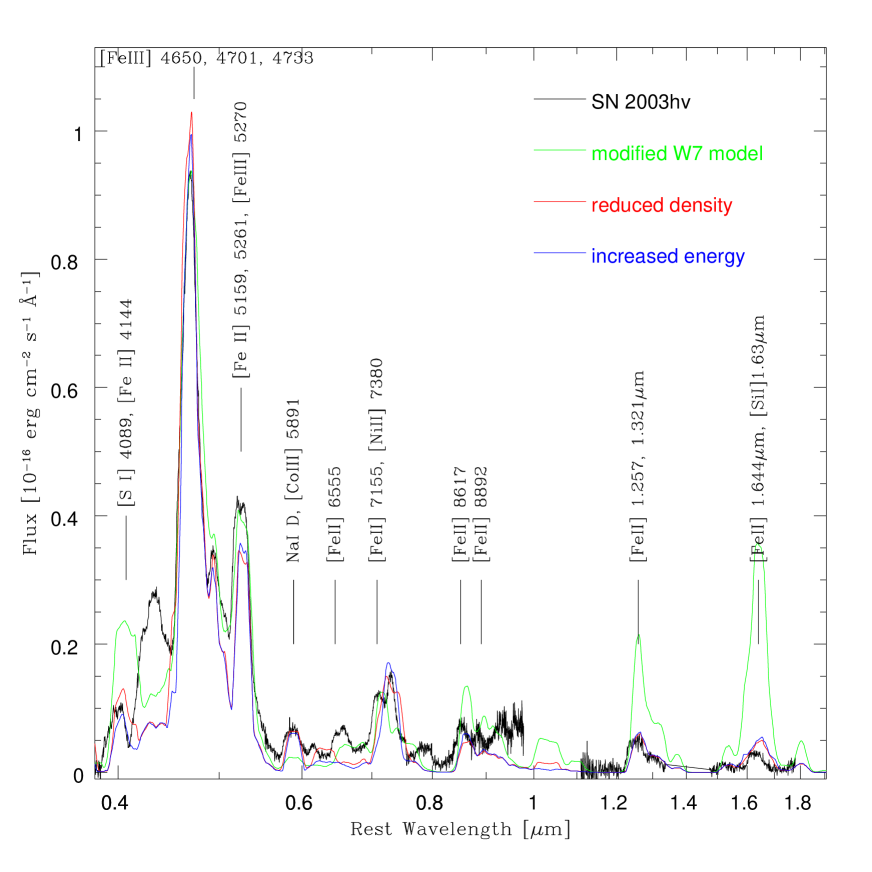
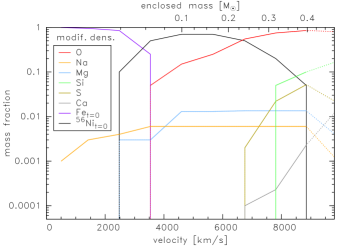
Qualitatively, in order to increase the ionization of the gas the recombination rate should be reduced, which could be achieved with lower densities. Alternatively, the ionization rate should be increased, which can be obtained by reducing the ratio of stable versus radioactive NSE elements. This suggests that the density in the regions where the lines are emitted may be smaller than in W7 (see also Maeda et al., 2010a), and that this may best be achieved by reducing the content of stable NSE material, as already found in the one-zone model (Section 3.1). Therefore we arbitrarily decreased the W7 density in the inner part of the ejecta, where the emission lines are produced. This was achieved mostly by removing stable NSE material. The outer layers, which cannot be probed in the nebular phase because their density is too low, were left as in W7. At every step, we also modified the abundances in order to obtain as good a match to the data as possible, both in the optical and, in particular, in the near-IR. We modelled the optical/near-IR spectrum, now rescaled to a common epoch of day 355 after maximum following Leloudas et al. (2009). The modified model has only of material with km s-1. In W7, this is .
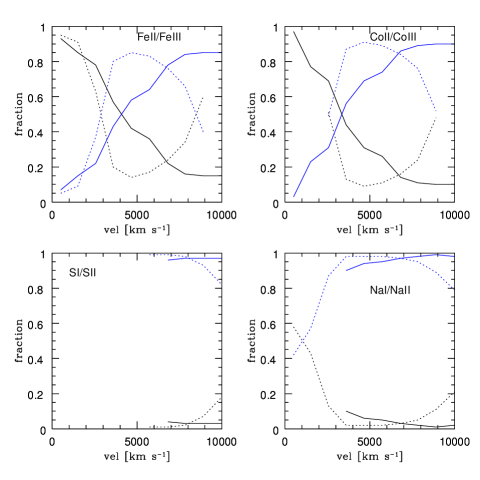
The resulting synthetic spectrum is shown in Figures 4 and 5 (red line). As expected, we indeed find that when a reduced density is used the ionization degree is increased with respect to the W7-based model (Fig.4, green line). This leads to a reduced flux in the red and the near-IR, which is the main result we tried to achieve. At the same time, the increased ionization causes the [Fe iii] 4700 Å line to become somewhat stronger with respect to the 5200 Å line, where both [Fe iii] and [Fe ii] lines contribute. The ratio of these two Fe lines is not perfectly reproduced, as we tried to obtain a synthetic spectrum that reproduced the observed one as well as possible over a wide wavelength range. A major deficiency is the line near 4300 Å which is much too weak. A synthetic [Fe ii] line at 4416Å is present, but it is not very strong. [Fe ii] 6555 Å is also too weak. Increasing the strength of those lines would lead to the overestimate of other [Fe ii] lines, as in Leloudas et al. (2009). The emission line near 1.6 m does not show a flat top: this would require a three-dimensional study (see Maeda et al., 2010a) since this and other features characterized by a flat top are peculiarly blueshifted in the data (Motohara et al., 2006). In our model rays deposit in the central zone, and flat tops are not expected. Figure 5 shows a blow-up of the red/near-IR part of the spectrum.
The various density profiles tested in the paper are shown in Figure 6. The 56Ni mass included in the reduced-density model is only , and the mass of stable NSE elements (mostly 54Fe) is , in both cases much less than in W7 (which has a 56Ni mass of and a stable NSE mass of , Iwamoto et al., 1999). Some reduction of the 56Ni mass is always seen when going from 1-zone models to stratified ones, and it results from the increased energy deposition in the densest inner layers of a stratified model (e.g. Mazzali et al., 2007b). In the case of SN 2003hv, however, this reduction is dramatic. It is explained by the significantly reduced near-IR luminosity in the new model. There is now a large discrepancy with the estimate from the maximum of the light curve, a result also obtained by Leloudas et al. (2009) when comparing the peak and the tail of the light curve. Figure 7 shows the abundance distribution for this model, and Figure 8 the ionization of some key elements, compared to the model based on the W7 density distribution.
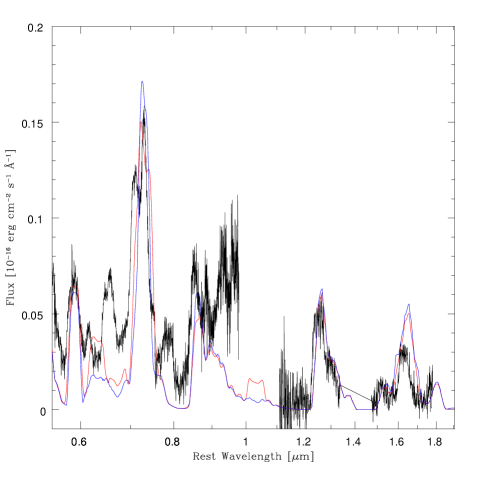
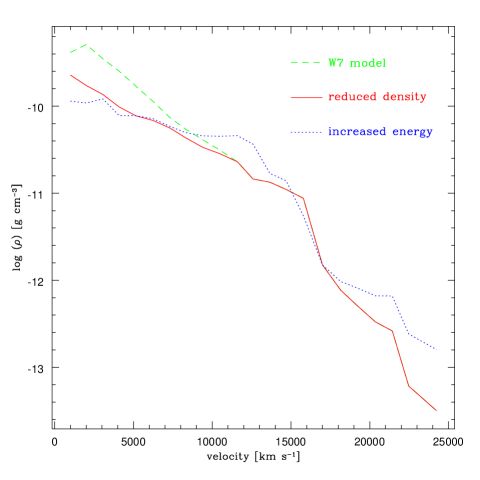
Finally, we computed a spectrum for a model where the mass which is missing at low velocities, compared to the W7 model, is located at high velocities. The mass which has been removed from the densest inner layers is added at higher velocity in this model (Figure 6) so that the width of the emission lines is not increased. This model produces a similar nebular spectrum as the one with reduced mass (Figures 4 and 5). Nebular models cannot explore the properties of the outer layers. This requires modelling the early-time spectra (e.g. Hachinger et al., 2009). Only then may a complete model for the SN be defined.
4 Evolution of the optical/near-IR spectrum
We have shown that the optical/near-IR spectrum of the underluminous but spectroscopically normal SN Ia 2003hv at year after explosion can be better reproduced if the emitting mass, which is located mostly at km s-1, is significantly reduced with respect to what is predicted by a standard explosion model such as W7. Delayed detonation models have a similar density distribution as W7 in the inner layers (Höflich et al., 1995; Iwamoto et al., 1999, Fig. 3). The reduced mass in our model is required by the relatively high ionization of the gas, as signalled by the unusual strength of the [Fe iii] optical emission lines relative to the [Fe ii] lines as well as by the unexpectedly low near-IR flux, which again consists mostly of [Fe ii] lines.
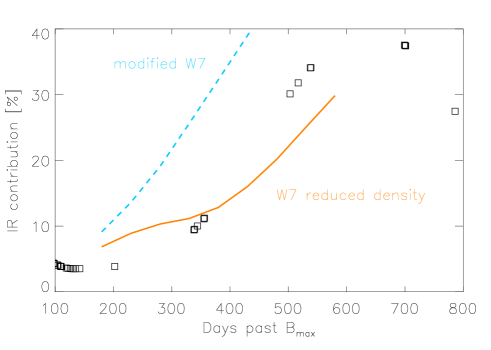
Leloudas et al. (2009, Fig. 8) have shown that the contribution of the near-IR flux to the emitted spectrum increases from 5 % of the UVOIR flux (Leloudas et al., 2009, the mid-IR flux is not included in this estimate) at –200 days to % at about 1 year, and reaches a maximum of % at days. We have tested whether our model can reproduce this trend. We have computed spectra at different epochs and integrated the flux to determine the relative near-IR contribution as a function of time. The results are show in Figure 9: although our model with a modified inner density does not reproduce the observed values exactly, it is much closer to the observed trend than the W7-based model. This adds support to the idea that SN 2003hv had a mass at low velocities significantly smaller than what Chandrasekhar-mass models predict (Maeda et al., 2010a).
We have not extended the calculations to beyond 600 days, because at those epochs emission is expected to shift to the mid-IR, and many of the relevant lines are not included in our code.
5 Discussion: mass and risetime
Our best-fit model has a mass of inside 10000 km s-1. The 56Ni mass is . By contrast, a model like W7 has a mass of inside the same velocity. Models based on W7, with varying abundance distributions (in particular different 56Ni masses) have successfully been used with our code to reproduce the nebular spectra of SNe Ia of different luminosities (e.g. Stehle et al., 2005; Mazzali et al., 2008; Tanaka et al., 2011). The difference we see in this case suggests that SN 2003hv may have been the result of a different type of explosion, with a mass that is distributed differently in velocity and may be different from the Chandrasekhar mass.
5.1 Mass estimates and uncertainties
Here we address some uncertainties inherent to our mass estimates. The nebular model presented above has a smaller mass than W7 in the inner part ( km s-1). It preserves the density-velocity structure of W7 at higher velocities, but those layers are not probed by nebular spectroscopy. Our model probably somewhat underestimates both the 56Ni mass and the mass at low velocities, for two reasons. First, the low-level flux between the strong optical emission lines is not well reproduced: our synthetic flux in the optical region is lower than the observed one by %. Secondly, the flux emerging in the mid-IR contributes % to the total SN luminosity 358 days after the explosion (Leloudas et al., 2009), while this fraction is only 3% in our synthetic spectrum.
The missing continuum in our synthetic model is the consequence of the absence of UV radiation transport in our nebular code. It is known that UV excitation and fluorescence are reponsible for such continua (Li & McCray, 1996). The missing mid-IR flux is probably caused by atomic transitions at energies of about 0.1 eV and less, which are responsible for mid-IR emission but are partially missing in the nebular code. Since an increase in flux can be obtained by increasing either the mass of 56Ni or the total emitting mass (in both cases the energy deposited in the nebula increases), both the 56Ni mass and the emitting mass (within 10000 km s-1) could be increased by a factor . Since our model has an emitting mass of within 10000 km s-1, when this correction is applied we get an emitting mass of . As for the 56Ni mass, in our models we obtained . This then becomes . Both values are still significantly smaller than the corresponding values in W7, which has a mass of inside of 10000 km s-1 and a 56Ni mass of .
Other sources of uncertainty can affect our result. The distance we adopted ( mag) was derived matching the light curve of SN 2003hv to template light curves (Leloudas et al., 2009). This is 0.2 mag larger than the corrected SBF distance to the host galaxy of SN 2003hv, NGC 1201 (31.37 mag, Tonry et al., 2001; Jensen et al., 2003). If we had used the SBF distance, both the 56Ni mass and the total mass would be smaller than what we have derived by % (alternatively, either the 56Ni mass or the total mass might be smaller by up to %). The extinction to SN 2003hv is quite small, so that our results are basically insensitive to its exact value.
We have tested whether the mass which is missing in the inner layers may be located at high velocities by computing a model where we increased the density of shells above 10000 km s-1 so as to preserve the Chandrasekhar mass of the ejecta. The corresponding spectrum, which is shown in Figure 4, is not easy to distinguish from that of the model with a lower mass. This is because, even with an increased mass, the density in the outer layers is still too low to trap rays and produce line emission at the epoch of the nebular spectrum of SN 2003hv.
An abundance tomography experiment such as that performed for SN 2005bl (Hachinger et al., 2009) would be required to determine the mass and energy in the outer layers. We plan to perform such an analysis in the near future.
5.2 56Ni mass and risetime
Leloudas et al. (2009) derive a 56Ni mass of from the light curve peak applying Arnett’s rule (Arnett, 1982) as calibrated by Stritzinger et al. (2006) using the formula
| (1) |
which is calibrated for a risetime days. They perform a simple light curve analysis and find that this value is however inconsistent with the late part of the light curve, which requires a 56Ni mass of . They also show a synthetic nebular spectrum which is much brighter than the observations.
Leloudas et al. (2009) suggest various possibilities to explain this discrepancy, including an early near-IR catastrophe which causes the flux to shift to the far-IR. An early IR catastrophe seems not to be supported by the data, because we have seen that the gas is still quite highly ionised even at later times, and is charachterised by temperatures well in excess of 1000 K. An IRC occurring only in the innermost layers, a possibility suggested by Leloudas et al. (2009), would probably not transfer enough energy to the far-IR.
On the other hand, our model with a reduced mass at low velocity is capable of reproducing the late-time flux for a 56Ni mass similar to what Leloudas et al. (2009) find from the late light curve. This leaves open the question of why such different 56Ni masses can be derived from the early and the late data, which usually are in good agreement (Stritzinger et al., 2006). Although Arnett’s rule may not be highly accurate, a factor of 2 difference is a large discrepancy.
We suggest that a simple solution to the problem can be found if the density in the inner part of the ejecta is reduced. The 56Ni mass was estimated from the peak of the light curve using the formula above, which assumes that light curve maximum occurs 19 days after the explosion (Stritzinger et al., 2006). However, if the light curve risetime of SN 2003hv was significantly smaller than 19 days, this discrepancy may be resolved. Using the dependence of the luminosity on the 56Ni mass and the risetime as given in Eq.5 of Stritzinger & Leibundgut (2005) yields the curve shown in Figure 10. Adopting the estimate of the 56Ni mass from the nebular models () instead of the value obtained by Leloudas et al. (2009) from the peak of the light curve and an estimated risetime of 19 days (), i.e. reducing the 56Ni mass by (0.22/0.40) = 0.55, a risetime days would be inferred. This would reflect the rapid decline of the light curve, while the 56Ni mass estimate from the nebular spectrum would hardly be affected by this choice of risetime, since the decay time of 56Co, which powers the SN light curve at these advanced stages, is much longer.

A risetime of days is short for SNe Ia. Estimates of the typical risetimes in the literature have decreased from days, a result based on extrapolating the rising part of the light curve (Riess et al., 1999; Aldering et al., 2000), to values between days (Conley et al., 2006) and days (Garg et al., 2007; Hayden et al., 2010), based on direct observations of SNe. Both of these values are significantly larger than what would be required in order to bring the early- and late-time estimates of the 56Ni mass in SN 2003hv into agreement. On the other hand, methods based on fitting the rising part of the light curve yield shorter risetimes, which are possibly correlated to the decline rate (Strovink, 2007), when only SNe with a sufficiently well sampled pre-maximum photometry are analysed. The fastest decliner in Hayden et al. (2010) and Strovink (2007) is SN 2004eo ( mag; Pastorello et al., 2007), for which they estimate days. However, shorter risetimes have been inferred or observed. SN 1994D ( mag) is quoted to have days (Strovink, 2007; Hayden et al., 2010). Hayden et al. (2010) observed a few SNe with days. The incidence of rapid risers is much higher for dimmer SNe ( mag), although these SNe are much more seldom seen than brighter ones. Extrapolating the relation in Figure 2 of Strovink (2007) to the decline rate of SN 2003hv, mag, a risetime of days is expected, in agreement with the result of Hayden et al. (2010).
A further suggestion of a short risetime of SN 2003hv comes from an attempt to compute the light curve properties in an approximate way as done in Mazzali et al. (2007a). Adopting a total mass of , and assuming that this is distributed for as 56Ni, as stable Fe-group material, and that most of the remaining mass located inside of km s-1() has been burned to IME, this yields a nuclear energy release of erg. Subtracting from this the binding energy of a white dwarf of , erg, an explosion energy erg is obtained. Combined with an estimate of the opacity as discussed in Mazzali et al. (2007a), this yields a characteristic bolometric LC width of days. Looking at Fig. 2 of Mazzali et al. (2007a), this would correspond to a peak luminosity of only erg s-1, which is much less than the observed value erg s-1. Therefore SN 2003hv does not seem to comply with the correlations established for SNe Ia: the 56Ni mass derived assuming a relation to the peak luminosity calibrated for a risetime of 19 days is too high for the decline rate of the SN.
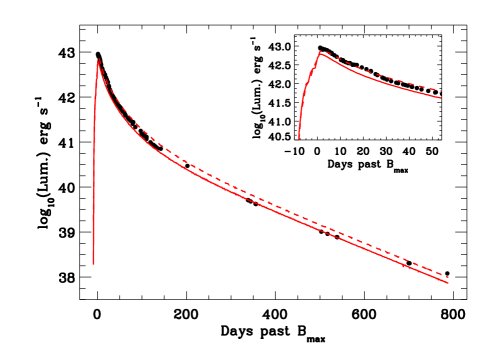
We finally tested the possible risetime for SN 2003hv using the same grey Montecarlo light curve code which could successfully reproduced the bolometric light curves of other SNe Ia (e.g. Stehle et al., 2005; Mazzali et al., 2008; Tanaka et al., 2011). We use the “reduced density” model derived from nebular spectroscopy and shown in Fig. 6. The model has a mass of inside 10000 km s-1. Outside of this velocity we simply assume the W7 density distribution. The total mass is therefore , the 56Ni mass is , and the kinetic energy erg. We also used the same definition of the opacity as a function of chemical species (Mazzali et al., 2007a) as in those papers. The resulting bolometric light curve is shown in Figure 11. The risetime of the synthetic light curve is short, days. We compare this synthetic light curve to the UVOIR light curve of SN 2003hv (Leloudas et al., 2009) in Fig.11, and find good agreement in shape from the earliest observations, which are near maximum, to the latest ones, days later. The rising part of the light curve is not constrained by the data. Since we could derive the distribution of 56Ni from the nebular spectra only, we have not included any 56Ni at km s-1. If some 56Ni was present at higher velocities, the rising part of the light curve would be smoother, and the peak may be reached a little earlier. Figure 11 also shows a model where both the 56Ni mass and the total mass located at velocities km s-1 are multiplied by a factor 1.25, reflecting inaccuracies of the nebular-epoch modelling (see Section 5.1). The light curve for this model reaches peak somewhat later ( days after explosion) and is overall mag brighter. In both cases the inconsistency between the peak and the tail of the light curve is eliminated.
The reason for the rapid rise is that not only the inner ejecta have low density, and that the total mass of Fe-group species is quite small (), which keeps the opacity low. This is compounded by a normal ejecta velocity (the maximum-light spectrum of SN 2003hv has a Si ii line velocity of km s-1). Although what we have used here is by no means a realistic explosion model, the result that we obtained is nevertheless suggestive.
6 Conclusions
The high ionization and low near-IR flux in the nebular phase of SN 2003hv can be best explained if this SN Ia ejected less mass at low velocities than in standard single-degenerate, Chandrasekhar-mass explosion models. In particular, the mass of stable NSE elements is greatly reduced. The smaller mass may lead to a short rise time, which would also solve the apparent inconsistency between the 56Ni mass derived from the peak of the light curve and the nebular epoch. Therefore, the 56Ni mass obtained from the peak luminosity using a relation which has been calibrated for a rise time of 19 days may be incorrect.
Two alternative scenarios exist to the single-degenerate, Chandrasekhar-mass one. One is the explosion of sub-Chandrasekhar mass white dwarfs. This involves a CO white dwarf accreting He from a companion and an edge-lit explosion (Livne, 1990; Woosley & Weaver, 1994; Livne & Arnett, 1995; Fink et al., 2010). Sim et al. (2010) calculated light curves of sub-Chandrasekhar models which do not consider how the explosion is triggered. Their more massive models predict risetimes of days. In those models, however, Fe-group elements are much more abundant than in the model we have derived, which is likely to result in a larger optical opacity. Their least massive model () has a risetime of 14 days, which is comparable to our result. In this model 56Ni is more concentrated towards the centre than the distribution we have derived for SN 2003hv (Fig.7; Sim et al., 2010, Fig. 1), and the kinetic energy is smaller ( erg compared to erg). The diffusion time of optical photons may therefore be comparable in SN 2003hv despite the slightly larger mass.
The other scenario is the merging of two white dwarfs (Iben & Tutukov, 1984; Webbink, 1984), and in particular the case of dynamical mergers (Pakmor et al., 2010). This results in an explosion ejecting at least a Chandrasekhar mass, but the two merging white dwarfs had mass smaller than the Chandrasekhar mass, and consequently lower central densities. This is reflected in the density distribution of the SN ejecta.
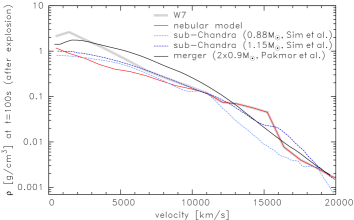
In Fig. 12 we compare the density structures of W7, of a merger model with total mass (Pakmor et al., 2010), of two sub-Chandrasekhar models, with total mass 0.88 and and 56Ni mass of 0.07 and , respectively (Sim et al., 2010), and the density structure we derived from our nebular model. We stress that our model is reliable only inside of 10000 km s-1. In the inner ejecta ( km s-1) the two sub-Chandrasekhar models and the density distribution we derived actually look quite similar. A model with 56Ni mass similar to that of SN 2003hv is not available.
It will be interesting to submit all non-standard models to the test of nebular spectroscopy. Clearly, the availability of flux-calibrated near-IR spectra at late times is an important piece of information if we want to discriminate among different models.
The exact incidence of SNe with a non-standard origin is not known. In most SNe Ia, optical nebular spectra do not suggest a high Fe iii/Fe ii ratio. A dominance of Fe iii over Fe ii is deduced also in the innermost core of SN 1991bg, for which an improved fit to a series of nebular spectra can also be obtained by slightly reducing the mass at low velocities (Mazzali et al., in preparation). Both SNe 2003hv and 1991bg are characterised by a low luminosity, although the former is still spectroscopically normal at maximum. A possibility is that all SNe Ia at the dim end of the distribution are the result of non-standard explosions, possibly of sub-Chandrasekhar mass white dwarfs.
The final question is whether the unexpectedly low near-IR flux, which is one of the characteristics that leads to a low mass estimate for SN 2003hv, is typical of other SNe Ia. Late-time near-IR spectroscopy is available only for two other SNe Ia, 2003du and 2005W (Motohara et al., 2006). There are also a couple of photometric observations in the near-IR, for SNe 2000cx and 2001el (Sollerman et al., 2004; Stritzinger & Sollerman, 2007). In both of these cases, the ratio of near-IR to optical flux indicated a lower near-IR flux than expected from standard models like W7. While it is possible that other SNe may be accommodated in scenarios where the inner mass is reduced with respect to classical models based on this evidence, we refrain from making that suggestion here. Near-IR and mid-IR spectrophotometry would be required to be more confident about any such statement. In particular, SN 2000cx was very bright, indicating that most of the inner part of the white dwarf progenitor had been burned to NSE. Also, spectroscopic modelling did not indicate the need for a low density in the innermost layers (Mazzali et al., 2007a).
In conclusion, near-IR spectrophotometry of SNe Ia in the nebular phase has proved to be a very important source of information in the case of SN 2003hv. It is to be hoped that such observations will be performed routinely for nearby SNe Ia (as well as other Type I SNe) in the future.
Acknowledgments
We thank Fritz Röpke and Rudiger Pakmor for providing the density structure of their explosion models. We gratefully acknowledge helpful conversations with Wolfgang Hillebrandt, and thank Keiichi Maeda for useful comments on an earlier version of this manuscript. P.A.M. and S.B. are partially supported by PRIN-INAF 2009 project “Supernovae Variety and Nucleosynthesis Yields”. S.T. acknowledges support by the TRR33 “The Dark Universe” of the German Research Foundation .
References
- Aldering et al. (2000) Aldering, G., Knop, R., & Nugent, P. 2000, AJ, 119, 2110
- Aldrovandi & Pequignot (1973) Aldrovandi, S. M. V., & Pequignot, D. 1973, A&A, 25, 137
- Arnett (1982) Arnett, W. D. 1982, ApJ, 253, 785
- Arnett et al. (1985) Arnett, W. D., Branch, D., & Wheeler, J. C. 1985, Nat, 314, 337
- Axelrod (1980) Axelrod, T. S. 1980, Ph.D. Thesis, Univ. of California, Santa Cruz
- Benetti et al. (2005) Benetti, S., et al. 2005, ApJ, 623, 1011
- Branch (1992) Branch, D. 1992, ApJ, 392, 35
- Branch et al. (1985) Branch, D., Doggett, J. B., Nomoto, K., & Thielemann, F.-K. 1985, ApJ, 294, 619
- Cappellaro et al. (1997) Cappellaro, E., Mazzali, P. A., Benetti, S., Danziger, I. J., Turatto, M., della Valle, M., & Patat, F. 1997, A&A, 328, 203
- Conley et al. (2006) Conley, A., et al. 2006, AJ, 132, 1707
- Contardo et al. (2000) Contardo, G., Leibundgut, B., & Vacca, W. D. 2000, A&A, 359, 876
- Filippenko et al. (1992) Filippenko, A. V., et al. 1992, AJ, 104, 1543
- Fink et al. (2010) Fink, M., Röpke, F. K., Hillebrandt, W., Seitenzahl, I. R., Sim, S. A., & Kromer, M. 2010, A&A, 514, A53
- Folatelli et al. (2010) Folatelli, G., et al. 2010, AJ, 139, 120
- Garavini et al. (2004) Garavini, G., et al. 2004, AJ, 128, 387
- Germany et al. (2004) Germany, L. M., Reiss, D. J., Schmidt, B. P., Stubbs, C. W., & Suntzeff, N. B. 2004, A&A, 415, 863
- Garg et al. (2007) Garg, A., et al. 2007, AJ, 133, 403
- Gerardy et al. (2007) Gerardy, C. L., et al. 2007, ApJ, 661, 995
- Hachinger et al. (2009) Hachinger, S., Mazzali, P. A., Taubenberger, S., Pakmor, R., & Hillebrandt, W. 2009, MNRAS, 399, 1238
- Hamuy et al. (2000) Hamuy, M., Trager, S. C., Pinto, P. A., Phillips, M. M., Schommer, R. A., Ivanov, V., & Suntzeff, N. B. 2000, AJ, 120, 1479
- Hayden et al. (2010) Hayden, B. T., et al. 2010, ApJ, 712, 350
- Hicken et al. (2007) Hicken, M., Garnavich, P. M., Prieto, J. L., Blondin, S., DePoy, D. L., Kirshner, R. P., & Parrent, J. 2007, ApJL, 669, L17
- Höflich et al. (1995) Höflich, P., Khokhlov, A. M., & Wheeler, J. C. 1995, ApJ, 444, 831
- Howell et al. (2006) Howell, D. A., et al. 2006, Nat, 443, 308
- Iben & Tutukov (1984) Iben, I., Jr., & Tutukov, A. V. 1984, ApJS, 54, 335
- Iwamoto et al. (1999) Iwamoto, K., Brachwitz, F., Nomoto, K., Kishimoto, N., Umeda, H., Hix, W. R., & Thielemann, F.-K. 1999, ApJS, 125, 439
- Jensen et al. (2003) Jensen, J. B., Tonry, J. L., Barris, B. J., Thompson, R. I., Liu, M. C., Rieke, M. J., Ajhar, E. A., & Blakeslee, J. P. 2003, ApJ, 583, 712
- Khokhlov (1991) Khokhlov, A. M. 1991, A&A, 245, 114
- Kozma et al. (2005) Kozma, C., Fransson, C., Hillebrandt, W., Travaglio, C., Sollerman, J., Reinecke, M., Röpke, F. K., & Spyromilio, J. 2005, A&A, 437, 983
- Leibundgut et al. (1993) Leibundgut, B., et al. 1993, AJ, 105, 301
- Leloudas et al. (2009) Leloudas, G., et al. 2009, A&A, 505, 265
- Livne (1990) Livne, E. 1990, ApJL, 354, L53
- Livne & Arnett (1995) Livne, E., & Arnett, D. 1995, ApJ, 452, 62
- Li & McCray (1996) Li, H., & McCray, R. 1996, ApJ, 456, 370
- Lucy (2005) Lucy, L. B. 2005, A&A, 429, 19
- Maeda et al. (2010a) Maeda, K., Taubenberger, S., Sollerman, J., Mazzali, P. A., Leloudas, G., Nomoto, K., & Motohara, K. 2010a, ApJ, 708, 1703
- Maeda et al. (2010b) Maeda, K., et al. 2010b, Nat, 466, 82
- Maurer & Mazzali (2010) Maurer, I., & Mazzali, P. A. 2010, MNRAS, 408, 947
- Maurer et al. (2010a) Maurer, J. I., et al. 2010, MNRAS, 402, 161
- Maurer et al. (2010b) Maurer, I., Mazzali, P. A., Taubenberger, S., & Hachinger, S. 2010, MNRAS, 409, 1441
- Mazzali et al. (1998) Mazzali, P. A., Cappellaro, E., Danziger, I. J., Turatto, M., & Benetti, S. 1998, ApJL, 499, L49
- Mazzali et al. (2001) Mazzali, P. A., Nomoto, K., Patat, F., & Maeda, K. 2001, ApJ, 559, 1047
- Mazzali et al. (2005) Mazzali, P. A., et al. 2005, Science, 308, 1284
- Mazzali et al. (2007a) Mazzali, P. A., Röpke, F. K., Benetti, S., & Hillebrandt, W. 2007, Science, 315, 825
- Mazzali et al. (2007b) Mazzali, P. A., et al. 2007, ApJ, 670, 592
- Mazzali et al. (2008) Mazzali, P. A., Sauer, D. N., Pastorello, A., Benetti, S., & Hillebrandt, W. 2008, MNRAS, 386, 1897
- Mazzali et al. (2010) Mazzali, P. A., Maurer, I., Valenti, S., Kotak, R., & Hunter, D. 2010, MNRAS, 408, 87
- Motohara et al. (2006) Motohara, K., et al. 2006, ApJL, 652, L101
- Nomoto et al. (1984) Nomoto, K., Thielemann, F.-K., & Yokoi, K. 1984, ApJ, 286, 644
- Nugent et al. (1997) Nugent, P., Baron, E., Branch, D., Fisher, A., & Hauschildt, P. H. 1997, ApJ, 485, 812
- Pakmor et al. (2010) Pakmor, R., Kromer, M., Röpke, F. K., Sim, S. A., Ruiter, A. J., & Hillebrandt, W. 2010, Nat, 463, 61
- Pastorello et al. (2007) Pastorello, A., et al. 2007, MNRAS, 377, 1531
- Perlmutter et al. (1999) Perlmutter, S., et al. 1999, ApJ, 517, 565
- Phillips et al. (1987) Phillips, M. M., et al. 1987, PASP, 99, 592
- Phillips (1993) Phillips, M. M. 1993, ApJL, 413, L105
- Phillips et al. (1999) Phillips, M. M., Lira, P., Suntzeff, N. B., Schommer, R. A., Hamuy, M., & Maza, J. 1999, AJ, 118, 1766
- Riess et al. (1996) Riess, A. G., Press, W. H., & Kirshner, R. P. 1996, ApJ, 473, 88
- Riess et al. (1998) Riess, A. G., et al. 1998, AJ, 116, 1009
- Riess et al. (1999) Riess, A. G., et al. 1999, AJ, 118, 2675
- Rozsnyai et al. (1980) Rozsnyai, B. F., Jacobs, V. L. &Davis, J., 1980, Phys. Rev. A, 21, 1798
- Ruiz-Lapuente & Lucy (1992) Ruiz-Lapuente, P., & Lucy, L. B. 1992, ApJ, 400, 127
- Sahu et al. (2008) Sahu, D. K., et al. 2008, ApJ, 680, 580
- Scalzo et al. (2010) Scalzo, R. A., et al. 2010, ApJ, 713, 1073
- Schlegel et al. (1998) Schlegel, D. J., Finkbeiner, D. P., & Davis, M. 1998, ApJ, 500, 525
- Sim et al. (2010) Sim, S. A., Röpke, F. K., Hillebrandt, W., Kromer, M., Pakmor, R., Fink, M., Ruiter, A. J., & Seitenzahl, I. R. 2010, ApJL, 714, L52
- Sollerman et al. (2004) Sollerman, J., et al. 2004, A&A, 428, 555
- Stehle et al. (2005) Stehle, M., Mazzali, P. A., Benetti, S., & Hillebrandt, W. 2005, MNRAS, 360, 1231
- Stritzinger & Leibundgut (2005) Stritzinger, M., & Leibundgut, B. 2005, A&A, 431, 423
- Stritzinger et al. (2006) Stritzinger, M., Mazzali, P. A., Sollerman, J., & Benetti, S. 2006, A&A, 460, 793
- Stritzinger & Sollerman (2007) Stritzinger, M., & Sollerman, J. 2007, A&A, 470, L1
- Strovink (2007) Strovink, M. 2007, ApJ, 671, 1084
- Tanaka et al. (2011) Tanaka, M., Mazzali, P. A., Stanishev, V., Maurer, I., Kerzendorf, W. E., & Nomoto, K. 2011, MNRAS, 410, 1725
- Taubenberger et al. (2008) Taubenberger, S., et al. 2008, MNRAS, 385, 75
- Taubenberger et al. (2011) Taubenberger, S., et al. 2011, MNRAS, 412, 2735
- Tonry et al. (2001) Tonry, J. L., Dressler, A., Blakeslee, J. P., Ajhar, E. A., Fletcher, A. B., Luppino, G. A., Metzger, M. R., & Moore, C. B. 2001, ApJ, 546, 681
- van Regemorter (1962) van Regemorter, H. 1962, ApJ, 136, 906
- Webbink (1984) Webbink, R. F. 1984, ApJ, 277, 355
- Wells et al. (1994) Wells, L. A., et al. 1994, AJ, 108, 2233
- Woosley & Weaver (1994) Woosley, S. E., & Weaver, T. A. 1994, ApJ, 423, 371